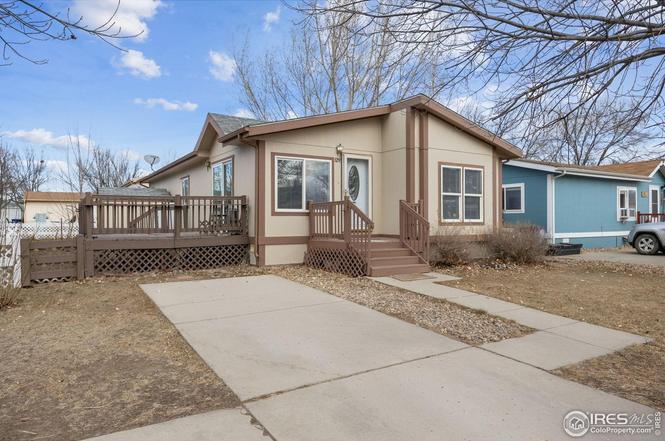
3291 Mammoth #179 · Firestone, CO
Flood risk No data
- FEMA flood zone
- —
- Chance of flooding over 30 yrs
- —
- Est. flood insurance / yr
- —
Fire risk No data
- Est. fire insurance / yr
- —
Heat risk No data
- Hot days now (above threshold)
- —
- Hot days in 30 yrs
- —
Wind risk No data
- Chance of severe wind over 30 yrs
- —
Air-quality risk No data
- Unhealthy air days now
- —
- Unhealthy air days in 30 yrs
- —
Risk factors via First Street. Map © Google.
Why this score? — see what drove the C+ grade
The composite is a weighted blend of 9 inputs, each scored 0–100. Each bar is that input's sub-score; the figure is the points it added to the 100-point composite (weight × sub-score).
- Cash flow +30.0/30.0
- DSCR +10.0/10.0
- 1% rule +8.6/10.0
- Schools +3.8/10.0
- Livability +3.7/5.0
- Condition / age +2.5/5.0
- Rent growth +1.9/5.0
- ARV discount +0.0/15.0
- Appreciation +0.0/10.0
$185,000
🖨 Deal sheet (PDF) 📄 Offer letter ✓ Due diligence
Listing remarks
Easy living in a conveniently located resort style community full of amenities and charm! This extremely well-cared for home is located in a quiet corner of this popular, sought-after neighborhood. Parks, playgrounds, open spaces, picnic areas, basketball courts, a clubhouse with a gym and a swimming pool all make Longview a wonderful place to call home. The sunny south facing front porch is so welcoming. Stepping inside, the open concept living-kitchen-dining arrangement with vaulted ceilings, and sunny skylights, will instantly make you feel at home. All of the light fixtures, ceiling fans and carpeting are new as well as the beautiful new wood and tile flooring which also makes for easy
Key facts
- New carpeting
- New ceiling fans
- New light fixtures
Tags
Property features AI
Finance
- Other: No property improvements reported; Sun-oriented features and energy-efficient windows/doors contributing to southern exposure
- HOA & community: No association fees
Exterior
- Parking: No garage; No designated parking features listed
- Security: Fire alarm
- Utilities: District water with meter installed; Public sewer; Natural gas available (Xcel); Electricity available; Cable and satellite available; High-speed internet available; Trash service by Longview
- Home design: Manufactured home in park
- Construction: Frame construction; Composition roof; Post and pier foundation; Built with low-pile carpet in some areas for accessibility; Level driveway and lot for accessibility
- Exterior features: Deck; Storage structure; Land lease; Fenced yard; Level lot; Cul-de-sac location; Wooded with evergreen and deciduous trees; House faces south; City limits; Paved roads with curbs, gutters and sidewalks; Street light nearby; Fire hydrant within 500 feet; Privately maintained road up to county standards; Asphalt road surface; Minimal flood risk (C rating)
Interior
- Kitchen: Electric range; Self-cleaning oven; Dishwasher; Refrigerator; Microwave; Disposal
- Bedrooms: 3 bedrooms
- Flooring: Wood flooring
- Bathrooms: 2 full bathrooms
- Heating & cooling: Forced air heating; Evaporative cooling; Ceiling fans
- Interior features: Eat-in kitchen; Separate dining room; Cathedral ceilings; Open floorplan; Walk-in closet(s); Kitchen island; Window coverings; Fire alarm
- Laundry & utility: Washer; Dryer
Neighborhood map
What this means for you Summary
Snapshot
- This is a 3-bed/2.0-bath manufactured listed at $185k.
Deal economics
- At list price, monthly cash flow is $886 ($11k/yr) — positive.
- The deal already cash-flows at list — no discount required.
- Meets the 1% rule at list price ($3k rent vs $185k).
- Recommended offer: $163k (12.0% below list) — sets the bar for market timing.
- Cap rate 12.0% vs local median 2.9% in Firestone — top-decile yield for the area; either an underpriced asset or a hidden risk that comps aren't pricing in. Stress-test before assuming the spread holds.
Location & tenants
- Location reads 73/100 on livability (#44 in CO) — a middle-class / working-renter tenant base. Strengths: employment A+, housing A+, crime A; Watch: amenities F, commute F, cost of living F.
- St. Vrain Valley School District No. Re1J (suburban): math 32% / reading 51% proficiency, ranked #23 of 86 in CO (top 27%) — families likely to look elsewhere, expect single-tenant / working-renter base with shorter leases.
- Zoned schools: Mead Elementary School (math 27% / reading 57%, grade F, #321 of 966 statewide, top 35%, 833 students, 19% FRL); Mead High School (math 34% / reading 59%, grade D-, #137 of 381 statewide, top 36%, 1,119 students, 25% FRL).
- Market conditions: Rents soft (-2.3%/yr); 534 active listings in the ZIP; 4 comparable units currently listed for rent nearby; rentals at typical pace (median 22d on market — plan ~3-4 weeks tenant-placement turnaround); high-income renter base; 3,170 units permitted in Weld County in 2024 (278 in 5+ unit buildings).
Forward outlook
- Local home prices are declining (-3.0%/yr); year-one equity from $1k of loan paydown is wiped out by about $6k of value loss. Plan a longer hold.
- Weld County population projected at +46% by 2050 — long-run rental-demand tailwind backs the buy-and-hold thesis.
- At projected returns (-3.0% appreciation + 0.0% rent growth), your $52k cash investment doubles in ~8 years — after that, you're playing with house money.
Negotiation context
- It's been on market 151 days — a 12% lower offer ($163k) is reasonable based on typical stale-listing flexibility.
Questions for the listing agent
- It's been on market 151 days. Have you received any prior offers? Is the seller open to a 12% concession, seller financing, or rate buy-down credit?
- Why hasn't it sold? Are there any deal-killer items the seller is aware of (foundation, flood, title, zoning, code violations)?
- Is there a deadline driving the sale (1031 exchange, divorce, estate, relocation)? That informs how much negotiation room exists.
- What's the average days-on-market for RENTAL listings here right now (not sales)? A rising rental-DOM trend means longer vacancies and softer asking-rent achievability than the comps imply.
- What's the recent tenant-quality profile in this submarket — average credit score on applications, eviction rate, late-payment / NSF rate, and stable-employment percentage? A property-management company in the area should have these aggregated.
- How much new for-sale + rental construction is in the pipeline within 1–3 miles? Heavy new supply typically softens prices + rents 12–24 months out; constrained supply supports both.
Investment metrics
- 1% rule
- 1.36% ✓
- Cap rate
- 12.04%
- Cash-on-cash
- 20.53%
- DSCR
- 1.91
- GRM
- 6.1
CMA / ARV
- ARV (on-the-fly)
- $156,000
- Comps found
- 12
Show comp detail 12 sales within ~0.75 mi
| Address | Dist | Beds/Ba | Sqft | Sold | Price | $/sf | Match |
|---|---|---|---|---|---|---|---|
| 3340 Longview Blvd #379 | 0.19mi | 2/2.0 (-1) | 1,232 (+3%) | 3mo | $99,000 | $80 | 79 |
| 3340 Longview Blvd | 0.19mi | 2/2.0 (-1) | 1,232 (+3%) | 3mo | $99,900 | $81 | 79 |
| 11305 Bryce #231 | 0.19mi | 2/2.0 (-1) | 1,248 (+4%) | 4mo | $162,500 | $130 | 76 |
| 3272 N Rim | 0.12mi | 3/2.0 | 1,056 (-12%) | 3mo | $98,400 | $93 | 72 |
| 3272 N Rim #136 | 0.11mi | 3/2.0 | 1,056 (-12%) | 3mo | $98,400 | $93 | 72 |
| 11191 Longview Blvd #263 | 0.26mi | 2/2.0 (-1) | 1,215 (+1%) | 11mo | $200,000 | $165 | 72 |
| 11090 Zion #326 | 0.37mi | 2/2.0 (-1) | 1,232 (+3%) | 4mo | $140,000 | $114 | 70 |
| 11090 Zion | 0.37mi | 2/2.0 (-1) | 1,232 (+3%) | 4mo | $140,000 | $114 | 70 |
| 11465 Far Vw #114 | 0.04mi | 3/2.0 | 1,056 (-12%) | 11mo | $169,900 | $161 | 69 |
| 11128 Bluff | 0.37mi | 2/2.0 (-1) | 1,232 (+3%) | 7mo | $179,000 | $145 | 68 |
| 3355 Longview Blvd #240 | 0.18mi | 3/2.0 | 1,056 (-12%) | 5mo | $139,900 | $132 | 67 |
| 11128 Bluff Ldg #1 | 0.38mi | 2/2.0 (-1) | 1,232 (+3%) | 7mo | $179,000 | $145 | 67 |
Match score weights: distance 35% · size 25% · config 20% · recency 20%. Top-matched comps best support the ARV.
Projected returns pro-forma
-3.0% appreciation · 0.0% rent growth · sell at horizon
- IRR
- 9.6%
- Equity multiple
- 1.37×
- Total profit
- $19,009
- Equity at exit
- $27,584
- IRR
- 16.3%
- Equity multiple
- 2.17×
- Total profit
- $60,385
- Equity at exit
- $15,995
Cash invested: $51,800 (down + closing). Projections, not guarantees.
Landlord ↔ Tenant lean methodology
- Overall (STATE)
- 38 Tenant-Leaning
- State Colorado
- 38 Tenant-Leaning · D+4
- County
- — inherits STATE
- City
- — inherits STATE
ZIP-level market 80504
- Rents YoY
- -2.3%
- Active inventory
- 534
- Price-to-rent
- 6.1×
Monthly cashflow live
- Estimated rent
- $2,524 medium interval (Pro) →
- Mortgage (P&I)
- −$970
- Tax from tax record
- −$60 /mo · $722/yr
- Insurance
- −$77
- HOA
- −$0
- Vacancy / Maint / Mgmt
- −$530
- Net cashflow
- $886
Break-even live
Sensitivity live
| Price | -10% $991 | -5% $939 | +0% $886 | +5% $834 | +10% $782 |
|---|---|---|---|---|---|
| Rent | -10% $687 | -5% $787 | +0% $886 | +5% $986 | +10% $1,086 |
| Rate | -1.0pp $979 | -0.5pp $933 | base $886 | +0.5pp $838 | +1.0pp $790 |
UW: 25.0% down · 7.5% · 30yr · 1.5% tax · 5.0% vac · 8.0% maint · 8.0% mgmt
Financing live
Cash to close
- Down payment
- $46,250
- Closing costs
- $5,550
- Reserves months
- —
- Total cash needed
- —
Loan-product check · same deal, 3 products live
Conventional
25% down · 7.5% · 30yr
- Down + closing
- —
- Monthly P&I
- —
- Monthly cashflow
- —
- DSCR
- —
- Eligible?
- —
Personal DTI + credit; lowest rate.
DSCR
20% down · 8.5% · 30yr
- Down + closing
- —
- Monthly P&I
- —
- Monthly cashflow
- —
- DSCR
- —
- Eligible?
- —
No personal income docs; deal must DSCR.
Hard money
10% down · 12.0% · 12mo
- Down + closing
- —
- Monthly P&I
- —
- Monthly cashflow
- —
- DSCR
- —
- Eligible?
- —
Short-term bridge; refi at stabilization.
Rent comps 4 comps
| Address | Beds | Baths | Sqft | Rent | $/sqft | DOM | Units | Dist |
|---|---|---|---|---|---|---|---|---|
| 2315 Zlaten Dr Longmont, CO | 2.0–3.0 | 2.0 | 1155 | $2,000 | $1.73 | 21d | 1 | 1.17mi |
| 2051 Zlaten Dr Longmont, CO | 3.0 | 1.0–2.0 | 993 | $2,984 | $3.01 | 14d | 32 | 1.36mi |
| 804 Summer Hawk Dr Longmont, CO | 2.0–3.0 | 1.5–2.0 | 1176 | $2,350 | $2.00 | 21d | 3 | 1.41mi |
| 1685 Cowles Ave Longmont, CO | 1.0–3.0 | 1.0–2.0 | 1098 | $2,705 | $2.46 | 14d | 29 | 1.49mi |
Listing history 16 events
-
2026-06-18days on market $185,000 Active 151 DOM
-
2026-06-17days on market $185,000 Active 150 DOM
-
2026-06-16days on market $185,000 Active 149 DOM
-
2026-06-15days on market $185,000 Active 148 DOM
-
2026-06-14days on market $185,000 Active 146 DOM
-
2026-06-13days on market $185,000 Active 145 DOM
-
2026-06-09days on market $185,000 Active 142 DOM
-
2026-06-09days on market $185,000 Active 141 DOM
-
2026-06-07days on market $185,000 Active 140 DOM
-
2026-06-02days on market $185,000 Active 135 DOM
-
2026-06-01days on market $185,000 Active 134 DOM
-
2026-05-31days on market $185,000 Active 133 DOM
-
2026-05-30days on market $185,000 Active 132 DOM
-
2026-05-16price $185,000
-
2026-03-25price $189,000
-
2026-01-18$199,000 Active
ⓘ Source: listings_history table (triggers on properties + properties_extension) + one-shot
backfill from property_details.listing_events for pre-trigger history.
Tax reassessment forecast CO · Resets to sale price
- Current annual tax
- $722 · $60/mo
- Projected year-2 tax
- $1,017 · $85/mo
- Expected delta
- +$296/yr (+$25/mo · 41.0%)
ⓘ Screening estimate from a state-policy table — verify with the county assessor before closing.
Nearby sold comps map
Loading sold comps map…
Walkable amenities ~0.75 mi
Loading nearby amenities…
Taxation est. · year 1
- Rental income
- $30,284
- − Mortgage interest
- −$10,363
- − Property taxes
- −$722
- − Insurance
- −$925
- − Repairs & maintenance
- −$2,423
- − Management
- −$2,423
- − Depreciation
- −$5,382
- Taxable income
- $8,047
- Est. tax owed @ 24.0%
- −$1,931
- After-tax cash flow
- $8,704/yr
For passive investors: Depreciation is non-cash, so a rental often shows a tax loss while cash-flowing — sheltering income. Rental losses are passive: they offset passive income freely, and up to $25,000/yr can offset ordinary (W-2) income if you actively participate and your MAGI is under $100k (phasing out to $0 by $150k); unused losses carry forward. On sale, claimed depreciation is recaptured at up to 25%, and gains may owe capital-gains tax (a 1031 exchange can defer both). Figures are a year-1 estimate at your 24.0% rate — not tax advice; consult a CPA.
Schools (NCES district)
- District
- St. Vrain Valley School District No. Re1J
- NCES district ID
- 0805370
- Math proficiency
- 32% ▼ -8.00%
- Reading proficiency
- 51% ▬ 0.00%
- Median HH income
- $71,571
- Composite
- 37.73/100
- National rank
- #4353
- State rank
- #23 of 86 in CO
Livability — Firestone
- Score
- 73/100
- State rank
- #44
- US rank
- #5060
Category grades
Schools grade is shown separately in the Schools card above.
Census & demographics
- County
- Weld County · 332,652 people
- City population
- 1,684
- Metro
- Greeley, CO
- Population (ZIP)
- 63,451
- Household income
- $113,643
- Rent vs Own
- Severe rent burden
- 1028.0
Population outlook (Weld County) Hauer SSP2
- Today (2025)
- 351,957 people
- By 2030
- 385,304 · +9.5%
- By 2040
- 451,818 · +28.4%
- By 2050
- 514,478 · +46.2%
- By 2075
- 648,733 · +84.3%
- By 2100
- 720,400 · +104.7%
Race, ethnicity, and origin ACS 2023
- Neighborhood character
- Predominantly White (68%)
- Race & ethnicity
- White 68% Hispanic / Latino 24% Two or more races 13% Asian 3%
- Hispanic origin (detail)
- Mexican 18%
- Common ancestry
- Lithuanian 3% Italian 2% Iranian 2%
- Foreign-born
- 8% · Canada, Vietnam
- Languages at home
- 84% English-only · Spanish 13% Other Asian/Pacific 1%
Political lean MEDSL · Weld
- 2024 margin
- Strong R (+21.0) · D 38.2% · R 59.2% · Other 2.6%
- 2008→2024 swing
- -12.2pp toward R · 2008: -8.7pp · 2024: -21.0pp
- All cycles
- 2024: R+21.0 2020: R+18.0 2016: R+22.4 2012: R+13.2 2008: R+8.7
Not yet ingested
- Civics
- —
Market trends
- HPI YoY
- ▼ -534.45%
- Current HPI
- 245.1351
- Rent YoY
- ▼ -2.34%
- Metro
- Greeley, CO
- State GDP YoY
- ▲ 1.95%
- F500 in state
- 14
Industry mix (Fortune 500 HQ in CO)
| Industry | F500 HQs | Revenue |
|---|---|---|
| Technology Distribution | 1 | $31B |
|
||
| Food / Agriculture | 1 | $18B |
|
||
| Packaging | 1 | $14B |
|
||
| Healthcare | 1 | $13B |
|
||
| Energy | 1 | $10B |
|
||
| Technology | 1 | $4B |
|
||
Price history
-7.0% since first listed3 events — show timeline
- 2026-05-16 Price Changed $185,000 IRES
- 2026-03-25 Price Changed $189,000 IRES
- 2026-01-18 Listed $199,000 IRES
Property tax history
+5.6%/yrLatest (2025): $722 · +588.8% YoY. Source: county tax records.
Cash-flow waterfall
monthlySold comps — $/sqft
last 12 mo · ≤1 miLoading sold comps…