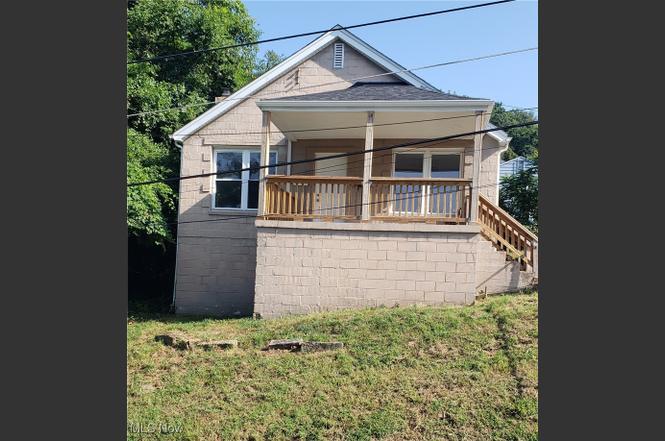
1109 Rosalie Dr · Charleston, WV
Flood risk 1/10 · Minimal
- FEMA flood zone
- X (unshaded)
- Chance of flooding over 30 yrs
- 0.0%
- Est. flood insurance / yr
- $473 – $860
Fire risk 4/10 · Minor
- Est. fire insurance / yr
- $787 – $1,461
Heat risk 4/10 · Minor
- Hot days now (above 100°F)
- 7 days/yr
- Hot days in 30 yrs
- 18 days/yr
Wind risk 2/10 · Minimal
- Chance of severe wind over 30 yrs
- 1.0%
Air-quality risk 2/10 · Minimal
- Unhealthy air days now
- 0 days/yr
- Unhealthy air days in 30 yrs
- 1 days/yr
Risk factors via First Street. Map © Google.
Why this score? — see what drove the B+ grade
The composite is a weighted blend of 9 inputs, each scored 0–100. Each bar is that input's sub-score; the figure is the points it added to the 100-point composite (weight × sub-score).
- Cash flow +30.0/30.0
- ARV discount +15.0/15.0
- DSCR +10.0/10.0
- 1% rule +8.5/10.0
- Livability +4.2/5.0
- Schools +2.9/10.0
- Rent growth +2.5/5.0
- Condition / age +2.5/5.0
- Appreciation +0.0/10.0
$99,900
🖨 Deal sheet 📄 Offer letter ✓ Due diligence
Listing remarks
BACK ON THE MARKET THROUGH NO FAULT OF THE HOME. This cozy three bedroom, one bath bungalow features an open and spacious living room/dining room combination. Brick fireplace, which is plumbed for gas, invites you to stay warm on winter nights. Interior has been refreshed. There's lots of natural light. This home is move in ready and waiting for someone to call it home.
Key facts
- Brick fireplace
- Natural light
- Move in ready
Tags
Property features AI
Exterior
- Parking: On-street parking
- Utilities: Public water; Public sewer
- Home design: Single-story home; Block construction; Composition roof; Full unfinished basement with interior entry
- Construction: Block foundation; Block construction; Composition roof
- Exterior features: Covered front porch; City lot
Interior
- Kitchen: Laminate counters; Pantry
- Bedrooms: Three main-level bedrooms with hardwood floors and natural woodwork; Some bedrooms include built-in features
- Flooring: Hardwood flooring throughout main living areas and bedrooms
- Bathrooms: One full bathroom (main level)
- Heating & cooling: Central air; Ceiling fans; Forced air heating; Gas fireplace in living room
- Interior features: Ceiling fans; Pantry; Natural woodwork; Laminate counters
- Laundry & utility: Laundry in basement
Neighborhood map
What this means for you Summary
Snapshot
- This is a 3-bed/1.0-bath single-family listed at $100k.
Deal economics
- At list price, monthly cash flow is $430 ($5k/yr) — positive.
- The deal already cash-flows at list — no discount required.
- Meets the 1% rule at list price ($1k rent vs $100k).
- Recommended offer: $88k (12.0% below list) — sets the bar for market timing.
- Cap rate 11.5% vs local median 3.8% in Charleston — top-decile yield for the area; either an underpriced asset or a hidden risk that comps aren't pricing in. Stress-test before assuming the spread holds.
Location & tenants
- Location reads 85/100 on livability (#3 in WV, #524 nationally) — a professional / high-income tenant draw. Strengths: amenities A+, commute A+, cost of living A+; Watch: crime F.
- Kanawha County Schools (suburban): math 29% / reading 40% proficiency, ranked #17 of 55 in WV (top 31%) — families likely to look elsewhere, expect single-tenant / working-renter base with shorter leases.
- Market conditions: 99 active listings in the ZIP; 103 units permitted in Kanawha County in 2024 (0 in 5+ unit buildings).
Forward outlook
- Local home prices are declining (-3.0%/yr); year-one equity from $691 of loan paydown is wiped out by about $3k of value loss. Plan a longer hold.
- Kanawha County population projected at -17% by 2050 — secular population decline; favor cash flow + early exit over multi-decade hold.
- At projected returns (-3.0% appreciation + 3.0% rent growth), your $28k cash investment doubles in ~7 years — after that, you're playing with house money.
Negotiation context
- It's been on market 195 days — a 12% lower offer ($88k) is reasonable based on typical stale-listing flexibility.
- 5 sale attempts since 11y ago with the ask held roughly flat each time — persistent listings suggest the price (not the market) is what's stuck; bring a comps-based counter.
- Current owner paid $23k; list at $100k implies a 334% gain — meaningful room to come down on a strong offer.
Risks & watch-outs
- Watch-outs: built in 1945 — expect roof / HVAC / electrical / plumbing capex.
Questions for the listing agent
- It's been on market 195 days. Have you received any prior offers? Is the seller open to a 12% concession, seller financing, or rate buy-down credit?
- Built in 1945 — when were the roof, HVAC, electrical panel, plumbing, and water heater last replaced?
- Why hasn't it sold? Are there any deal-killer items the seller is aware of (foundation, flood, title, zoning, code violations)?
- Is there a deadline driving the sale (1031 exchange, divorce, estate, relocation)? That informs how much negotiation room exists.
- Schools are A-rated — typically a magnet for longer-tenancy family renters. What's the average tenant stay here, and is there a school-zone premium baked into asking?
- Crime grade is F in this area — have there been break-ins, vandalism, or insurance claims at this property in the last 3 years? What carrier currently insures it and at what premium?
- What's the average days-on-market for RENTAL listings here right now (not sales)? A rising rental-DOM trend means longer vacancies and softer asking-rent achievability than the comps imply.
- What's the recent tenant-quality profile in this submarket — average credit score on applications, eviction rate, late-payment / NSF rate, and stable-employment percentage? A property-management company in the area should have these aggregated.
- How much new for-sale + rental construction is in the pipeline within 1–3 miles? Heavy new supply typically softens prices + rents 12–24 months out; constrained supply supports both.
Investment metrics
- 1% rule
- 1.35% ✓
- Cap rate
- 11.45%
- Cash-on-cash
- 18.44%
- DSCR
- 1.82
- GRM
- 6.2
CMA / ARV
- ARV (on-the-fly)
- $122,877
- Comps found
- 10
Show comp detail 10 sales within ~0.75 mi
| Address | Dist | Beds/Ba | Sqft | Sold | Price | $/sf | Match |
|---|---|---|---|---|---|---|---|
| 544 Burlew Dr | 0.07mi | 2/1.0 (-1) | 1,204 (+9%) | 2mo | $99,000 | $82 | 75 |
| 1308 Camden Dr | 0.23mi | 2/1.0 (-1) | 1,068 (-4%) | 11mo | $150,000 | $140 | 69 |
| 842 Greendale Dr | 0.52mi | 2/2.0 (-1) | 1,100 (-1%) | 3mo | $135,000 | $123 | 63 |
| 880 Anaconda Ave | 0.36mi | 3/1.0 | 1,260 (+14%) | 8mo | $92,500 | $73 | 54 |
| 609 Margaret St | 0.71mi | 3/1.5 | 1,128 (+2%) | 14mo | $73,000 | $65 | 50 |
| 1319 Bigley Ave | 0.49mi | 2/1.0 (-1) | 966 (-13%) | 2mo | $32,000 | $33 | 49 |
| 528 Medina St | 0.49mi | 3/1.0 | 950 (-14%) | 5mo | $105,000 | $111 | 49 |
| 313 Buchanan St | 0.47mi | 2/1.0 (-1) | 978 (-12%) | 9mo | $115,000 | $118 | 46 |
| 437 Baird Dr | 0.17mi | 2/1.0 (-1) | 943 (-15%) | 20mo | $27,500 | $29 | 45 |
| 629 Jane St | 0.72mi | 2/1.5 (-1) | 1,200 (+8%) | 21mo | $140,000 | $117 | 28 |
Match score weights: distance 35% · size 25% · config 20% · recency 20%. Top-matched comps best support the ARV.
Projected returns pro-forma
-3.0% appreciation · 3.0% rent growth · sell at horizon
- IRR
- 10.1%
- Equity multiple
- 1.40×
- Total profit
- $11,168
- Equity at exit
- $14,895
- IRR
- 19.2%
- Equity multiple
- 2.61×
- Total profit
- $44,910
- Equity at exit
- $8,638
Cash invested: $27,972 (down + closing). Projections, not guarantees.
Landlord ↔ Tenant lean methodology
- Overall (STATE)
- 83 Strongly Landlord-Friendly
- State West Virginia
- 83 Strongly Landlord-Friendly · R+22
- County
- — inherits STATE
- City
- — inherits STATE
ZIP-level market 25302
- Home prices YoY
- -21.8%
- Active inventory
- 99
- Price-to-rent
- 6.2×
Monthly cashflow live
- Estimated rent
- $1,347 medium interval (Pro) →
- Mortgage (P&I)
- −$524
- Tax from tax record
- −$69 /mo · $826/yr
- Insurance
- −$42
- HOA
- −$0
- Vacancy / Maint / Mgmt
- −$283
- Net cashflow
- $430
Break-even live
UW: 25.0% down · 7.5% · 30yr · 1.5% tax · 5.0% vac · 8.0% maint · 8.0% mgmt
Financing live
Cash to close
- Down payment
- $24,975
- Closing costs
- $2,997
- Reserves months
- —
- Total cash needed
- —
Loan-product check · same deal, 3 products live
Conventional
25% down · 7.5% · 30yr
- Down + closing
- —
- Monthly P&I
- —
- Monthly cashflow
- —
- DSCR
- —
- Eligible?
- —
Personal DTI + credit; lowest rate.
DSCR
20% down · 8.5% · 30yr
- Down + closing
- —
- Monthly P&I
- —
- Monthly cashflow
- —
- DSCR
- —
- Eligible?
- —
No personal income docs; deal must DSCR.
Hard money
10% down · 12.0% · 12mo
- Down + closing
- —
- Monthly P&I
- —
- Monthly cashflow
- —
- DSCR
- —
- Eligible?
- —
Short-term bridge; refi at stabilization.
Listing history 28 events
-
2026-06-19days on market $99,900 Active 195 DOM
-
2026-06-18days on market $99,900 Active 194 DOM
-
2026-06-17days on market $99,900 Active 193 DOM
-
2026-06-16days on market $99,900 Active 192 DOM
-
2026-06-15days on market $99,900 Active 191 DOM
-
2026-06-14days on market $99,900 Active 189 DOM
-
2026-06-12days on market $99,900 Active 188 DOM
-
2026-06-09days on market $99,900 Active 185 DOM
-
2026-06-08days on market $99,900 Active 184 DOM
-
2026-06-07remarks 372-char remark
-
2026-06-07statusdays on market $99,900 Active 183 DOM
-
2026-06-05days on market $99,900 Contingent 180 DOM
-
2026-06-03days on market $99,900 Contingent 179 DOM
-
2026-06-02days on market $99,900 Contingent 178 DOM
-
2026-06-01days on market $99,900 Contingent 177 DOM
-
2026-05-31days on market $99,900 Contingent 176 DOM
-
2026-05-30days on market $99,900 Contingent 175 DOM
-
2026-05-19historical Contingent
-
2025-12-06$99,900 Active
-
2025-11-15historical
-
2025-08-27price $99,900
-
2025-08-15$109,900 Active
-
2024-12-08historical $850
-
2024-11-30$850
-
2022-11-22$45,000
-
2016-03-18soldstatus $23,000
-
2015-12-09$27,000
-
2002-02-26soldstatus $23,000
ⓘ Source: listings_history table (triggers on properties + properties_extension) + one-shot
backfill from property_details.listing_events for pre-trigger history.
Tax reassessment forecast WV · Resets to sale price
- Current annual tax
- $826 · $69/mo
- Projected year-2 tax
- $826 · $69/mo
- Expected delta
- $0/yr ($0/mo · 0.0%)
ⓘ Screening estimate from a state-policy table — verify with the county assessor before closing.
Climate risk First Street
- Flood 1/10 Low FEMA zone X (unshaded) · 0% chance over 30 yrs
- Wildfire 4/10 Moderate
- Heat 4/10 Moderate 7 d/yr ≥100°F today · 18 d/yr by 30 yrs out
- Wind 2/10 Low 100% chance of damaging wind over 30 yrs
- Air quality 2/10 Low 0 unhealthy d/yr today · 1 by 30 yrs out
Nearby sold comps map
Loading sold comps map…
Walkable amenities ~0.75 mi
Loading nearby amenities…
Taxation est. · year 1
- Rental income
- $16,164
- − Mortgage interest
- −$5,596
- − Property taxes
- −$826
- − Insurance
- −$500
- − Repairs & maintenance
- −$1,293
- − Management
- −$1,293
- − Depreciation
- −$2,906
- Taxable income
- $3,749
- Est. tax owed @ 24.0%
- −$900
- After-tax cash flow
- $4,257/yr
For passive investors: Depreciation is non-cash, so a rental often shows a tax loss while cash-flowing — sheltering income. Rental losses are passive: they offset passive income freely, and up to $25,000/yr can offset ordinary (W-2) income if you actively participate and your MAGI is under $100k (phasing out to $0 by $150k); unused losses carry forward. On sale, claimed depreciation is recaptured at up to 25%, and gains may owe capital-gains tax (a 1031 exchange can defer both). Figures are a year-1 estimate at your 24.0% rate — not tax advice; consult a CPA.
Schools (NCES district)
- District
- Kanawha County Schools
- NCES district ID
- 5400600
- Math proficiency
- 29% ▼ -13.00%
- Reading proficiency
- 40% ▼ -7.00%
- Median HH income
- $44,329
- Composite
- 29.35/100
- National rank
- #6540
- State rank
- #17 of 55 in WV
Livability — Charleston
- Score
- 85/100
- State rank
- #3
- US rank
- #524
Category grades
Schools grade is shown separately in the Schools card above.
Census & demographics
- Census place
- Charleston, WV
- County
- Kanawha County · 33,502 people
- City population
- 33,502
- Metro
- Charleston, WV
- Population (ZIP)
- 13,204
- Household income
- $55,210
- Rent vs Own
- Severe rent burden
- 679.0
Population outlook (Kanawha County) Hauer SSP2
- Today (2025)
- 178,946 people
- By 2030
- 172,906 · -3.4%
- By 2040
- 159,874 · -10.7%
- By 2050
- 148,148 · -17.2%
- By 2075
- 123,257 · -31.1%
- By 2100
- 96,454 · -46.1%
Race, ethnicity, and origin ACS 2023
- Neighborhood character
- Predominantly White (75%)
- Race & ethnicity
- White 75% Black 14% Two or more races 8% Hispanic / Latino 3% Asian 1%
- Common ancestry
- Italian 2% Slovak 2% Iranian 1%
- Foreign-born
- 1% · South Korea
Political lean MEDSL · Kanawha
- 2024 margin
- R (+17.4) · D 40.2% · R 57.6% · Other 2.2%
- 2008→2024 swing
- -17.0pp toward R · 2008: -0.4pp · 2024: -17.4pp
- All cycles
- 2024: R+17.4 2020: R+14.7 2016: R+20.6 2012: R+11.9 2008: R+0.4
Not yet ingested
- Civics
- —
Market trends
- HPI YoY
- ▼ -44.83%
- Current HPI
- 160.7081
- Rent YoY
- —
- Metro
- Charleston, WV
- State GDP YoY
- —
- F500 in state
- 0
Price history
+334.3% since first listed11 events — show timeline
- 2026-05-19 Contingent — MLSNOW
- 2025-12-06 Listed $99,900 MLSNOW
- 2025-11-15 Listing Removed — MLSNOW
- 2025-08-27 Price Changed $99,900 MLSNOW
- 2025-08-15 Listed $109,900 MLSNOW
- 2024-12-08 Rental Removed $850 APPFOLIO
- 2024-11-30 Listed for Rent $850 APPFOLIO
- 2022-11-22 Listed $45,000 KVBOR
- 2016-03-18 Sold (MLS) $23,000 KVBOR
- 2015-12-09 Listed $27,000 KVBOR
- 2002-02-26 Sold (Public Records) $23,000 Public Records
Property tax history
+2.3%/yrLatest (2025): $826 · +0.0% YoY. Source: county tax records.
Cash-flow waterfall
monthlySold comps — $/sqft
last 12 mo · ≤1 miLoading sold comps…