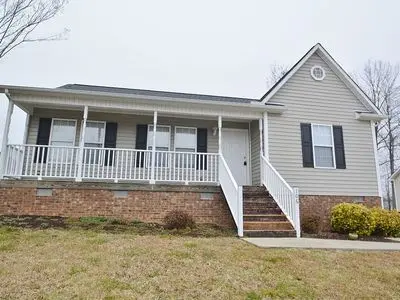
106 Manning Way · Elon, NC
Flood risk 1/10 · Minimal
- FEMA flood zone
- X (unshaded)
- Chance of flooding over 30 yrs
- 0.0%
- Est. flood insurance / yr
- $507 – $1,088
Fire risk 1/10 · Minimal
- Est. fire insurance / yr
- $906 – $1,684
Heat risk 6/10 · Moderate
- Hot days now (above 104°F)
- 7 days/yr
- Hot days in 30 yrs
- 18 days/yr
Wind risk 5/10 · Moderate
- Chance of severe wind over 30 yrs
- 21.0%
Air-quality risk 2/10 · Minimal
- Unhealthy air days now
- 2 days/yr
- Unhealthy air days in 30 yrs
- 2 days/yr
Risk factors via First Street. Map © Google.
Why this score? — see what drove the D grade
The composite is a weighted blend of 9 inputs, each scored 0–100. Each bar is that input's sub-score; the figure is the points it added to the 100-point composite (weight × sub-score).
- Cash flow +14.8/30.0
- ARV discount +6.5/15.0
- DSCR +4.5/10.0
- Livability +4.0/5.0
- 1% rule +3.0/10.0
- Schools +3.0/10.0
- Rent growth +2.5/5.0
- Condition / age +2.5/5.0
- Appreciation +0.0/10.0
$275,000
🖨 Deal sheet (PDF) 📄 Offer letter ✓ Due diligence
Listing remarks MLS
ADORABLE 4BR HOME IN ELON! CEILING FANS THROUGHOUT! EAT IN KITCHEN-OPEN TO SPACIOUS DEN W/VAULTED CEILING & LAMINATE FLOORING! LUXURY MBA W/SOAKING TUB, SEPARATE SHOWER AND DUAL VANITIES!OVERSIZED DECK FOR ENTERTAINING! LARGE LOT W/STORAGE SHED!
Key facts
- Vaulted ceiling
- Soaking tub
- Eat in kitchen
Tags
Neighborhood map
What this means for you Summary
Snapshot
- This is a 4-bed/2.0-bath single-family listed at $275k.
Deal economics
- At list price, monthly cash flow is $77 ($924/yr) — positive.
- The deal already cash-flows at list — no discount required.
- To meet the 1% rule (rent ≥ 1% of price), the offer needs to be $220k (20.0% below list).
- Recommended offer: $220k (20.0% below list) — sets the bar for 1% rule.
- Cap rate 6.6% vs local median 2.3% in Elon — top-decile yield for the area; either an underpriced asset or a hidden risk that comps aren't pricing in. Stress-test before assuming the spread holds.
Location & tenants
- Location reads 81/100 on livability (#17 in NC, #1,573 nationally) — a professional / high-income tenant draw. Strengths: crime A+, housing A+, health & safety A+; Watch: commute F.
- Alamance-Burlington Schools (rural): math 30% / reading 40% proficiency, ranked #133 of 178 in NC (top 75%) — families likely to look elsewhere, expect single-tenant / working-renter base with shorter leases.
- Market conditions: 108 active listings in the ZIP; 6 comparable units currently listed for rent nearby; rentals at typical pace (median 23d on market — plan ~3-4 weeks tenant-placement turnaround); solid renter incomes; 2,466 units permitted in Alamance County in 2024 (403 in 5+ unit buildings).
- This rent runs 35% of the median local income ($75k/yr) — at the standard rent-burdened threshold; future hikes will face affordability resistance.
Forward outlook
- Local home prices are declining (-3.0%/yr); year-one equity from $2k of loan paydown is wiped out by about $8k of value loss. Plan a longer hold.
- Alamance County population projected at +19% by 2050 — long-run rental-demand tailwind backs the buy-and-hold thesis.
Negotiation context
- It's been on market 22 days — a 2% lower offer ($271k) is reasonable based on typical stale-listing flexibility.
- 4 sale attempts since 10y ago with the ask held roughly flat each time — persistent listings suggest the price (not the market) is what's stuck; bring a comps-based counter.
- Current owner paid $114k; list at $275k implies a 141% gain — meaningful room to come down on a strong offer.
Risks & watch-outs
- Climate carrying-cost: moderate wind risk, 21% chance of damaging wind over 30y; extreme-heat days projected 7→18/yr by 2055 (HVAC capex compounding) — expect insurance premiums to compound above CPI over the hold.
Questions for the listing agent
- Is there a deadline driving the sale (1031 exchange, divorce, estate, relocation)? That informs how much negotiation room exists.
- The area grade is low — what's the realistic commute time and amenity access for the typical tenant pool here? Any planned neighborhood developments (good or bad) we should know about?
- What's the average days-on-market for RENTAL listings here right now (not sales)? A rising rental-DOM trend means longer vacancies and softer asking-rent achievability than the comps imply.
- What's the recent tenant-quality profile in this submarket — average credit score on applications, eviction rate, late-payment / NSF rate, and stable-employment percentage? A property-management company in the area should have these aggregated.
- How much new for-sale + rental construction is in the pipeline within 1–3 miles? Heavy new supply typically softens prices + rents 12–24 months out; constrained supply supports both.
Investment metrics
- 1% rule
- 0.80% ✗
- Cap rate
- 6.63%
- Cash-on-cash
- 1.20%
- DSCR
- 1.05
- GRM
- 10.4
CMA / ARV
- ARV (on-the-fly)
- $268,736
- Comps found
- 12
Show comp detail 12 sales within ~0.75 mi
| Address | Dist | Beds/Ba | Sqft | Sold | Price | $/sf | Match |
|---|---|---|---|---|---|---|---|
| 609 Danieley Way | 0.06mi | 3/2.0 (-1) | 1,251 (-3%) | 2mo | $268,000 | $214 | 85 |
| 805 Jennings Berry Dr | 0.07mi | 3/2.0 (-1) | 1,176 (-9%) | 2mo | $228,900 | $195 | 75 |
| 413 James Toney Dr | 0.17mi | 3/2.0 (-1) | 1,204 (-7%) | 9mo | $250,000 | $208 | 68 |
| 409 James Toney Dr | 0.16mi | 3/2.0 (-1) | 1,208 (-6%) | 10mo | $238,000 | $197 | 68 |
| 407 James Toney Dr | 0.16mi | 3/2.0 (-1) | 1,366 (+6%) | 21mo | $256,000 | $187 | 61 |
| 817 Park Dr | 0.59mi | 3/1.0 (-1) | 1,320 (+2%) | 0mo | $220,000 | $167 | 60 |
| 302 Slate Dr | 0.56mi | 3/2.0 (-1) | 1,262 (-2%) | 11mo | $285,000 | $226 | 56 |
| 305 Slate Dr | 0.55mi | 3/2.0 (-1) | 1,255 (-3%) | 11mo | $280,000 | $223 | 55 |
| 326 Slate Dr | 0.51mi | 3/2.0 (-1) | 1,234 (-4%) | 11mo | $259,000 | $210 | 55 |
| 105 Graphite Dr | 0.56mi | 3/2.0 (-1) | 1,339 (+4%) | 15mo | $284,500 | $212 | 50 |
| 104 Claystone Dr | 0.63mi | 3/2.0 (-1) | 1,432 (+11%) | 2mo | $280,000 | $196 | 46 |
| 207 Sullivan Ct | 0.48mi | 3/2.5 (-1) | 1,410 (+9%) | 21mo | $236,000 | $167 | 38 |
Match score weights: distance 35% · size 25% · config 20% · recency 20%. Top-matched comps best support the ARV.
Projected returns pro-forma
-3.0% appreciation · 3.0% rent growth · sell at horizon
- IRR
- -14.4%
- Equity multiple
- 0.48×
- Total profit
- $-39,771
- Equity at exit
- $41,003
- IRR
- -5.8%
- Equity multiple
- 0.63×
- Total profit
- $-28,781
- Equity at exit
- $23,777
Cash invested: $77,000 (down + closing). Projections, not guarantees.
Landlord ↔ Tenant lean methodology
- Overall (STATE)
- 85 Strongly Landlord-Friendly
- State North Carolina
- 85 Strongly Landlord-Friendly · R+3
- County
- — inherits STATE
- City
- — inherits STATE
ZIP-level market 27244
- Home prices YoY
- -21.0%
- Active inventory
- 108
- Price-to-rent
- 10.4×
Monthly cashflow live
- Estimated rent
- $2,199 high interval (Pro) →
- Mortgage (P&I)
- −$1,442
- Tax from tax record
- −$104 /mo · $1,245/yr
- Insurance
- −$115
- HOA
- −$0
- Vacancy / Maint / Mgmt
- −$462
- Net cashflow
- $77
Break-even live
Sensitivity live
| Price | -10% $233 | -5% $155 | +0% $77 | +5% $-1 | +10% $-79 |
|---|---|---|---|---|---|
| Rent | -10% $-97 | -5% $-10 | +0% $77 | +5% $164 | +10% $251 |
| Rate | -1.0pp $215 | -0.5pp $147 | base $77 | +0.5pp $6 | +1.0pp $-67 |
UW: 25.0% down · 7.5% · 30yr · 1.5% tax · 5.0% vac · 8.0% maint · 8.0% mgmt
Financing live
Cash to close
- Down payment
- $68,750
- Closing costs
- $8,250
- Reserves months
- —
- Total cash needed
- —
Loan-product check · same deal, 3 products live
Conventional
25% down · 7.5% · 30yr
- Down + closing
- —
- Monthly P&I
- —
- Monthly cashflow
- —
- DSCR
- —
- Eligible?
- —
Personal DTI + credit; lowest rate.
DSCR
20% down · 8.5% · 30yr
- Down + closing
- —
- Monthly P&I
- —
- Monthly cashflow
- —
- DSCR
- —
- Eligible?
- —
No personal income docs; deal must DSCR.
Hard money
10% down · 12.0% · 12mo
- Down + closing
- —
- Monthly P&I
- —
- Monthly cashflow
- —
- DSCR
- —
- Eligible?
- —
Short-term bridge; refi at stabilization.
Rent comps 6 comps
| Address | Beds | Baths | Sqft | Rent | $/sqft | DOM | Units | Dist |
|---|---|---|---|---|---|---|---|---|
| 231 Graphite Dr Gibsonville, NC | 3.0 | 2.5 | 1465 | $2,095 | $1.43 | 15d | 1 | 0.63mi |
| 206 N Wyrick St Gibsonville, NC | 3.0 | 1.5 | 1040 | $1,610 | $1.55 | 23d | 1 | 0.74mi |
| 515 Burlington Ave Gibsonville, NC | 3.0 | 1.0 | 962 | $1,450 | $1.51 | 23d | 1 | 0.86mi |
| 694 Huntingdon St Elon, NC | 3.0 | 2.0 | 1392 | $1,750 | $1.26 | 23d | 1 | 0.91mi |
| 133 Westover Dr Elon, NC | 4.0 | 3.0 | 1378 | $2,500 | $1.81 | 23d | 1 | 1.43mi |
| 122 Westview Dr Elon, NC | 3.0 | 1.5 | 1500 | $3,570 | $2.38 | 23d | 1 | 1.43mi |
Listing history 17 events
-
2026-06-22days on market $275,000 Active 22 DOM
-
2026-06-19days on market $275,000 Active 20 DOM
-
2026-06-18days on market $275,000 Active 19 DOM
-
2026-06-17days on market $275,000 Active 18 DOM
-
2026-06-16days on market $275,000 Active 17 DOM
-
2026-06-15days on market $275,000 Active 16 DOM
-
2026-06-14days on market $275,000 Active 14 DOM
-
2026-06-13days on market $275,000 Active 13 DOM
-
2026-06-10days on market $275,000 Active 11 DOM
-
2026-06-09days on market $275,000 Active 10 DOM
-
2026-06-08days on market $275,000 Active 9 DOM
-
2026-06-07days on market $275,000 Active 8 DOM
-
2026-06-05days on market $275,000 Active 5 DOM
-
2026-06-02days on market $275,000 Active 3 DOM
-
2026-06-01days on market $275,000 Active 2 DOM
-
2026-05-31remarks 309-char remark
-
2026-05-31$275,000 Active 1 DOM
ⓘ Source: listings_history table (triggers on properties + properties_extension) + one-shot
backfill from property_details.listing_events for pre-trigger history.
Tax reassessment forecast NC · Resets to sale price
- Current annual tax
- $1,245 · $104/mo
- Projected year-2 tax
- $2,255 · $188/mo
- Expected delta
- +$1,010/yr (+$84/mo · 81.1%)
ⓘ Screening estimate from a state-policy table — verify with the county assessor before closing.
Climate risk First Street
- Flood 1/10 Low FEMA zone X (unshaded) · 0% chance over 30 yrs
- Wildfire 1/10 Low
- Heat 6/10 Major 7 d/yr ≥104°F today · 18 d/yr by 30 yrs out
- Wind 5/10 Major 21% chance of damaging wind over 30 yrs
- Air quality 2/10 Low 2 unhealthy d/yr today · 2 by 30 yrs out
Nearby sold comps map
Loading sold comps map…
Walkable amenities ~0.75 mi
Loading nearby amenities…
Taxation est. · year 1
- Rental income
- $26,393
- − Mortgage interest
- −$15,404
- − Property taxes
- −$1,245
- − Insurance
- −$1,375
- − Repairs & maintenance
- −$2,111
- − Management
- −$2,111
- − Depreciation
- −$8,000
- Taxable loss
- −$3,855
- Est. tax savings @ 24.0%
- +$925
- After-tax cash flow
- $1,849/yr
For passive investors: Depreciation is non-cash, so a rental often shows a tax loss while cash-flowing — sheltering income. Rental losses are passive: they offset passive income freely, and up to $25,000/yr can offset ordinary (W-2) income if you actively participate and your MAGI is under $100k (phasing out to $0 by $150k); unused losses carry forward. On sale, claimed depreciation is recaptured at up to 25%, and gains may owe capital-gains tax (a 1031 exchange can defer both). Figures are a year-1 estimate at your 24.0% rate — not tax advice; consult a CPA.
Schools (NCES district)
- District
- Alamance-Burlington Schools
- NCES district ID
- 3700030
- Math proficiency
- 30% ▼ -6.00%
- Reading proficiency
- 40% ▲ 2.00%
- Median HH income
- $43,359
- Composite
- 29.68/100
- National rank
- #6460
- State rank
- #133 of 178 in NC
Livability — Elon
- Score
- 81/100
- State rank
- #17
- US rank
- #1573
Category grades
Schools grade is shown separately in the Schools card above.
Census & demographics
- Census place
- Elon, NC
- County
- Alamance County · 173,369 people
- City population
- 16,329
- Metro
- Burlington, NC
- Population (ZIP)
- 16,329
- Household income
- $75,323
- Rent vs Own
- Severe rent burden
- 270.0
Population outlook (Alamance County) Hauer SSP2
- Today (2025)
- 173,381 people
- By 2030
- 180,609 · +4.2%
- By 2040
- 194,327 · +12.1%
- By 2050
- 206,158 · +18.9%
- By 2075
- 235,665 · +35.9%
- By 2100
- 258,626 · +49.2%
Race, ethnicity, and origin ACS 2023
- Neighborhood character
- Predominantly White (81%)
- Race & ethnicity
- White 81% Black 11% Two or more races 4% Hispanic / Latino 3% Asian 2%
- Common ancestry
- Serbian 4% Romanian 3% Slovak 3%
- Foreign-born
- 3%
- Languages at home
- 95% English-only · Spanish 2% Other Indo-European 2% Other Asian/Pacific 1%
Political lean MEDSL · Alamance
- 2024 margin
- Lean R (+8.2) · D 45.4% · R 53.5% · Other 1.1%
- 2008→2024 swing
- +1.1pp toward D · 2008: -9.2pp · 2024: -8.2pp
- All cycles
- 2024: R+8.2 2020: R+8.4 2016: R+12.9 2012: R+14.1 2008: R+9.2
Not yet ingested
- Civics
- —
Market trends
- HPI YoY
- ▼ -58.54%
- Current HPI
- 219.7859
- Rent YoY
- —
- Metro
- Burlington, NC
- State GDP YoY
- ▲ 3.28%
- F500 in state
- 26
Industry mix (Fortune 500 HQ in NC)
| Industry | F500 HQs | Revenue |
|---|---|---|
| Financial Services | 2 | $213B |
|
||
| Retail | 2 | $95B |
|
||
| Industrial Conglomerate | 1 | $38B |
|
||
| Metals / Steel | 1 | $35B |
|
||
| Utilities | 1 | $30B |
|
||
| Industrial Machinery | 1 | $19B |
|
||
Price history
+131.1% since first listed8 events — show timeline
- 2026-05-31 Listed $275,000 FSBO.com
- 2016-04-13 Sold (Public Records) $119,000 Public Records
- 2016-04-13 Sold (MLS) $114,000 TMLS
- 2016-04-13 Sold (MLS) $114,000 AMLSNC
- 2016-04-13 Sold (MLS) $114,000 Triad MLS
- 2016-02-26 Listed $119,000 TMLS
- 2016-02-26 Listed $119,000 AMLSNC
- 2016-02-26 Listed $119,000 Triad MLS
Property tax history
+5.8%/yrLatest (2025): $1,245 · -39.7% YoY. Source: county tax records.
Cash-flow waterfall
monthlySold comps — $/sqft
last 12 mo · ≤1 miLoading sold comps…