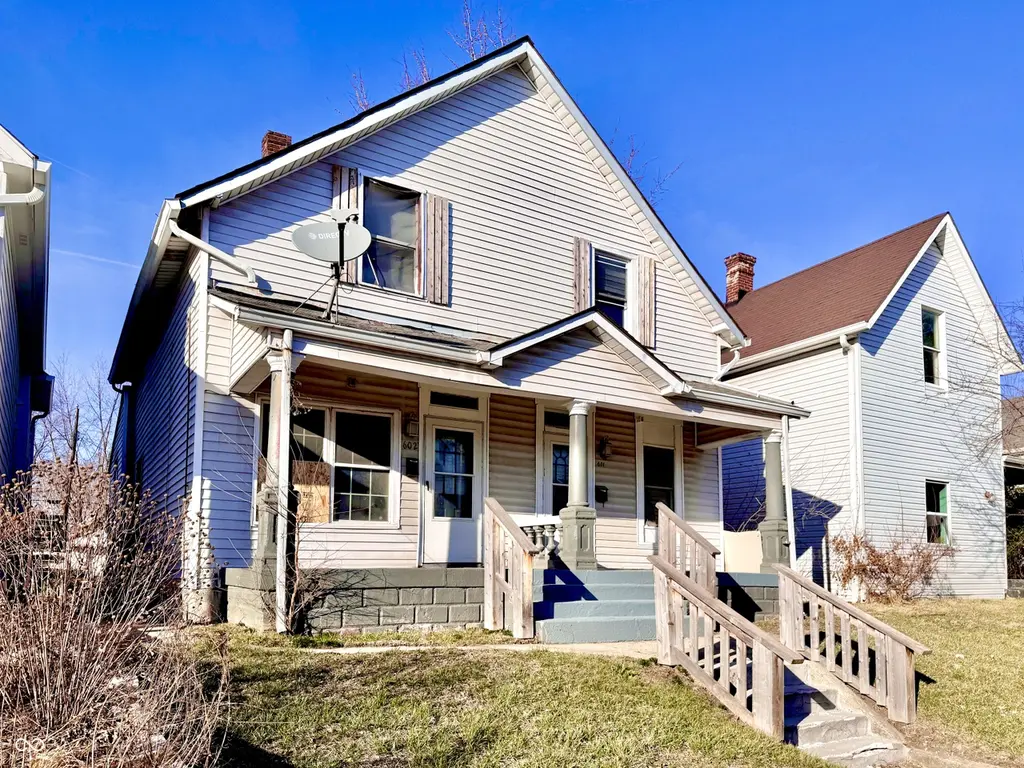
602 Lincoln St · Indianapolis city (balance), IN
Flood risk No data
- FEMA flood zone
- —
- Chance of flooding over 30 yrs
- —
- Est. flood insurance / yr
- —
Fire risk No data
- Est. fire insurance / yr
- —
Heat risk No data
- Hot days now (above threshold)
- —
- Hot days in 30 yrs
- —
Wind risk No data
- Chance of severe wind over 30 yrs
- —
Air-quality risk No data
- Unhealthy air days now
- —
- Unhealthy air days in 30 yrs
- —
Risk factors via First Street. Map © Google.
Why this score? — see what drove the B- grade
The composite is a weighted blend of 9 inputs, each scored 0–100. Each bar is that input's sub-score; the figure is the points it added to the 100-point composite (weight × sub-score).
- Cash flow +30.0/30.0
- 1% rule +10.0/10.0
- DSCR +10.0/10.0
- ARV discount +7.5/15.0
- Rent growth +3.2/5.0
- Livability +2.5/5.0
- Condition / age +2.5/5.0
- Schools +1.4/10.0
- Appreciation +0.0/10.0
$79,950
🖨 Deal sheet (PDF) 📄 Offer letter ✓ Due diligence
Listing remarks
This distinctive condominium presents an excellent investment opportunity for individuals seeking to personalize a space or for those handy homeowners ready to embark on a rewarding project. An inviting porch with a separate entry welcomes you inside, encompassing a great room, separate dining room, kitchen, two comfortable bedrooms, and supplemental storage/workshop area. The exterior features a partially fenced yard and separate rear entries. Don't miss out on this remarkable Bates-Hendricks opportunity to shape a living space filled with potential and promise.
Key facts
- Separate dining room
- Great room
- Supplemental storage
Tags
Property features AI
Finance
- HOA & community: 2+ common walls (no one above or below); No community amenities listed; Not low-maintenance lifestyle
Exterior
- Parking: On-street parking
- Utilities: Public water; Municipal sewer connected; Electricity connected; Natural gas available; Solid waste service available
- Home design: Residential condominium; Attached unit (vertical, ground-level location available); Two-level layout; South-facing; Fixer condition; Has a view
- Construction: Vinyl siding; Block and brick/mortar foundation
- Exterior features: Covered patio; Patio; Partial fencing; Mature trees; City lot with curbs, sidewalks and street lights; Access to street
Interior
- Kitchen: Electric oven; Refrigerator
- Bedrooms: 2 upper-level bedrooms
- Bathrooms: 1 full bath on main level
- Heating & cooling: Forced-air heating; No central cooling
- Interior features: Eat-in kitchen; Smart thermostat; Supplemental storage; Utility room
- Laundry & utility: Main-level laundry; Water heater
Neighborhood map
What this means for you Summary
Snapshot
- This is a 2-bed/1.0-bath condo listed at $80k.
Deal economics
- At list price, monthly cash flow is $477 ($6k/yr) — positive.
- The deal already cash-flows at list — no discount required.
- Meets the 1% rule at list price ($1k rent vs $80k).
- Recommended offer: $78k (3.0% below list) — sets the bar for market timing.
- Cap rate 13.5% vs local median 4.4% in Indianapolis city (balance) — top-decile yield for the area; either an underpriced asset or a hidden risk that comps aren't pricing in. Stress-test before assuming the spread holds.
Location & tenants
- Location reads: area grade B — affects rentability + tenant quality, not the cash-flow math above.
- Indianapolis Public Schools (urban): math 14% / reading 20% proficiency, ranked #286 of 301 in IN (top 95%) — low school quality limits family demand, transient renter base, plan for 1-2y turnover; 77% free/reduced lunch — lower-income household profile, screen leases tightly.
- Zoned schools: Arsenal Technical High School (math 6% / reading 27%, grade F, #353 of 369 statewide, top 96%, 2,366 students, 74% FRL) — zoned schools at 74% FRL track the district average.
- Market conditions: Rents rising (+2.9%/yr); 499 active listings in the ZIP; 40 comparable units currently listed for rent nearby; rentals lingering (median 45d on market — plan ~5-8 weeks vacancy on turnover, expect pricing pressure); 52% of comp listings sitting > 30 days — soft ceiling on asking rent; 1,906 units permitted in Marion County in 2024 (621 in 5+ unit buildings).
Forward outlook
- Local home prices are declining (-3.0%/yr); year-one equity from $552 of loan paydown is wiped out by about $2k of value loss. Plan a longer hold.
- Marion County population projected at +18% by 2050 — long-run rental-demand tailwind backs the buy-and-hold thesis.
- At projected returns (-3.0% appreciation + 2.9% rent growth), your $22k cash investment doubles in ~5 years — after that, you're playing with house money.
Negotiation context
- It's been on market 34 days — a 3% lower offer ($78k) is reasonable based on typical stale-listing flexibility.
- 11 sale attempts since 24y ago with the ask held roughly flat each time — persistent listings suggest the price (not the market) is what's stuck; bring a comps-based counter.
- Current owner paid $40k; list at $80k implies a 100% gain — meaningful room to come down on a strong offer.
Risks & watch-outs
- Watch-outs: built in 1880 — expect roof / HVAC / electrical / plumbing capex.
Questions for the listing agent
- It's been on market 34 days. Have you received any prior offers? Is the seller open to a 3% concession, seller financing, or rate buy-down credit?
- Built in 1880 — when were the roof, HVAC, electrical panel, plumbing, and water heater last replaced?
- Any open or pending special assessments — roof, HVAC, plumbing, elevator, façade? What's the per-unit balance and payoff schedule, and is the seller paying it off at close or rolling it to the buyer?
- Is there a deadline driving the sale (1031 exchange, divorce, estate, relocation)? That informs how much negotiation room exists.
- What's the average days-on-market for RENTAL listings here right now (not sales)? A rising rental-DOM trend means longer vacancies and softer asking-rent achievability than the comps imply.
- What's the recent tenant-quality profile in this submarket — average credit score on applications, eviction rate, late-payment / NSF rate, and stable-employment percentage? A property-management company in the area should have these aggregated.
- How much new apartment / multifamily construction is in the pipeline within 1–3 miles? Heavy new supply (>2% of stock underway) typically softens rents 12–24 months out; light construction supports rent growth.
Investment metrics
- 1% rule
- 1.63% ✓
- Cap rate
- 13.45%
- Cash-on-cash
- 25.57%
- DSCR
- 2.14
- GRM
- 5.1
CMA / ARV
No comps found within radius.
Projected returns pro-forma
-3.0% appreciation · 2.88% rent growth · sell at horizon
- IRR
- 19.1%
- Equity multiple
- 1.77×
- Total profit
- $17,292
- Equity at exit
- $11,921
- IRR
- 27.3%
- Equity multiple
- 3.40×
- Total profit
- $53,619
- Equity at exit
- $6,913
Cash invested: $22,386 (down + closing). Projections, not guarantees.
Landlord ↔ Tenant lean methodology
- Overall (STATE)
- 90 Strongly Landlord-Friendly
- State Indiana
- 90 Strongly Landlord-Friendly · R+11
- County
- — inherits STATE
- City
- — inherits STATE
ZIP-level market 46203
- Home prices YoY
- -26.7%
- Rents YoY
- 2.9%
- Active inventory
- 499
- Price-to-rent
- 5.1×
Monthly cashflow live
- Estimated rent
- $1,303 high interval (Pro) →
- Mortgage (P&I)
- −$419
- Tax est. 1.5%
- −$100 /mo · $1,199/yr
- Insurance
- −$33
- HOA
- −$0
- Vacancy / Maint / Mgmt
- −$274
- Net cashflow
- $477
Break-even live
Sensitivity live
| Price | -10% $532 | -5% $505 | +0% $477 | +5% $449 | +10% $422 |
|---|---|---|---|---|---|
| Rent | -10% $374 | -5% $426 | +0% $477 | +5% $529 | +10% $580 |
| Rate | -1.0pp $517 | -0.5pp $497 | base $477 | +0.5pp $456 | +1.0pp $435 |
UW: 25.0% down · 7.5% · 30yr · 1.5% tax · 5.0% vac · 8.0% maint · 8.0% mgmt
Financing live
Cash to close
- Down payment
- $19,988
- Closing costs
- $2,398
- Reserves months
- —
- Total cash needed
- —
Loan-product check · same deal, 3 products live
Conventional
25% down · 7.5% · 30yr
- Down + closing
- —
- Monthly P&I
- —
- Monthly cashflow
- —
- DSCR
- —
- Eligible?
- —
Personal DTI + credit; lowest rate.
DSCR
20% down · 8.5% · 30yr
- Down + closing
- —
- Monthly P&I
- —
- Monthly cashflow
- —
- DSCR
- —
- Eligible?
- —
No personal income docs; deal must DSCR.
Hard money
10% down · 12.0% · 12mo
- Down + closing
- —
- Monthly P&I
- —
- Monthly cashflow
- —
- DSCR
- —
- Eligible?
- —
Short-term bridge; refi at stabilization.
Rent comps 40 comps
| Address | Beds | Baths | Sqft | Rent | $/sqft | DOM | Units | Dist |
|---|---|---|---|---|---|---|---|---|
| 512 E Minnesota St Unit 203 Indianapolis, IN | 2.0 | 1.0 | 903 | $1,195 | $1.32 | 24d | 1 | 0.09mi |
| 1437 S East St Indianapolis, IN | 2.0 | 2.0 | 1114 | $1,425 | $1.28 | 44d | 1 | 0.10mi |
| 1439 South East St Indianapolis, IN | 2.0 | 2.0 | 1114 | $1,425 | $1.28 | 21d | 1 | 0.10mi |
| 1436 S New Jersey St Unit C Indianapolis, IN | 2.0 | 2.0 | 600 | $1,600 | $2.67 | 44d | 1 | 0.17mi |
| 1436 S New Jersey St Unit B Indianapolis, IN | 2.0 | 2.0 | 650 | $1,700 | $2.62 | 8d | 1 | 0.17mi |
| 823 Iowa St Indianapolis, IN | 2.0 | 1.0 | 812 | $1,100 | $1.35 | 44d | 1 | 0.23mi |
| 1409 S Alabama St Indianapolis, IN | 2.0 | 1.0 | 949 | $1,245 | $1.31 | 44d | 1 | 0.25mi |
| 1407 S Alabama St Indianapolis, IN | 2.0 | 1.0 | 949 | $1,150 | $1.21 | 44d | 1 | 0.25mi |
| 1861 Orleans St Indianapolis, IN | 1.0 | 1.0 | 552 | $2,500 | $4.53 | 24d | 1 | 0.27mi |
| 944 E Minnesota St Indianapolis, IN | 2.0 | 2.0 | 944 | $1,299 | $1.38 | 44d | 1 | 0.27mi |
| 620 E Beecher St Indianapolis, IN | 3.0 | 2.0 | 1072 | $1,639 | $1.53 | 20d | 1 | 0.29mi |
| 1514 Ringgold Ave Indianapolis, IN | 3.0 | 1.0 | 1064 | $1,295 | $1.22 | 44d | 1 | 0.30mi |
| 436 Sanders St Indianapolis, IN | 1.0 | 1.0 | 800 | $800 | $1.00 | 8d | 1 | 0.35mi |
| 1024 Orange St Indianapolis, IN | 2.0 | 2.0 | 1007 | $1,650 | $1.64 | 44d | 1 | 0.42mi |
| 1026 Orange St Indianapolis, IN | 2.0 | 2.0 | 1007 | $1,600 | $1.59 | 17d | 1 | 0.42mi |
| 355 E Morris St Indianapolis, IN | 2.0 | 1.0 | 648 | $1,800 | $2.78 | 24d | 1 | 0.43mi |
| 118 E Palmer St Indianapolis, IN | 1.0 | 1.0 | 600 | $649 | $1.08 | 44d | 1 | 0.43mi |
| 118 E Palmer St #122 Indianapolis, IN | 1.0 | 1.0 | 600 | $875 | $1.46 | 44d | 1 | 0.43mi |
| 118 E Palmer St #120 Indianapolis, IN | 1.0 | 1.0 | 600 | $825 | $1.38 | 18d | 1 | 0.43mi |
| 1756 S Delaware St Unit 1754 Indianapolis, IN | 3.0 | 2.0 | 1014 | $1,300 | $1.28 | 15d | 1 | 0.44mi |
| 1756 Delaware St Indianapolis, IN | 3.0 | 2.0 | 1014 | $1,300 | $1.28 | 44d | 1 | 0.44mi |
| 1524 S Talbott St #3 Indianapolis, IN | 1.0 | 1.0 | 1011 | $725 | $0.72 | 8d | 1 | 0.45mi |
| 907 Prospect St Unit 907 Prospect NO AMI Indianapolis, IN | 3.0 | 1.5 | 1121 | $1,400 | $1.25 | 24d | 1 | 0.49mi |
| 1318 Shelby St Unit B 120% AMI Indianapolis, IN | 1.0 | 1.0 | 1116 | $1,350 | $1.21 | 24d | 1 | 0.50mi |
| 336 Prospect St Indianapolis, IN | 1.0 | 1.0 | 450 | $772 | $1.72 | 13d | 2 | 0.52mi |
| 114 Adler St Indianapolis, IN | 2.0 | 1.0 | 688 | $795 | $1.16 | 44d | 1 | 0.54mi |
| 1819 Union St Unit 1817 Indianapolis, IN | 3.0 | 2.0 | 1020 | $1,199 | $1.18 | 44d | 1 | 0.55mi |
| 2103 Ringgold Ave Indianapolis, IN | 1.0 | 1.0 | 1090 | $775 | $0.71 | 14d | 1 | 0.56mi |
| 1012 Prospect St Unit B 120% AMI Indianapolis, IN | 1.0 | 1.0 | 1116 | $1,350 | $1.21 | 44d | 1 | 0.57mi |
| 1012 Prospect St Unit 907 Prospect NO AMI Indianapolis, IN | 3.0 | 1.5 | 1121 | $1,400 | $1.25 | 44d | 1 | 0.57mi |
| 714 Buchanan St Indianapolis, IN | 2.0 | 2.0 | 1100 | $1,995 | $1.81 | 15d | 1 | 0.57mi |
| 1461 S Meridian St Unit A Indianapolis, IN | 1.0 | 1.0 | 800 | $950 | $1.19 | 44d | 1 | 0.59mi |
| 1044 Shelby St Unit 205 CDBG 80% Indianapolis, IN | 1.0 | 1.0 | 579 | $650 | $1.12 | 18d | 1 | 0.63mi |
| 2209 Ransdell St Indianapolis, IN | 2.0 | 1.0 | 710 | $900 | $1.27 | 44d | 1 | 0.66mi |
| 1011 E Raymond St Indianapolis, IN | 2.0 | 2.0 | 1100 | $1,350 | $1.23 | 24d | 1 | 0.69mi |
| 2236 Ransdell St Indianapolis, IN | 2.0 | 1.0 | 850 | $1,150 | $1.35 | 44d | 1 | 0.73mi |
| 1224 Prospect St Indianapolis, IN | 2.0 | 1.0–2.0 | 691 | $2,235 | $3.23 | 2d | 8 | 0.73mi |
| 1122 S Meridian St Unit B MERIDIAN Indianapolis, IN | 2.0 | 1.5 | 840 | $1,100 | $1.31 | 44d | 1 | 0.75mi |
| 1337 Prospect St Unit 3 Indianapolis, IN | 1.0 | 2.0 | 1100 | $1,450 | $1.32 | 44d | 1 | 0.79mi |
| 1306 Woodlawn Ave Unit 1B Indianapolis, IN | 1.0 | 1.0 | 720 | $1,275 | $1.77 | 44d | 1 | 0.82mi |
HOA detail condo
- Monthly dues
- $0 · $0/yr
- Assessments
- None detected in remarks — confirm with the listing agent.
Listing history 30 events
-
2026-04-16status Pending
-
2026-03-12price $79,950
-
2026-03-12$79,900 Active
-
2025-11-04historical
-
2025-10-21price $129,900
-
2025-09-29price $130,000
-
2025-08-06$149,900 Active
-
2022-08-15historical
-
2022-08-08status Active
-
2022-08-05status Pending
-
2022-07-28$210,000 Active
-
2022-01-25price $875
-
2016-10-27soldstatus $40,000 Sold
-
2016-09-26historical Active with Contingency
-
2016-09-21price $50,000
-
2016-09-21status Active
-
2016-09-12status Pending
-
2016-09-03price $70,000
-
2016-08-08price $85,500
-
2016-07-20$95,500 Active
-
2013-01-24historical
-
2012-06-26$9,128
-
2011-02-15historical
-
2010-08-21historical
-
2010-08-16$14,900
-
2010-02-23$30,000
-
2005-02-12$69,000
-
2005-02-09soldstatus $69,000
-
2002-10-18soldstatus $46,900
-
2002-08-31$54,900
ⓘ Source: listings_history table (triggers on properties + properties_extension) + one-shot
backfill from property_details.listing_events for pre-trigger history.
Nearby sold comps map
Loading sold comps map…
Walkable amenities ~0.75 mi
Loading nearby amenities…
Taxation est. · year 1
- Rental income
- $15,639
- − Mortgage interest
- −$4,478
- − Property taxes
- −$1,199
- − Insurance
- −$400
- − Repairs & maintenance
- −$1,251
- − Management
- −$1,251
- − Depreciation
- −$2,326
- Taxable income
- $4,734
- Est. tax owed @ 24.0%
- −$1,136
- After-tax cash flow
- $4,589/yr
For passive investors: Depreciation is non-cash, so a rental often shows a tax loss while cash-flowing — sheltering income. Rental losses are passive: they offset passive income freely, and up to $25,000/yr can offset ordinary (W-2) income if you actively participate and your MAGI is under $100k (phasing out to $0 by $150k); unused losses carry forward. On sale, claimed depreciation is recaptured at up to 25%, and gains may owe capital-gains tax (a 1031 exchange can defer both). Figures are a year-1 estimate at your 24.0% rate — not tax advice; consult a CPA.
Schools (NCES district)
- District
- Indianapolis Public Schools
- NCES district ID
- 1804770
- Math proficiency
- 14% ▼ -7.00%
- Reading proficiency
- 20% ▼ -3.00%
- Median HH income
- $32,034
- Composite
- 13.69/100
- National rank
- #9499
- State rank
- #286 of 301 in IN
Livability — Indianapolis city (balance)
No livability data for this city. (Only ~50 U.S. cities are tracked.)
Census & demographics
- Census place
- Indianapolis city (balance), IN
- County
- Marion County · 998,460 people
- City population
- 881,119
- Metro
- Indianapolis-Carmel-Anderson, IN
- Population (ZIP)
- 37,758
- Household income
- $57,393
- Rent vs Own
- Severe rent burden
- 1499.0
Population outlook (Marion County) Hauer SSP2
- Today (2025)
- 1,025,572 people
- By 2030
- 1,065,727 · +3.9%
- By 2040
- 1,141,577 · +11.3%
- By 2050
- 1,208,920 · +17.9%
- By 2075
- 1,367,288 · +33.3%
- By 2100
- 1,438,201 · +40.2%
Race, ethnicity, and origin ACS 2023
- Neighborhood character
- Predominantly White (69%)
- Race & ethnicity
- White 69% Hispanic / Latino 14% Black 12% Two or more races 8% Asian 2% Native American 1%
- Hispanic origin (detail)
- Mexican 12% Puerto Rican 1%
- Common ancestry
- Slovak 2% Lithuanian 2% Italian 1%
- Foreign-born
- 8% · Canada
- Languages at home
- 88% English-only · Spanish 10% Other Indo-European 1%
Political lean MEDSL · Marion
- 2024 margin
- Strong D (+27.7) · D 63.0% · R 35.3% · Other 1.7%
- 2008→2024 swing
- -0.7pp no change · 2008: 28.4pp · 2024: 27.7pp
- All cycles
- 2024: D+27.7 2020: D+29.1 2016: D+22.8 2012: D+22.2 2008: D+28.4
Not yet ingested
- Civics
- —
Market trends
- HPI YoY
- ▼ -127.37%
- Current HPI
- 349.579
- Rent YoY
- ▲ 2.88%
- Metro
- Indianapolis-Carmel-Anderson, IN
- State GDP YoY
- ▲ 2.90%
- F500 in state
- 18
Industry mix (Fortune 500 HQ in IN)
| Industry | F500 HQs | Revenue |
|---|---|---|
| Industrial Machinery | 2 | $37B |
|
||
| Healthcare | 1 | $177B |
|
||
| Pharmaceuticals | 1 | $45B |
|
||
| Metals / Steel | 1 | $18B |
|
||
| Agriculture | 1 | $17B |
|
||
| Packaging | 1 | $12B |
|
||
Price history
+45.6% since first listed30 events — show timeline
- 2026-04-16 Pending — MIBOR as Distributed by MLS Grid
- 2026-03-12 Price Changed $79,950 MIBOR as Distributed by MLS Grid
- 2026-03-12 Listed $79,900 MIBOR as Distributed by MLS Grid
- 2025-11-04 Listing Removed — MIBOR as Distributed by MLS Grid
- 2025-10-21 Price Changed $129,900 MIBOR as Distributed by MLS Grid
- 2025-09-29 Price Changed $130,000 MIBOR as Distributed by MLS Grid
- 2025-08-06 Listed $149,900 MIBOR as Distributed by MLS Grid
- 2022-08-15 Listing Removed — MIBOR as Distributed by MLS Grid
- 2022-08-08 Relisted — MIBOR as Distributed by MLS Grid
- 2022-08-05 Pending — MIBOR as Distributed by MLS Grid
- 2022-07-28 Listed $210,000 MIBOR as Distributed by MLS Grid
- 2022-01-25 Price Changed $875 RENT.
- 2016-10-27 Sold (MLS) $40,000 MIBOR as Distributed by MLS Grid
- 2016-09-26 Contingent — MIBOR as Distributed by MLS Grid
- 2016-09-21 Price Changed $50,000 MIBOR as Distributed by MLS Grid
- 2016-09-21 Relisted — MIBOR as Distributed by MLS Grid
- 2016-09-12 Pending — MIBOR as Distributed by MLS Grid
- 2016-09-03 Price Changed $70,000 MIBOR as Distributed by MLS Grid
- 2016-08-08 Price Changed $85,500 MIBOR as Distributed by MLS Grid
- 2016-07-20 Listed $95,500 MIBOR as Distributed by MLS Grid
- 2013-01-24 Listing Removed — MARMLS
- 2012-06-26 Listed $9,128 MARMLS
- 2011-02-15 Listing Removed — MIBOR as Distributed by MLS Grid
- 2010-08-21 Listing Removed — MIBOR as Distributed by MLS Grid
- 2010-08-16 Listed $14,900 MIBOR as Distributed by MLS Grid
- 2010-02-23 Listed $30,000 MIBOR as Distributed by MLS Grid
- 2005-02-12 Listed $69,000 MIBOR as Distributed by MLS Grid
- 2005-02-09 Sold (MLS) $69,000 MIBOR as Distributed by MLS Grid
- 2002-10-18 Sold (MLS) $46,900 MIBOR as Distributed by MLS Grid
- 2002-08-31 Listed $54,900 MIBOR as Distributed by MLS Grid
Property tax history
+16.6%/yrLatest (2022): $4,060 · +14.9% YoY. Source: county tax records.
Cash-flow waterfall
monthlySold comps — $/sqft
last 12 mo · ≤1 miLoading sold comps…