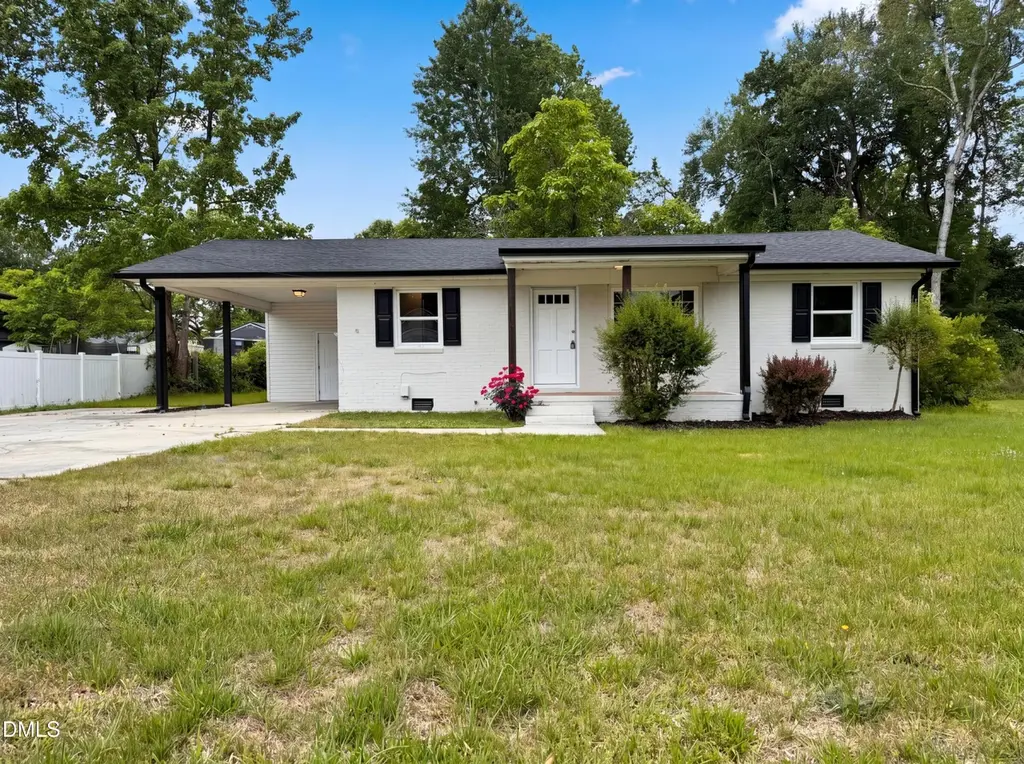
303 Stancil St · Smithfield, NC
Flood risk 4/10 · Minor
- FEMA flood zone
- X (unshaded)
- Chance of flooding over 30 yrs
- 0.22%
- Est. flood insurance / yr
- $507 – $1,088
Fire risk 3/10 · Minor
- Est. fire insurance / yr
- $906 – $1,684
Heat risk 7/10 · Major
- Hot days now (above 105°F)
- 7 days/yr
- Hot days in 30 yrs
- 17 days/yr
Wind risk 7/10 · Major
- Chance of severe wind over 30 yrs
- 78.0%
Air-quality risk 2/10 · Minimal
- Unhealthy air days now
- 1 days/yr
- Unhealthy air days in 30 yrs
- 1 days/yr
Risk factors via First Street. Map © Google.
Why this score? — see what drove the D- grade
The composite is a weighted blend of 9 inputs, each scored 0–100. Each bar is that input's sub-score; the figure is the points it added to the 100-point composite (weight × sub-score).
- Cash flow +12.5/30.0
- ARV discount +7.2/15.0
- DSCR +3.7/10.0
- Schools +3.5/10.0
- Livability +3.3/5.0
- 1% rule +3.0/10.0
- Condition / age +2.5/5.0
- Rent growth +2.2/5.0
- Appreciation +0.0/10.0
$220,000
🖨 Deal sheet (PDF) 📄 Offer letter ✓ Due diligence
Listing remarks MLS
Sold as is. Seller makes no repairs. Hud Case number 381-533353. Fha insurable with escrow ($1650.00). Hud it's agents and or assigns makes no representations as to the existence of mold, radon or lead based paint and is not liable for the potentially harmful effects thereof.
Key facts
- Cozy fireplace
- Modern kitchen
- Granite countertops
Tags
Property features AI
Finance
- Other: Located in Johnston County, NC
- HOA & community: No homeowners association
Exterior
- Parking: Carport plus open parking (total 2 spaces); One covered carport space and one open parking space
- Utilities: Public water; Public sewer
- Home design: Single-story home
- Construction: Brick and vinyl siding exterior; Composition/shingle roof; Other foundation
- Exterior features: Public-maintained road access; Lot of approximately 0.26 acres
Interior
- Bedrooms: Three bedrooms (all on the main level)
- Flooring: Vinyl flooring
- Bathrooms: One full bathroom
- Heating & cooling: Central heating; Central air conditioning
- Interior features: Vinyl flooring; One-level living
Neighborhood map
What this means for you Summary
Snapshot
- This is a 3-bed/1.0-bath single-family listed at $220k.
Deal economics
- At list price, monthly cash flow is $-31 ($-376/yr) — negative.
- To cash-flow at today's rent, offer at most $214k (2.5% below list).
- To meet the 1% rule (rent ≥ 1% of price), the offer needs to be $175k (20.4% below list).
- Recommended offer: $175k (20.4% below list) — sets the bar for 1% rule.
- Cap rate 6.1% vs local median 3.8% in Smithfield — top-decile yield for the area; either an underpriced asset or a hidden risk that comps aren't pricing in. Stress-test before assuming the spread holds.
Location & tenants
- Location reads 66/100 on livability (#259 in NC) — a middle-class / working-renter tenant base. Strengths: cost of living A+, health & safety A+, housing B+; Watch: crime F, amenities F, commute F.
- Johnston County Public Schools (rural): math 39% / reading 42% proficiency, ranked #105 of 178 in NC (top 59%) — families likely to look elsewhere, expect single-tenant / working-renter base with shorter leases.
- Zoned schools: Wilson'S Mills Elementary (math 22% / reading 23%, grade F, #1,175 of 1,410 statewide, top 84%, 503 students, 82% FRL); Smithfield Middle (math 20% / reading 32%, grade F, #385 of 475 statewide, top 81%, 501 students, 99% FRL); Smithfield-Selma High (math 25% / reading 37%, grade F, #454 of 535 statewide, top 85%, 1,503 students, 69% FRL) — zoned schools average 84% FRL vs 41% district-wide (43 pts higher); higher-poverty schools than district average — tighter screening recommended.
- Zoned-school proficiency averages 26% at this address vs 40% district-wide (-14 pts) — the specific schools serving this property underperform the Johnston County Public Schools average; the district grade overstates school quality for this exact location.
- Market conditions: Rents soft (-1.1%/yr); 407 active listings in the ZIP; 1 comparable units currently listed for rent nearby; 2,783 units permitted in Johnston County in 2024 (6 in 5+ unit buildings).
- This rent runs 33% of the median local income ($63k/yr) — at the standard rent-burdened threshold; future hikes will face affordability resistance.
Forward outlook
- Local home prices are declining (-3.0%/yr); year-one equity from $2k of loan paydown is wiped out by about $7k of value loss. Plan a longer hold.
- Johnston County population projected at +37% by 2050 — long-run rental-demand tailwind backs the buy-and-hold thesis.
Negotiation context
- Only 9 days on market — expect competitive offers; lowballing is unlikely to land.
- 5 sale attempts since 29y ago with the ask held roughly flat each time — persistent listings suggest the price (not the market) is what's stuck; bring a comps-based counter.
Risks & watch-outs
- Climate carrying-cost: major wind risk, 78% chance of damaging wind over 30y; extreme-heat days projected 7→17/yr by 2055 (HVAC capex compounding) — expect insurance premiums to compound above CPI over the hold.
Questions for the listing agent
- What do current leases actually rent for vs. the listed asking? Can we see a recent rent roll and the last 12 months of T-12 income?
- Built in 1963 — when were the roof, HVAC, electrical panel, plumbing, and water heater last replaced?
- Is there a deadline driving the sale (1031 exchange, divorce, estate, relocation)? That informs how much negotiation room exists.
- Schools are F-rated, which usually means shorter tenancies and higher turnover. Who's the typical renter profile here, and what's been the actual vacancy rate?
- Crime grade is F in this area — have there been break-ins, vandalism, or insurance claims at this property in the last 3 years? What carrier currently insures it and at what premium?
- The area grade is low — what's the realistic commute time and amenity access for the typical tenant pool here? Any planned neighborhood developments (good or bad) we should know about?
- What's the average days-on-market for RENTAL listings here right now (not sales)? A rising rental-DOM trend means longer vacancies and softer asking-rent achievability than the comps imply.
- What's the recent tenant-quality profile in this submarket — average credit score on applications, eviction rate, late-payment / NSF rate, and stable-employment percentage? A property-management company in the area should have these aggregated.
- How much new for-sale + rental construction is in the pipeline within 1–3 miles? Heavy new supply typically softens prices + rents 12–24 months out; constrained supply supports both.
Investment metrics
- 1% rule
- 0.80% ✗
- Cap rate
- 6.12%
- Cash-on-cash
- -0.61%
- DSCR
- 0.97
- GRM
- 10.5
CMA / ARV
- ARV (on-the-fly)
- $218,348
- Comps found
- 11
Show comp detail 11 sales within ~0.75 mi
| Address | Dist | Beds/Ba | Sqft | Sold | Price | $/sf | Match |
|---|---|---|---|---|---|---|---|
| 303 Stancil St | 0.00mi | 3/1.0 | 1,017 (+3%) | 1mo | $208,000 | $205 | 94 |
| 320 Pace St | 0.08mi | 3/1.0 | 988 (0%) | 6mo | $230,000 | $233 | 91 |
| 509 Powell St | 0.09mi | 3/1.0 | 990 (+0%) | 15mo | $236,000 | $238 | 83 |
| 322 Pace St | 0.10mi | 2/1.0 (-1) | 986 (-0%) | 9mo | $226,450 | $230 | 83 |
| 200 Pace St | 0.26mi | 3/1.0 | 1,008 (+2%) | 12mo | $230,000 | $228 | 75 |
| 103 Phillips St | 0.32mi | 2/1.0 (-1) | 983 (-0%) | 5mo | $190,000 | $193 | 74 |
| 113 Strickland Dr | 0.34mi | 2/1.0 (-1) | 922 (-7%) | 14mo | $152,000 | $165 | 56 |
| 201 Barbour Rd | 0.61mi | 3/2.0 | 1,013 (+2%) | 16mo | $250,000 | $247 | 50 |
| 132 Brook Pl | 0.56mi | 3/2.0 | 1,133 (+15%) | 2mo | $250,000 | $221 | 44 |
| 305 C Wilsons Mill Rd Unit C | 0.50mi | 2/1.0 (-1) | 1,064 (+8%) | 24mo | $171,000 | $161 | 39 |
| 104 Sunrise Ave | 0.50mi | 3/1.5 | 1,100 (+11%) | 21mo | $239,000 | $217 | 38 |
Match score weights: distance 35% · size 25% · config 20% · recency 20%. Top-matched comps best support the ARV.
Projected returns pro-forma
-3.0% appreciation · 0.0% rent growth · sell at horizon
- IRR
- -20.5%
- Equity multiple
- 0.30×
- Total profit
- $-42,816
- Equity at exit
- $32,803
- IRR
- -21.6%
- Equity multiple
- 0.03×
- Total profit
- $-59,843
- Equity at exit
- $19,022
Cash invested: $61,600 (down + closing). Projections, not guarantees.
Landlord ↔ Tenant lean methodology
- Overall (STATE)
- 85 Strongly Landlord-Friendly
- State North Carolina
- 85 Strongly Landlord-Friendly · R+3
- County
- — inherits STATE
- City
- — inherits STATE
ZIP-level market 27577
- Home prices YoY
- -23.7%
- Rents YoY
- -1.1%
- Active inventory
- 407
- Price-to-rent
- 10.5×
Monthly cashflow live
- Estimated rent
- $1,751 medium interval (Pro) →
- Mortgage (P&I)
- −$1,154
- Tax from tax record
- −$169 /mo · $2,033/yr
- Insurance
- −$92
- HOA
- −$0
- Vacancy / Maint / Mgmt
- −$368
- Net cashflow
- $-31
Break-even live
Sensitivity live
| Price | -10% $93 | -5% $31 | +0% $-31 | +5% $-94 | +10% $-156 |
|---|---|---|---|---|---|
| Rent | -10% $-170 | -5% $-101 | +0% $-31 | +5% $38 | +10% $107 |
| Rate | -1.0pp $79 | -0.5pp $25 | base $-31 | +0.5pp $-88 | +1.0pp $-146 |
UW: 25.0% down · 7.5% · 30yr · 1.5% tax · 5.0% vac · 8.0% maint · 8.0% mgmt
Financing live
Cash to close
- Down payment
- $55,000
- Closing costs
- $6,600
- Reserves months
- —
- Total cash needed
- —
Loan-product check · same deal, 3 products live
Conventional
25% down · 7.5% · 30yr
- Down + closing
- —
- Monthly P&I
- —
- Monthly cashflow
- —
- DSCR
- —
- Eligible?
- —
Personal DTI + credit; lowest rate.
DSCR
20% down · 8.5% · 30yr
- Down + closing
- —
- Monthly P&I
- —
- Monthly cashflow
- —
- DSCR
- —
- Eligible?
- —
No personal income docs; deal must DSCR.
Hard money
10% down · 12.0% · 12mo
- Down + closing
- —
- Monthly P&I
- —
- Monthly cashflow
- —
- DSCR
- —
- Eligible?
- —
Short-term bridge; refi at stabilization.
Rent comps 1 comps
| Address | Beds | Baths | Sqft | Rent | $/sqft | DOM | Units | Dist |
|---|---|---|---|---|---|---|---|---|
| 206 Britt St Smithfield, NC | 3.0 | 1.0 | 1118 | $1,650 | $1.48 | 25d | 1 | 0.29mi |
Listing history 16 events
-
2026-05-09status Pending
-
2026-04-30$220,000 Active
-
2026-04-09soldstatus $220,000
-
2026-03-20historical
-
2026-03-11price $224,900
-
2025-12-29price $229,900
-
2025-12-17$239,900 Active
-
2012-04-05soldstatus $29,900 276-char remark
Show marketing remark (276 chars)
Sold as is. Seller makes no repairs. Hud Case number 381-533353. Fha insurable with escrow ($1650.00). Hud it's agents and or assigns makes no representations as to the existence of mold, radon or lead based paint and is not liable for the potentially harmful effects thereof.
-
2012-02-16historical 276-char remark
Show marketing remark (276 chars)
Sold as is. Seller makes no repairs. Hud Case number 381-533353. Fha insurable with escrow ($1650.00). Hud it's agents and or assigns makes no representations as to the existence of mold, radon or lead based paint and is not liable for the potentially harmful effects thereof.
-
2011-09-24$36,800 276-char remark
Show marketing remark (276 chars)
Sold as is. Seller makes no repairs. Hud Case number 381-533353. Fha insurable with escrow ($1650.00). Hud it's agents and or assigns makes no representations as to the existence of mold, radon or lead based paint and is not liable for the potentially harmful effects thereof.
-
1998-05-01soldstatus $68,000
-
1998-03-13historical
-
1997-06-12$67,900
-
1995-06-01soldstatus $59,000
ⓘ Source: listings_history table (triggers on properties + properties_extension) + one-shot
backfill from property_details.listing_events for pre-trigger history.
Tax reassessment forecast NC · Resets to sale price
- Current annual tax
- $2,033 · $169/mo
- Projected year-2 tax
- $2,033 · $169/mo
- Expected delta
- $0/yr ($0/mo · 0.0%)
ⓘ Screening estimate from a state-policy table — verify with the county assessor before closing.
Climate risk First Street
- Flood 4/10 Moderate FEMA zone X (unshaded) · 22% chance over 30 yrs
- Wildfire 3/10 Moderate
- Heat 7/10 Severe 7 d/yr ≥105°F today · 17 d/yr by 30 yrs out
- Wind 7/10 Severe 78% chance of damaging wind over 30 yrs
- Air quality 2/10 Low 1 unhealthy d/yr today · 1 by 30 yrs out
Nearby sold comps map
Loading sold comps map…
Walkable amenities ~0.75 mi
Loading nearby amenities…
Taxation est. · year 1
- Rental income
- $21,015
- − Mortgage interest
- −$12,323
- − Property taxes
- −$2,033
- − Insurance
- −$1,100
- − Repairs & maintenance
- −$1,681
- − Management
- −$1,681
- − Depreciation
- −$6,400
- Taxable loss
- −$4,204
- Est. tax savings @ 24.0%
- +$1,009
- After-tax cash flow
- $633/yr
For passive investors: Depreciation is non-cash, so a rental often shows a tax loss while cash-flowing — sheltering income. Rental losses are passive: they offset passive income freely, and up to $25,000/yr can offset ordinary (W-2) income if you actively participate and your MAGI is under $100k (phasing out to $0 by $150k); unused losses carry forward. On sale, claimed depreciation is recaptured at up to 25%, and gains may owe capital-gains tax (a 1031 exchange can defer both). Figures are a year-1 estimate at your 24.0% rate — not tax advice; consult a CPA.
Schools (NCES district)
- District
- Johnston County Public Schools
- NCES district ID
- 3702370
- Math proficiency
- 39% ▲ 4.00%
- Reading proficiency
- 42% ▲ 2.00%
- Median HH income
- $50,912
- Composite
- 34.99/100
- National rank
- #5052
- State rank
- #105 of 178 in NC
Livability — Smithfield
- Score
- 66/100
- State rank
- #259
- US rank
- #11380
Category grades
Schools grade is shown separately in the Schools card above.
Census & demographics
- Census place
- Smithfield, NC
- County
- Johnston County · 175,441 people
- City population
- 28,354
- Metro
- Raleigh-Cary, NC
- Population (ZIP)
- 28,354
- Household income
- $62,758
- Rent vs Own
- Severe rent burden
- 919.0
Population outlook (Johnston County) Hauer SSP2
- Today (2025)
- 222,440 people
- By 2030
- 240,227 · +8.0%
- By 2040
- 274,616 · +23.5%
- By 2050
- 304,915 · +37.1%
- By 2075
- 369,507 · +66.1%
- By 2100
- 406,280 · +82.6%
Race, ethnicity, and origin ACS 2023
- Neighborhood character
- Diverse neighborhood (Simpson 0.60)
- Race & ethnicity
- White 57% Hispanic / Latino 21% Black 19% Two or more races 7% Asian 1%
- Hispanic origin (detail)
- Mexican 13% Puerto Rican 2% Dominican 1%
- Common ancestry
- Lithuanian 2% Serbian 2% Slovak 1%
- Foreign-born
- 12% · Canada, Jamaica, South Korea
- Languages at home
- 80% English-only · Spanish 19%
Political lean MEDSL · Johnston
- 2024 margin
- Strong R (+21.5) · D 38.7% · R 60.2% · Other 1.1%
- 2008→2024 swing
- +2.2pp toward D · 2008: -23.7pp · 2024: -21.5pp
- All cycles
- 2024: R+21.5 2020: R+24.3 2016: R+30.7 2012: R+27.8 2008: R+23.7
Not yet ingested
- Civics
- —
Market trends
- HPI YoY
- ▼ -72.11%
- Current HPI
- 232.1552
- Rent YoY
- ▼ -1.05%
- Metro
- Raleigh-Cary, NC
- State GDP YoY
- ▲ 3.28%
- F500 in state
- 26
Industry mix (Fortune 500 HQ in NC)
| Industry | F500 HQs | Revenue |
|---|---|---|
| Financial Services | 2 | $213B |
|
||
| Retail | 2 | $95B |
|
||
| Industrial Conglomerate | 1 | $38B |
|
||
| Metals / Steel | 1 | $35B |
|
||
| Utilities | 1 | $30B |
|
||
| Industrial Machinery | 1 | $19B |
|
||
Price history
+272.9% since first listed16 events — show timeline
- 2026-05-09 Pending — TMLS
- 2026-04-30 Listed $220,000 TMLS
- 2026-04-09 Sold (Public Records) $220,000 Public Records
- 2026-03-20 Listing Removed — TMLS
- 2026-03-11 Price Changed $224,900 TMLS
- 2025-12-29 Price Changed $229,900 TMLS
- 2025-12-17 Listed $239,900 TMLS
- 2012-04-05 Sold (MLS) $29,900 AMLSNC
- 2012-04-05 Sold (MLS) $29,900 TMLS
- 2012-02-16 Listing Removed — TMLS
- 2011-09-24 Listed $36,800 AMLSNC
- 2011-09-24 Listed $36,800 TMLS
- 1998-05-01 Sold (Public Records) $68,000 Public Records
- 1998-03-13 Listing Removed — TMLS
- 1997-06-12 Listed $67,900 TMLS
- 1995-06-01 Sold (Public Records) $59,000 Public Records
Property tax history
+5.0%/yrLatest (2025): $2,033 · +81.4% YoY. Source: county tax records.
Cash-flow waterfall
monthlySold comps — $/sqft
last 12 mo · ≤1 miLoading sold comps…