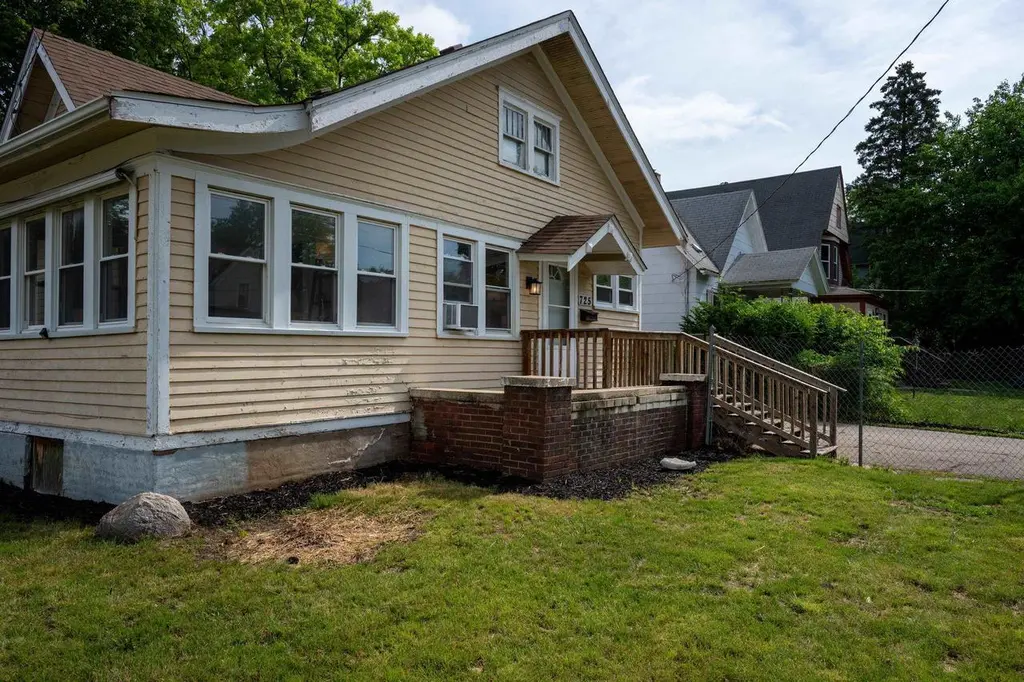
725 St Lawrence Ave · Beloit, WI
Flood risk 1/10 · Minimal
- FEMA flood zone
- X (unshaded)
- Chance of flooding over 30 yrs
- 0.0%
- Est. flood insurance / yr
- $507 – $1,088
Fire risk 1/10 · Minimal
- Est. fire insurance / yr
- $636 – $1,182
Heat risk 3/10 · Minor
- Hot days now (above 101°F)
- 7 days/yr
- Hot days in 30 yrs
- 14 days/yr
Wind risk 2/10 · Minimal
- Chance of severe wind over 30 yrs
- —
Air-quality risk 3/10 · Minor
- Unhealthy air days now
- 2 days/yr
- Unhealthy air days in 30 yrs
- 3 days/yr
Risk factors via First Street. Map © Google.
Why this score? — see what drove the B- grade
The composite is a weighted blend of 9 inputs, each scored 0–100. Each bar is that input's sub-score; the figure is the points it added to the 100-point composite (weight × sub-score).
- Cash flow +30.0/30.0
- DSCR +10.0/10.0
- 1% rule +9.3/10.0
- ARV discount +7.5/15.0
- Rent growth +4.0/5.0
- Livability +3.5/5.0
- Condition / age +2.5/5.0
- Schools +0.9/10.0
- Appreciation +0.0/10.0
$99,900
🖨 Deal sheet 📄 Offer letter ✓ Due diligence
Listing remarks
A great opportunity to pay less than you would when renting! This ranch offers bright rooms, hardwood floors, large lot, move in ready kitchen and bath and room to expand in the large walk up attic. With some updates this humble home could be a masterpiece, Great for an investor looking for a rental or someone that wants to roll up their sleaves and create some equity.
Key facts
- 6,098 sq ft lot
- Garage
- Built 1910
Property features AI
Exterior
- Parking: Detached 1-car garage
- Utilities: Municipal water; Municipal sewer
- Home design: Single-family, one-story home; Located on a 0.14-acre lot; Zoned residential
- Construction: Assessor/public records for year built
- Exterior features: Deck; Fenced yard; Wood exterior
Interior
- Kitchen: Kitchen on main level about 12 x 9; Stove; Refrigerator
- Bedrooms: Main-level primary bedroom about 13 x 10; Main-level bedroom 2 about 13 x 10; Main-level bedroom 3 about 12 x 11
- Bathrooms: One full bath; At least one tub; No master bathroom
- Heating & cooling: Forced air heating; Natural gas heat; Window A/C units
- Interior features: Full basement; Pantry
- Laundry & utility: Window air conditioning units (2)
Neighborhood map
What this means for you Summary
Snapshot
- This is a 3-bed/1.0-bath other listed at $100k.
Deal economics
- At list price, monthly cash flow is $408 ($5k/yr) — positive.
- The deal already cash-flows at list — no discount required.
- Meets the 1% rule at list price ($1k rent vs $100k).
- Cap rate 11.2% vs local median 3.5% in Beloit — top-decile yield for the area; either an underpriced asset or a hidden risk that comps aren't pricing in. Stress-test before assuming the spread holds.
Location & tenants
- Location reads 70/100 on livability (#283 in WI) — a middle-class / working-renter tenant base. Strengths: cost of living A+, housing A+, health & safety A+; Watch: crime D, amenities F, commute F.
- Beloit School District (urban): math 8% / reading 13% proficiency, ranked #339 of 342 in WI (top 99%) — low school quality limits family demand, transient renter base, plan for 1-2y turnover; 70% free/reduced lunch — lower-income household profile, screen leases tightly.
- Zoned schools: Hackett Elementary (math 2% / reading 2%, grade F, #1,024 of 1,041 statewide, top 100%, 287 students, 80% FRL); Memorial High (math 8% / reading 14%, grade F, #438 of 483 statewide, top 91%, 1,417 students, 66% FRL) — zoned schools at 73% FRL track the district average.
- Market conditions: Rents rising fast (+6.0%/yr); 202 active listings in the ZIP; 9 comparable units currently listed for rent nearby; rentals leasing fast (median 13d on market — plan ~1-2 weeks tenant-placement turnaround); 629 units permitted in Rock County in 2024 (263 in 5+ unit buildings).
Forward outlook
- Local home prices are declining (-3.0%/yr); year-one equity from $691 of loan paydown is wiped out by about $3k of value loss. Plan a longer hold.
- Rock County population projected to shrink 7% by 2050 — rents likely to lag national; underwrite the cash flow, not the appreciation.
- At projected returns (-3.0% appreciation + 6.0% rent growth), your $28k cash investment doubles in ~6 years — after that, you're playing with house money.
Negotiation context
- Only 3 days on market — expect competitive offers; lowballing is unlikely to land.
Risks & watch-outs
- Watch-outs: built in 1910 — expect roof / HVAC / electrical / plumbing capex.
Questions for the listing agent
- Built in 1910 — when were the roof, HVAC, electrical panel, plumbing, and water heater last replaced?
- Is there a deadline driving the sale (1031 exchange, divorce, estate, relocation)? That informs how much negotiation room exists.
- Schools are F-rated, which usually means shorter tenancies and higher turnover. Who's the typical renter profile here, and what's been the actual vacancy rate?
- Crime grade is D in this area — have there been break-ins, vandalism, or insurance claims at this property in the last 3 years? What carrier currently insures it and at what premium?
- What's the average days-on-market for RENTAL listings here right now (not sales)? A rising rental-DOM trend means longer vacancies and softer asking-rent achievability than the comps imply.
- What's the recent tenant-quality profile in this submarket — average credit score on applications, eviction rate, late-payment / NSF rate, and stable-employment percentage? A property-management company in the area should have these aggregated.
- How much new for-sale + rental construction is in the pipeline within 1–3 miles? Heavy new supply typically softens prices + rents 12–24 months out; constrained supply supports both.
Investment metrics
- 1% rule
- 1.43% ✓
- Cap rate
- 11.20%
- Cash-on-cash
- 17.51%
- DSCR
- 1.78
- GRM
- 5.8
CMA / ARV
No comps found within radius.
Projected returns pro-forma
-3.0% appreciation · 6.05% rent growth · sell at horizon
- IRR
- 12.4%
- Equity multiple
- 1.51×
- Total profit
- $14,362
- Equity at exit
- $14,895
- IRR
- 23.7%
- Equity multiple
- 3.35×
- Total profit
- $65,857
- Equity at exit
- $8,638
Cash invested: $27,972 (down + closing). Projections, not guarantees.
Landlord ↔ Tenant lean methodology
- Overall (STATE)
- 73 Landlord-Friendly
- State Wisconsin
- 73 Landlord-Friendly · R+2
- County
- — inherits STATE
- City
- — inherits STATE
ZIP-level market 53511
- Home prices YoY
- -26.9%
- Rents YoY
- 6.0%
- Active inventory
- 202
- Price-to-rent
- 5.8×
Monthly cashflow live
- Estimated rent
- $1,427 high interval (Pro) →
- Mortgage (P&I)
- −$524
- Tax from tax record
- −$153 /mo · $1,842/yr
- Insurance
- −$42
- HOA
- −$0
- Vacancy / Maint / Mgmt
- −$300
- Net cashflow
- $408
Break-even live
UW: 25.0% down · 7.5% · 30yr · 1.5% tax · 5.0% vac · 8.0% maint · 8.0% mgmt
Financing live
Cash to close
- Down payment
- $24,975
- Closing costs
- $2,997
- Reserves months
- —
- Total cash needed
- —
Loan-product check · same deal, 3 products live
Conventional
25% down · 7.5% · 30yr
- Down + closing
- —
- Monthly P&I
- —
- Monthly cashflow
- —
- DSCR
- —
- Eligible?
- —
Personal DTI + credit; lowest rate.
DSCR
20% down · 8.5% · 30yr
- Down + closing
- —
- Monthly P&I
- —
- Monthly cashflow
- —
- DSCR
- —
- Eligible?
- —
No personal income docs; deal must DSCR.
Hard money
10% down · 12.0% · 12mo
- Down + closing
- —
- Monthly P&I
- —
- Monthly cashflow
- —
- DSCR
- —
- Eligible?
- —
Short-term bridge; refi at stabilization.
Rent comps 9 comps
| Address | Beds | Baths | Sqft | Rent | $/sqft | DOM | Units | Dist |
|---|---|---|---|---|---|---|---|---|
| 861 Bluff St Unit 861 Beloit, WI | 4.0 | 1.0 | 1282 | $1,600 | $1.25 | 43d | 1 | 0.39mi |
| 1023 Hackett St Beloit, WI | 2.0 | 1.0 | 926 | $1,200 | $1.30 | 43d | 1 | 0.44mi |
| 124 Miller St South Beloit, IL | 2.0 | 1.0 | 850 | $1,500 | $1.76 | 13d | 1 | 0.61mi |
| 430 E Grand Ave Beloit, WI | 1.0–2.0 | 1.0 | 934 | $1,835 | $1.96 | 13d | 4 | 0.74mi |
| 1223 6th St Beloit, WI | 4.0 | 2.0 | 1464 | $1,750 | $1.20 | 43d | 1 | 0.77mi |
| 614 Broad St Unit 226 Beloit, WI | 2.0 | 2.0 | 1125 | $1,195 | $1.06 | 13d | 1 | 0.99mi |
| 532 Lawton Ave Beloit, WI | 2.0 | 1.0 | 872 | $1,220 | $1.40 | 13d | 5 | 0.99mi |
| 205 Birch Ave Unit 2 Beloit, WI | 2.0 | 1.0 | 1288 | $1,000 | $0.78 | 13d | 1 | 1.30mi |
| 206 Carpenter St Unit 3 Beloit, WI | 2.0 | 1.0 | 1400 | $1,000 | $0.71 | 13d | 1 | 1.32mi |
Listing history 4 events
-
2026-06-16status $99,900 Pending 3 DOM
-
2026-06-15days on market $99,900 Active 3 DOM
-
2026-06-13remarks 371-char remark
-
2026-06-13$99,900 Active 1 DOM
ⓘ Source: listings_history table (triggers on properties + properties_extension) + one-shot
backfill from property_details.listing_events for pre-trigger history.
Tax reassessment forecast WI · Partial reset (capped growth)
- Current annual tax
- $1,842 · $153/mo
- Projected year-2 tax
- $1,845 · $154/mo
- Expected delta
- +$3/yr ($0/mo · 0.2%)
ⓘ Screening estimate from a state-policy table — verify with the county assessor before closing.
Climate risk First Street
- Flood 1/10 Low FEMA zone X (unshaded) · 0% chance over 30 yrs
- Wildfire 1/10 Low
- Heat 3/10 Moderate 7 d/yr ≥101°F today · 14 d/yr by 30 yrs out
- Wind 2/10 Low
- Air quality 3/10 Moderate 2 unhealthy d/yr today · 3 by 30 yrs out
Nearby sold comps map
Loading sold comps map…
Walkable amenities ~0.75 mi
Loading nearby amenities…
Taxation est. · year 1
- Rental income
- $17,122
- − Mortgage interest
- −$5,596
- − Property taxes
- −$1,842
- − Insurance
- −$500
- − Repairs & maintenance
- −$1,370
- − Management
- −$1,370
- − Depreciation
- −$2,906
- Taxable income
- $3,539
- Est. tax owed @ 24.0%
- −$849
- After-tax cash flow
- $4,049/yr
For passive investors: Depreciation is non-cash, so a rental often shows a tax loss while cash-flowing — sheltering income. Rental losses are passive: they offset passive income freely, and up to $25,000/yr can offset ordinary (W-2) income if you actively participate and your MAGI is under $100k (phasing out to $0 by $150k); unused losses carry forward. On sale, claimed depreciation is recaptured at up to 25%, and gains may owe capital-gains tax (a 1031 exchange can defer both). Figures are a year-1 estimate at your 24.0% rate — not tax advice; consult a CPA.
Schools (NCES district)
- District
- Beloit School District
- NCES district ID
- 5501050
- Math proficiency
- 8% ▼ -10.00%
- Reading proficiency
- 13% ▼ -5.00%
- Median HH income
- $37,328
- Composite
- 8.81/100
- National rank
- #9890
- State rank
- #339 of 342 in WI
Livability — Beloit
- Score
- 70/100
- State rank
- #283
- US rank
- #7336
Category grades
Schools grade is shown separately in the Schools card above.
Census & demographics
- Census place
- Beloit, WI
- County
- Rock County · 135,428 people
- City population
- 48,701
- Metro
- Janesville-Beloit, WI
- Population (ZIP)
- 48,701
- Household income
- $67,067
- Rent vs Own
- Severe rent burden
- 1341.0
Population outlook (Rock County) Hauer SSP2
- Today (2025)
- 163,403 people
- By 2030
- 162,815 · -0.4%
- By 2040
- 158,655 · -2.9%
- By 2050
- 151,235 · -7.4%
- By 2075
- 131,901 · -19.3%
- By 2100
- 108,665 · -33.5%
Race, ethnicity, and origin ACS 2023
- Neighborhood character
- Majority White (64%)
- Race & ethnicity
- White 64% Hispanic / Latino 19% Two or more races 14% Black 11% Asian 1%
- Hispanic origin (detail)
- Mexican 15% Dominican 1%
- Common ancestry
- Portuguese 8% Romanian 3% Lithuanian 2%
- Foreign-born
- 9% · Canada
- Languages at home
- 85% English-only · Spanish 14%
Political lean MEDSL · Rock
- 2024 margin
- Lean D (+7.3) · D 52.9% · R 45.6% · Other 1.4%
- 2008→2024 swing
- -22.0pp toward R · 2008: 29.3pp · 2024: 7.3pp
- All cycles
- 2024: D+7.3 2020: D+11.2 2016: D+10.5 2012: D+23.2 2008: D+29.3
Not yet ingested
- Civics
- —
Market trends
- HPI YoY
- ▼ -115.19%
- Current HPI
- 312.6591
- Rent YoY
- ▲ 6.05%
- Metro
- Janesville-Beloit, WI
- State GDP YoY
- ▲ 2.10%
- F500 in state
- 20
Industry mix (Fortune 500 HQ in WI)
| Industry | F500 HQs | Revenue |
|---|---|---|
| Industrial Machinery | 4 | $23B |
|
||
| Industrial Technology | 2 | $36B |
|
||
| Insurance | 1 | $36B |
|
||
| Professional Services | 1 | $19B |
|
||
| Utilities | 1 | $9B |
|
||
| Consumer Goods | 1 | $3B |
|
||
Price history
1 event — show timeline
- 2026-06-12 Listed $99,900 SCWMLS
Property tax history
+2.0%/yrLatest (2025): $1,842 · +34.7% YoY. Source: county tax records.
Cash-flow waterfall
monthlySold comps — $/sqft
last 12 mo · ≤1 miLoading sold comps…