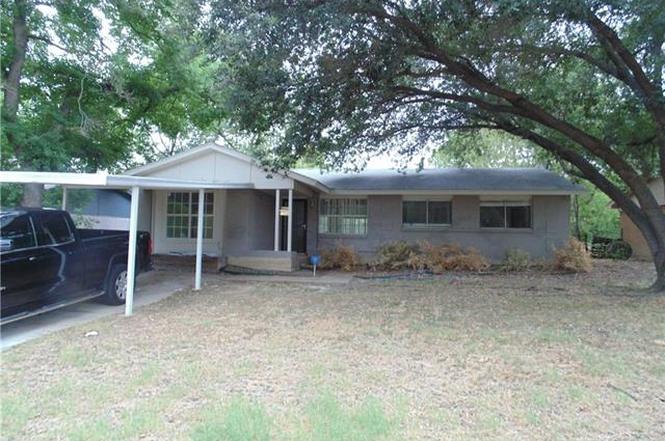
2615 North Pkwy · Mesquite, TX
Flood risk 1/10 · Minimal
- FEMA flood zone
- X (unshaded)
- Chance of flooding over 30 yrs
- 0.0%
- Est. flood insurance / yr
- $507 – $1,088
Fire risk 1/10 · Minimal
- Est. fire insurance / yr
- $1,222 – $2,270
Heat risk 7/10 · Major
- Hot days now (above 110°F)
- 7 days/yr
- Hot days in 30 yrs
- 24 days/yr
Wind risk 6/10 · Moderate
- Chance of severe wind over 30 yrs
- 27.0%
Air-quality risk 2/10 · Minimal
- Unhealthy air days now
- 1 days/yr
- Unhealthy air days in 30 yrs
- 2 days/yr
Risk factors via First Street. Map © Google.
Why this score? — see what drove the B- grade
The composite is a weighted blend of 9 inputs, each scored 0–100. Each bar is that input's sub-score; the figure is the points it added to the 100-point composite (weight × sub-score).
- Cash flow +23.8/30.0
- ARV discount +15.0/15.0
- 1% rule +7.8/10.0
- DSCR +7.7/10.0
- Livability +3.5/5.0
- Schools +2.9/10.0
- Rent growth +2.6/5.0
- Condition / age +2.5/5.0
- Appreciation +0.0/10.0
$154,900
🖨 Deal sheet (PDF) 📄 Offer letter ✓ Due diligence
Listing remarks
Home is being sold as-is. Come bring your imagination and make this home your own or turn it into an investment opportunity. Please note the property needs foundation, roof and plumbing work and will not qualify for traditional financing. No repairs will be made or negotiated—priced to sell! Enjoy park views right from your front door at 2615 North Park Way! Nestled in a quiet neighborhood with nearby walking trails, this inviting 3-bedroom, 2-bathroom home offers 1,049 sq. ft. of comfortable living space. The converted garage provides additional flexible living space—perfect for a family room, home office, or play area. Outside, you’ll love the fenced backyard, ideal for
Key facts
- Park views
- Converted garage
- Quiet neighborhood
Tags
Neighborhood map
What this means for you Summary
Snapshot
- This is a 3-bed/2.0-bath single-family listed at $155k.
Deal economics
- At list price, monthly cash flow is $299 ($4k/yr) — positive.
- The deal already cash-flows at list — no discount required.
- Meets the 1% rule at list price ($2k rent vs $155k).
- Recommended offer: $146k (6.0% below list) — sets the bar for market timing.
- Cap rate 8.6% vs local median 4.4% in Mesquite — top-decile yield for the area; either an underpriced asset or a hidden risk that comps aren't pricing in. Stress-test before assuming the spread holds.
Location & tenants
- Location reads 70/100 on livability (#358 in TX) — a middle-class / working-renter tenant base. Strengths: cost of living A+, housing A+, health & safety A-; Watch: crime F, commute F.
- Mesquite ISD (suburban): math 35% / reading 32% proficiency, ranked #536 of 826 in TX (top 65%) — families likely to look elsewhere, expect single-tenant / working-renter base with shorter leases; 63% free/reduced lunch — lower-income household profile, screen leases tightly.
- Zoned schools: Rugel El (math 32% / reading 27%, grade F, #2,525 of 4,322 statewide, top 62%, 331 students, 80% FRL) — zoned schools average 80% FRL vs 63% district-wide (17 pts higher); higher-poverty schools than district average — tighter screening recommended.
- Market conditions: Rents flat; 345 active listings in the ZIP; 40 comparable units currently listed for rent nearby; rentals at typical pace (median 19d on market — plan ~3-4 weeks tenant-placement turnaround); 12,577 units permitted in Dallas County in 2024 (6,829 in 5+ unit buildings).
- This rent runs 34% of the median local income ($71k/yr) — at the standard rent-burdened threshold; future hikes will face affordability resistance.
Forward outlook
- Local home prices are declining (-3.0%/yr); year-one equity from $1k of loan paydown is wiped out by about $5k of value loss. Plan a longer hold.
- Dallas County population projected at +35% by 2050 — long-run rental-demand tailwind backs the buy-and-hold thesis.
Negotiation context
- It's been on market 86 days — a 6% lower offer ($146k) is reasonable based on typical stale-listing flexibility.
- 9 sale attempts since 20y ago; this cycle's ask is 7% above the opening price — seller raised mid-cycle; expect resistance to lowballs.
Risks & watch-outs
- Watch-outs: property tax is 3.0% of price.
- Climate carrying-cost: major wind risk, 27% chance of damaging wind over 30y; extreme-heat days projected 7→24/yr by 2055 (HVAC capex compounding) — expect insurance premiums to compound above CPI over the hold.
Questions for the listing agent
- It's been on market 86 days. Have you received any prior offers? Is the seller open to a 6% concession, seller financing, or rate buy-down credit?
- Built in 1964 — when were the roof, HVAC, electrical panel, plumbing, and water heater last replaced?
- Property tax is high relative to price — has the assessment been appealed recently, and will the sale trigger a re-assessment?
- Why hasn't it sold? Are there any deal-killer items the seller is aware of (foundation, flood, title, zoning, code violations)?
- Is there a deadline driving the sale (1031 exchange, divorce, estate, relocation)? That informs how much negotiation room exists.
- Crime grade is F in this area — have there been break-ins, vandalism, or insurance claims at this property in the last 3 years? What carrier currently insures it and at what premium?
- What's the average days-on-market for RENTAL listings here right now (not sales)? A rising rental-DOM trend means longer vacancies and softer asking-rent achievability than the comps imply.
- What's the recent tenant-quality profile in this submarket — average credit score on applications, eviction rate, late-payment / NSF rate, and stable-employment percentage? A property-management company in the area should have these aggregated.
- How much new for-sale + rental construction is in the pipeline within 1–3 miles? Heavy new supply typically softens prices + rents 12–24 months out; constrained supply supports both.
Investment metrics
- 1% rule
- 1.28% ✓
- Cap rate
- 8.61%
- Cash-on-cash
- 8.27%
- DSCR
- 1.37
- GRM
- 6.5
CMA / ARV
- ARV (on-the-fly)
- $231,578
- Comps found
- 12
Show comp detail 12 sales within ~0.75 mi
| Address | Dist | Beds/Ba | Sqft | Sold | Price | $/sf | Match |
|---|---|---|---|---|---|---|---|
| 2615 North Pkwy | 0.00mi | 3/2.0 | 1,301 (0%) | 2mo | $154,900 | $119 | 98 |
| 2631 Brenda Dr | 0.18mi | 3/1.5 | 1,248 (-4%) | 4mo | $197,000 | $158 | 80 |
| 2735 U.S. 80 Unit 1-201 | 0.31mi | 3/2.0 | 1,320 (+2%) | 6mo | $382,500 | $290 | 78 |
| 1837 South Pkwy | 0.13mi | 3/1.5 | 1,407 (+8%) | 3mo | $249,000 | $177 | 76 |
| 2530 Wanda Dr | 0.32mi | 3/2.0 | 1,246 (-4%) | 4mo | $230,000 | $185 | 75 |
| 2004 Eastbrook Cir | 0.63mi | 3/2.0 | 1,263 (-3%) | 1mo | $237,500 | $188 | 65 |
| 2332 Rose Marie Dr | 0.40mi | 4/2.0 (+1) | 1,248 (-4%) | 6mo | $230,000 | $184 | 64 |
| 2406 Whit Dr | 0.51mi | 3/1.5 | 1,236 (-5%) | 2mo | $219,000 | $177 | 64 |
| 2701 Northview Pl | 0.49mi | 4/2.5 (+1) | 1,290 (-1%) | 8mo | $229,900 | $178 | 62 |
| 2527 Larchmont Dr | 0.62mi | 3/1.5 | 1,263 (-3%) | 4mo | $212,900 | $169 | 60 |
| 2725 Northview Pl | 0.46mi | 4/2.0 (+1) | 1,228 (-6%) | 5mo | $219,900 | $179 | 60 |
| 2231 Loyce Dr | 0.45mi | 4/1.0 (+1) | 1,203 (-8%) | 1mo | $199,999 | $166 | 57 |
Match score weights: distance 35% · size 25% · config 20% · recency 20%. Top-matched comps best support the ARV.
Projected returns pro-forma
-3.0% appreciation · 0.22% rent growth · sell at horizon
- IRR
- -7.3%
- Equity multiple
- 0.74×
- Total profit
- $-11,299
- Equity at exit
- $23,096
- IRR
- -2.2%
- Equity multiple
- 0.87×
- Total profit
- $-5,638
- Equity at exit
- $13,393
Cash invested: $43,372 (down + closing). Projections, not guarantees.
Landlord ↔ Tenant lean methodology
- Overall (STATE)
- 87 Strongly Landlord-Friendly
- State Texas
- 87 Strongly Landlord-Friendly · R+5
- County
- — inherits STATE
- City
- — inherits STATE
ZIP-level market 75149
- Home prices YoY
- -27.4%
- Rents YoY
- 0.2%
- Active inventory
- 345
- Price-to-rent
- 6.5×
Monthly cashflow live
- Estimated rent
- $1,982 high interval (Pro) →
- Mortgage (P&I)
- −$812
- Tax from tax record
- −$390 /mo · $4,675/yr
- Insurance
- −$65
- HOA
- −$0
- Vacancy / Maint / Mgmt
- −$416
- Net cashflow
- $299
Break-even live
Sensitivity live
| Price | -10% $387 | -5% $343 | +0% $299 | +5% $255 | +10% $211 |
|---|---|---|---|---|---|
| Rent | -10% $142 | -5% $221 | +0% $299 | +5% $377 | +10% $456 |
| Rate | -1.0pp $377 | -0.5pp $338 | base $299 | +0.5pp $259 | +1.0pp $218 |
UW: 25.0% down · 7.5% · 30yr · 1.5% tax · 5.0% vac · 8.0% maint · 8.0% mgmt
Financing live
Cash to close
- Down payment
- $38,725
- Closing costs
- $4,647
- Reserves months
- —
- Total cash needed
- —
Loan-product check · same deal, 3 products live
Conventional
25% down · 7.5% · 30yr
- Down + closing
- —
- Monthly P&I
- —
- Monthly cashflow
- —
- DSCR
- —
- Eligible?
- —
Personal DTI + credit; lowest rate.
DSCR
20% down · 8.5% · 30yr
- Down + closing
- —
- Monthly P&I
- —
- Monthly cashflow
- —
- DSCR
- —
- Eligible?
- —
No personal income docs; deal must DSCR.
Hard money
10% down · 12.0% · 12mo
- Down + closing
- —
- Monthly P&I
- —
- Monthly cashflow
- —
- DSCR
- —
- Eligible?
- —
Short-term bridge; refi at stabilization.
Rent comps 40 comps
| Address | Beds | Baths | Sqft | Rent | $/sqft | DOM | Units | Dist |
|---|---|---|---|---|---|---|---|---|
| 2707 Judy Dr Mesquite, TX | 3.0 | 1.0 | 1505 | $2,100 | $1.40 | 45d | 1 | 0.11mi |
| 2632 Sybil Dr Mesquite, TX | 3.0 | 1.5 | 988 | $1,645 | $1.66 | 45d | 1 | 0.25mi |
| 1809 Baker Dr Mesquite, TX | 1.0–2.0 | 1.0–2.0 | 874 | $1,431 | $1.64 | 45d | 3 | 0.38mi |
| 2721 Northview Pl Mesquite, TX | 4.0 | 2.5 | 1512 | $2,135 | $1.41 | 45d | 1 | 0.48mi |
| 2721 Northview Pl Mesquite, TX | 4.0 | 2.0 | 1512 | $2,245 | $1.48 | 21d | 1 | 0.48mi |
| 2101 US Highway 80 E Mesquite, TX | 1.0–2.0 | 1.0–2.0 | 831 | $1,437 | $1.73 | 0d | 27 | 0.68mi |
| 2021 Aloha Dr Mesquite, TX | 3.0 | 2.0 | 1556 | $2,200 | $1.41 | 45d | 1 | 0.69mi |
| 2808 Belhaven Dr Mesquite, TX | 3.0 | 1.5 | 1199 | $1,695 | $1.41 | 3d | 1 | 0.81mi |
| 2641 Bluebird Ln Mesquite, TX | 3.0 | 1.5 | 1372 | $1,650 | $1.20 | 9d | 1 | 1.00mi |
| 19200 Lyndon B Johnson Fwy Mesquite, TX | 2.0 | 1.0–2.0 | 780 | $1,520 | $1.95 | 0d | 13 | 1.02mi |
| 2837 Appaloosa Ln Mesquite, TX | 3.0 | 2.5 | 1837 | $2,500 | $1.36 | 45d | 1 | 1.06mi |
| 409 Starling Dr Mesquite, TX | 4.0 | 1.5 | 1200 | $2,099 | $1.75 | 25d | 1 | 1.10mi |
| 2829 Bellflower Dr Mesquite, TX | 3.0 | 2.5 | 1776 | $2,350 | $1.32 | 0d | 1 | 1.11mi |
| 2920 Bluets Dr Mesquite, TX | 3.0 | 3.0 | 1477 | $2,200 | $1.49 | 0d | 1 | 1.13mi |
| 2909 Bluets Dr Mesquite, TX | 3.0 | 2.5 | 1728 | $2,000 | $1.16 | 16d | 1 | 1.15mi |
| 2820 Percheron Dr Mesquite, TX | 3.0 | 2.5 | 1769 | $2,400 | $1.36 | 0d | 1 | 1.16mi |
| 2820 Percheron Dr Mesquite, TX | 3.0 | 2.5 | 1769 | $2,400 | $1.36 | 25d | 1 | 1.16mi |
| 2317 Spiceberry Ln Mesquite, TX | 3.0 | 2.0 | 1300 | $1,695 | $1.30 | 9d | 1 | 1.16mi |
| 1149 Redman Ave Mesquite, TX | 3.0 | 2.0 | 1225 | $1,750 | $1.43 | 45d | 1 | 1.16mi |
| 2908 Mare Dr Mesquite, TX | 3.0 | 2.5 | 1722 | $2,100 | $1.22 | 45d | 1 | 1.17mi |
| 1213 Redman Ave Mesquite, TX | 3.0 | 2.0 | 1225 | $1,650 | $1.35 | 14d | 1 | 1.19mi |
| 2225 Janice St Mesquite, TX | 3.0 | 1.5 | 1392 | $1,695 | $1.22 | 25d | 1 | 1.21mi |
| 2605 Franklin Dr Mesquite, TX | 1.0–2.0 | 1.0–2.0 | 847 | $1,650 | $1.95 | 6d | 1 | 1.21mi |
| 2722 Spiceberry Ln Mesquite, TX | 3.0 | 2.0 | 1270 | $2,085 | $1.64 | 4d | 1 | 1.23mi |
| 1232 Redman Ave Mesquite, TX | 3.0 | 2.0 | 1250 | $1,750 | $1.40 | 45d | 1 | 1.24mi |
| 2948 Percheron Dr Unit NA Mesquite, TX | 3.0 | 2.5 | 1691 | $1,995 | $1.18 | 25d | 1 | 1.24mi |
| 2900 Aiden Ln Mesquite, TX | 3.0 | 2.5 | 1627 | $2,150 | $1.32 | 0d | 1 | 1.25mi |
| 3512 Bahamas Dr Mesquite, TX | 3.0 | 2.0 | 1455 | $1,795 | $1.23 | 13d | 1 | 1.27mi |
| 3512 Bahamas Dr Mesquite, TX | 3.0 | 2.0 | 1455 | $1,795 | $1.23 | 25d | 1 | 1.27mi |
| 3512 Bahamas Dr Mesquite, TX | 3.0 | 2.0 | 1455 | $1,750 | $1.20 | 0d | 1 | 1.27mi |
| 2941 Baneberry Ln Mesquite, TX | 3.0 | 2.5 | 1810 | $2,500 | $1.38 | 45d | 1 | 1.29mi |
| 3017 Percheron Dr Mesquite, TX | 3.0 | 3.0 | 1473 | $1,995 | $1.35 | 23d | 1 | 1.30mi |
| 3021 Percheron Dr Mesquite, TX | 3.0 | 3.0 | 1754 | $2,299 | $1.31 | 19d | 1 | 1.30mi |
| 3021 Percheron Dr Unit NA Mesquite, TX | 3.0 | 3.0 | 1754 | $2,299 | $1.31 | 9d | 1 | 1.30mi |
| 2944 Baneberry Ln Mesquite, TX | 3.0 | 2.5 | 1772 | $2,400 | $1.35 | 45d | 1 | 1.30mi |
| 2969 Baneberry Ln Mesquite, TX | 3.0 | 2.5 | 1716 | $2,400 | $1.40 | 9d | 1 | 1.32mi |
| 3004 Baneberry Ln Mesquite, TX | 3.0 | 3.0 | 1786 | $2,445 | $1.37 | 45d | 1 | 1.33mi |
| 3036 Shire Dr Mesquite, TX | 3.0 | 2.5 | 1691 | $2,350 | $1.39 | 14d | 1 | 1.34mi |
| 4200 U.S. 80 Mesquite, TX | 1.0–2.0 | 1.0–2.0 | 787 | $1,545 | $1.96 | 0d | 132 | 1.38mi |
| 3206 Heather Glen Dr Mesquite, TX | 4.0 | 2.0 | 1708 | $4,800 | $2.81 | 0d | 1 | 1.39mi |
Listing history 27 events
-
2026-04-06status Pending
-
2026-03-25historical Active Option Contract
-
2026-02-18price $154,900
-
2026-02-17status Active
-
2025-12-08status Active
-
2025-12-02historical Active Option Contract
-
2025-11-25status Active
-
2025-11-18historical Active Option Contract
-
2025-11-07$145,000 Active
-
2015-11-25soldstatus Sold
-
2015-11-24soldstatus
-
2015-11-11status Pending
-
2015-10-15price $107,500
-
2015-08-28$109,900 Active
-
2014-06-20historical
-
2014-05-05$94,888 Active
-
2013-07-18historical
-
2013-05-28status Pending
-
2013-02-23price $84,500
-
2013-02-16status Active
-
2013-02-15historical
-
2013-02-15$88,900 Active
-
2007-02-06soldstatus
-
2006-12-21historical
-
2006-09-15$64,800
-
2004-06-03soldstatus
-
2003-08-21soldstatus
ⓘ Source: listings_history table (triggers on properties + properties_extension) + one-shot
backfill from property_details.listing_events for pre-trigger history.
Tax reassessment forecast TX · Resets to sale price
- Current annual tax
- $4,675 · $390/mo
- Projected year-2 tax
- $4,675 · $390/mo
- Expected delta
- $0/yr ($0/mo · 0.0%)
ⓘ Screening estimate from a state-policy table — verify with the county assessor before closing.
Climate risk First Street
- Flood 1/10 Low FEMA zone X (unshaded) · 0% chance over 30 yrs
- Wildfire 1/10 Low
- Heat 7/10 Severe 7 d/yr ≥110°F today · 24 d/yr by 30 yrs out
- Wind 6/10 Major 27% chance of damaging wind over 30 yrs
- Air quality 2/10 Low 1 unhealthy d/yr today · 2 by 30 yrs out
Nearby sold comps map
Loading sold comps map…
Walkable amenities ~0.75 mi
Loading nearby amenities…
Taxation est. · year 1
- Rental income
- $23,779
- − Mortgage interest
- −$8,677
- − Property taxes
- −$4,675
- − Insurance
- −$774
- − Repairs & maintenance
- −$1,902
- − Management
- −$1,902
- − Depreciation
- −$4,506
- Taxable income
- $1,342
- Est. tax owed @ 24.0%
- −$322
- After-tax cash flow
- $3,266/yr
For passive investors: Depreciation is non-cash, so a rental often shows a tax loss while cash-flowing — sheltering income. Rental losses are passive: they offset passive income freely, and up to $25,000/yr can offset ordinary (W-2) income if you actively participate and your MAGI is under $100k (phasing out to $0 by $150k); unused losses carry forward. On sale, claimed depreciation is recaptured at up to 25%, and gains may owe capital-gains tax (a 1031 exchange can defer both). Figures are a year-1 estimate at your 24.0% rate — not tax advice; consult a CPA.
Schools (NCES district)
- District
- Mesquite ISD
- NCES district ID
- 4830390
- Math proficiency
- 35% ▼ -11.00%
- Reading proficiency
- 32% ▼ -7.00%
- Median HH income
- $49,372
- Composite
- 29.06/100
- National rank
- #6606
- State rank
- #536 of 826 in TX
Livability — Mesquite
- Score
- 70/100
- State rank
- #358
- US rank
- #7743
Category grades
Schools grade is shown separately in the Schools card above.
Census & demographics
- Census place
- Mesquite, TX
- County
- Dallas County · 2,612,404 people
- City population
- 150,788
- Metro
- Dallas-Fort Worth-Arlington, TX
- Population (ZIP)
- 58,262
- Household income
- $70,774
- Rent vs Own
- Severe rent burden
- 2266.0
Population outlook (Dallas County) Hauer SSP2
- Today (2025)
- 2,979,839 people
- By 2030
- 3,191,823 · +7.1%
- By 2040
- 3,619,611 · +21.5%
- By 2050
- 4,026,915 · +35.1%
- By 2075
- 4,957,073 · +66.4%
- By 2100
- 5,508,725 · +84.9%
Race, ethnicity, and origin ACS 2023
- Neighborhood character
- Diverse neighborhood (Simpson 0.65)
- Race & ethnicity
- Hispanic / Latino 49% White 25% Two or more races 21% Black 20% Asian 2% Native American 1%
- Hispanic origin (detail)
- Mexican 42% Cuban 1%
- Common ancestry
- Italian 1% Iranian 1% Serbian 1%
- Foreign-born
- 22% · Canada, Vietnam
- Languages at home
- 58% English-only · Spanish 39% Other Asian/Pacific 1% Vietnamese 1%
Political lean MEDSL · Dallas
- 2024 margin
- Strong D (+22.2) · D 60.2% · R 38.0% · Other 1.8%
- 2008→2024 swing
- +6.9pp toward D · 2008: 15.3pp · 2024: 22.2pp
- All cycles
- 2024: D+22.2 2020: D+31.6 2016: D+26.2 2012: D+15.4 2008: D+15.3
Not yet ingested
- Civics
- —
Market trends
- HPI YoY
- ▼ -130.12%
- Current HPI
- 345.6606
- Rent YoY
- ▲ 0.22%
- Metro
- Dallas-Fort Worth-Arlington, TX
- State GDP YoY
- ▲ 3.95%
- F500 in state
- 110
Industry mix (Fortune 500 HQ in TX)
| Industry | F500 HQs | Revenue |
|---|---|---|
| Energy | 16 | $1,198B |
|
||
| Technology | 5 | $198B |
|
||
| Engineering / Construction | 4 | $72B |
|
||
| Energy Services | 3 | $60B |
|
||
| Utilities | 3 | $41B |
|
||
| Healthcare | 2 | $330B |
|
||
Price history
+139.0% since first listed27 events — show timeline
- 2026-04-06 Pending — NTREIS
- 2026-03-25 Contingent — NTREIS
- 2026-02-18 Price Changed $154,900 NTREIS
- 2026-02-17 Relisted — NTREIS
- 2025-12-08 Relisted — NTREIS
- 2025-12-02 Contingent — NTREIS
- 2025-11-25 Relisted — NTREIS
- 2025-11-18 Contingent — NTREIS
- 2025-11-07 Listed $145,000 NTREIS
- 2015-11-25 Sold (MLS) — NTREIS
- 2015-11-24 Sold (Public Records) — Public Records
- 2015-11-11 Pending — NTREIS
- 2015-10-15 Price Changed $107,500 NTREIS
- 2015-08-28 Listed $109,900 NTREIS
- 2014-06-20 Listing Removed — NTREIS
- 2014-05-05 Listed $94,888 NTREIS
- 2013-07-18 Listing Removed — NTREIS
- 2013-05-28 Pending — NTREIS
- 2013-02-23 Price Changed $84,500 NTREIS
- 2013-02-16 Relisted — NTREIS
- 2013-02-15 Listing Removed — NTREIS
- 2013-02-15 Listed $88,900 NTREIS
- 2007-02-06 Sold (MLS) — NTREIS
- 2006-12-21 Listing Removed — NTREIS
- 2006-09-15 Listed $64,800 NTREIS
- 2004-06-03 Sold (Public Records) — Public Records
- 2003-08-21 Sold (Public Records) — Public Records
Property tax history
+8.1%/yrLatest (2025): $4,675 · +1.1% YoY. Source: county tax records.
Cash-flow waterfall
monthlySold comps — $/sqft
last 12 mo · ≤1 miLoading sold comps…