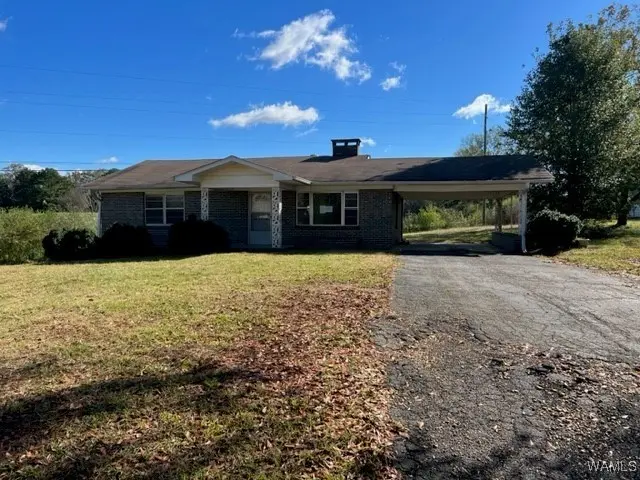
398 County Rd 60 · Winfield, AL
Flood risk No data
- FEMA flood zone
- —
- Chance of flooding over 30 yrs
- —
- Est. flood insurance / yr
- —
Fire risk No data
- Est. fire insurance / yr
- —
Heat risk No data
- Hot days now (above threshold)
- —
- Hot days in 30 yrs
- —
Wind risk No data
- Chance of severe wind over 30 yrs
- —
Air-quality risk No data
- Unhealthy air days now
- —
- Unhealthy air days in 30 yrs
- —
Risk factors via First Street. Map © Google.
Why this score? — see what drove the C+ grade
The composite is a weighted blend of 9 inputs, each scored 0–100. Each bar is that input's sub-score; the figure is the points it added to the 100-point composite (weight × sub-score).
- Cash flow +23.9/30.0
- ARV discount +11.9/15.0
- DSCR +7.7/10.0
- 1% rule +6.2/10.0
- Schools +4.0/10.0
- Livability +3.4/5.0
- Condition / age +2.8/5.0
- Rent growth +2.5/5.0
- Appreciation +0.0/10.0
$95,200
🖨 Deal sheet 📄 Offer letter ✓ Due diligence
Listing remarks MLS
Perfect fixer upper opportunity. Two bedrooms, one bathroom house in Winfield, AL. Full of potential on big corner lot.
Key facts
- 0.7 acre lot
- Built 1945
- Listed 575 days
Neighborhood map
What this means for you Summary
Snapshot
- This is a 2-bed/1.0-bath single-family listed at $95k. Condition is rated average.
Deal economics
- At list price, monthly cash flow is $184 ($2k/yr) — positive.
- The deal already cash-flows at list — no discount required.
- Meets the 1% rule at list price ($1k rent vs $95k).
- Recommended offer: $84k (12.0% below list) — sets the bar for market timing.
- Cap rate 8.6% vs local median 2.8% in Winfield — top-decile yield for the area; either an underpriced asset or a hidden risk that comps aren't pricing in. Stress-test before assuming the spread holds.
Location & tenants
- Location reads 67/100 on livability (#84 in AL) — a middle-class / working-renter tenant base. Strengths: cost of living A+, housing A+, crime B+; Watch: health & safety D, amenities F, commute F.
- Winfield City (rural): math 36% / reading 59% proficiency, ranked #15 of 129 in AL (top 12%) — families likely to look elsewhere, expect single-tenant / working-renter base with shorter leases.
- Market conditions: 50 active listings in the ZIP; 1 units permitted in Marion County in 2024 (0 in 5+ unit buildings).
Forward outlook
- Local home prices are declining (-3.0%/yr); year-one equity from $658 of loan paydown is wiped out by about $3k of value loss. Plan a longer hold.
- Marion County population projected at -16% by 2050 — secular population decline; favor cash flow + early exit over multi-decade hold.
Negotiation context
- It's been on market 576 days — a 12% lower offer ($84k) is reasonable based on typical stale-listing flexibility.
Risks & watch-outs
- Watch-outs: built in 1945 — expect roof / HVAC / electrical / plumbing capex.
Questions for the listing agent
- It's been on market 576 days. Have you received any prior offers? Is the seller open to a 12% concession, seller financing, or rate buy-down credit?
- Built in 1945 — when were the roof, HVAC, electrical panel, plumbing, and water heater last replaced?
- Why hasn't it sold? Are there any deal-killer items the seller is aware of (foundation, flood, title, zoning, code violations)?
- Is there a deadline driving the sale (1031 exchange, divorce, estate, relocation)? That informs how much negotiation room exists.
- What's the average days-on-market for RENTAL listings here right now (not sales)? A rising rental-DOM trend means longer vacancies and softer asking-rent achievability than the comps imply.
- What's the recent tenant-quality profile in this submarket — average credit score on applications, eviction rate, late-payment / NSF rate, and stable-employment percentage? A property-management company in the area should have these aggregated.
- How much new for-sale + rental construction is in the pipeline within 1–3 miles? Heavy new supply typically softens prices + rents 12–24 months out; constrained supply supports both.
Investment metrics
- 1% rule
- 1.12% ✓
- Cap rate
- 8.62%
- Cash-on-cash
- 8.30%
- DSCR
- 1.37
- GRM
- 7.4
CMA / ARV
- ARV (median comp)
- $105,414
- List price
- $95,200
- Delta
- -9.69%
- Verdict
- FAIR
- Comps
- 12 within 1.0 mi
Projected returns pro-forma
-3.0% appreciation · 3.0% rent growth · sell at horizon
- IRR
- -3.7%
- Equity multiple
- 0.86×
- Total profit
- $-3,661
- Equity at exit
- $14,195
- IRR
- 6.0%
- Equity multiple
- 1.45×
- Total profit
- $12,007
- Equity at exit
- $8,231
Cash invested: $26,656 (down + closing). Projections, not guarantees.
Landlord ↔ Tenant lean methodology
- Overall (STATE)
- 90 Strongly Landlord-Friendly
- State Alabama
- 90 Strongly Landlord-Friendly · R+15
- County
- — inherits STATE
- City
- — inherits STATE
ZIP-level market 35594
- Home prices YoY
- -12.8%
- Active inventory
- 50
- Price-to-rent
- 7.4×
Monthly cashflow live
- Estimated rent
- $1,066 medium interval (Pro) →
- Mortgage (P&I)
- −$499
- Tax est. 1.5%
- −$119 /mo · $1,428/yr
- Insurance
- −$40
- HOA
- −$0
- Vacancy / Maint / Mgmt
- −$224
- Net cashflow
- $184
Break-even live
UW: 25.0% down · 7.5% · 30yr · 1.5% tax · 5.0% vac · 8.0% maint · 8.0% mgmt
Financing live
Cash to close
- Down payment
- $23,800
- Closing costs
- $2,856
- Reserves months
- —
- Total cash needed
- —
Loan-product check · same deal, 3 products live
Conventional
25% down · 7.5% · 30yr
- Down + closing
- —
- Monthly P&I
- —
- Monthly cashflow
- —
- DSCR
- —
- Eligible?
- —
Personal DTI + credit; lowest rate.
DSCR
20% down · 8.5% · 30yr
- Down + closing
- —
- Monthly P&I
- —
- Monthly cashflow
- —
- DSCR
- —
- Eligible?
- —
No personal income docs; deal must DSCR.
Hard money
10% down · 12.0% · 12mo
- Down + closing
- —
- Monthly P&I
- —
- Monthly cashflow
- —
- DSCR
- —
- Eligible?
- —
Short-term bridge; refi at stabilization.
Listing history 19 events
-
2026-06-19days on market $95,200 Active 576 DOM
-
2026-06-18days on market $95,200 Active 575 DOM
-
2026-06-17days on market $95,200 Active 574 DOM
-
2026-06-16days on market $95,200 Active 573 DOM
-
2026-06-15days on market $95,200 Active 572 DOM
-
2026-06-14days on market $95,200 Active 570 DOM
-
2026-06-12days on market $95,200 Active 569 DOM
-
2026-06-09days on market $95,200 Active 566 DOM
-
2026-06-08days on market $95,200 Active 565 DOM
-
2026-06-07days on market $95,200 Active 564 DOM
-
2026-06-07days on market $95,200 Active 563 DOM
-
2026-06-04days on market $95,200 Active 560 DOM
-
2026-06-02days on market $95,200 Active 559 DOM
-
2026-06-01days on market $95,200 Active 558 DOM
-
2026-05-31days on market $95,200 Active 557 DOM
-
2026-05-31days on market $95,200 Active 556 DOM
-
2026-03-19price $95,200 119-char remark
Show marketing remark (119 chars)
Perfect fixer upper opportunity. Two bedrooms, one bathroom house in Winfield, AL. Full of potential on big corner lot.
-
2025-06-13price $102,000 119-char remark
Show marketing remark (119 chars)
Perfect fixer upper opportunity. Two bedrooms, one bathroom house in Winfield, AL. Full of potential on big corner lot.
-
2024-11-20$119,000 Active 119-char remark
Show marketing remark (119 chars)
Perfect fixer upper opportunity. Two bedrooms, one bathroom house in Winfield, AL. Full of potential on big corner lot.
ⓘ Source: listings_history table (triggers on properties + properties_extension) + one-shot
backfill from property_details.listing_events for pre-trigger history.
Nearby sold comps map
Loading sold comps map…
Walkable amenities ~0.75 mi
Loading nearby amenities…
Taxation est. · year 1
- Rental income
- $12,796
- − Mortgage interest
- −$5,333
- − Property taxes
- −$1,428
- − Insurance
- −$476
- − Repairs & maintenance
- −$1,024
- − Management
- −$1,024
- − Depreciation
- −$2,769
- Taxable income
- $742
- Est. tax owed @ 24.0%
- −$178
- After-tax cash flow
- $2,036/yr
For passive investors: Depreciation is non-cash, so a rental often shows a tax loss while cash-flowing — sheltering income. Rental losses are passive: they offset passive income freely, and up to $25,000/yr can offset ordinary (W-2) income if you actively participate and your MAGI is under $100k (phasing out to $0 by $150k); unused losses carry forward. On sale, claimed depreciation is recaptured at up to 25%, and gains may owe capital-gains tax (a 1031 exchange can defer both). Figures are a year-1 estimate at your 24.0% rate — not tax advice; consult a CPA.
Condition & rehab AI · 11 photos
This home presents as a moderate renovation opportunity with average condition. It has potential for significant value increase through kitchen and bathroom renovations.
Repairs flagged
- Moderate kitchen cabinets — dated and in need of updating
- Moderate bathroom fixtures — dated and in need of updating
- Minor HVAC units — existing units, no visible damage
Value-add opportunities
- Both kitchen renovation — modernizing the kitchen would increase both resale and rental value
- Both bathroom renovation — modernizing the bathroom would increase both resale and rental value
- Both HVAC upgrade — upgrading the HVAC system would improve comfort and energy efficiency, increasing both resale and rental value
Renovation cost estimate screening
| Repair item | Severity | Est. cost |
|---|---|---|
| kitchen cabinets · dated and in need of updating | Moderate | $3,000–15,000 |
| bathroom fixtures · dated and in need of updating | Moderate | $3,000–15,000 |
| HVAC units · existing units, no visible damage | Minor | $500–3,000 |
| Total estimated repair cost · 3 items | $6,500–33,000 |
Value-add ROI direction
- Both kitchen renovation — modernizing the kitchen would increase both resale and rental value ↑
- Both bathroom renovation — modernizing the bathroom would increase both resale and rental value ↑
- Both HVAC upgrade — upgrading the HVAC system would improve comfort and energy efficiency, increasing both resale and rental value ↑
ⓘ Cost ranges are severity-bucket heuristics (US national rule-of-thumb). Get contractor quotes + a written scope before underwriting a rehab budget.
Schools (NCES district)
- District
- Winfield City
- NCES district ID
- 0103540
- Math proficiency
- 36% ▼ -22.00%
- Reading proficiency
- 59% ▲ 6.00%
- Median HH income
- $39,006
- Composite
- 39.57/100
- National rank
- #3930
- State rank
- #15 of 129 in AL
Livability — Winfield
- Score
- 67/100
- State rank
- #84
- US rank
- #10852
Category grades
Schools grade is shown separately in the Schools card above.
Census & demographics
- Census place
- Winfield, AL
- City population
- 7,441
- Population (ZIP)
- 7,441
Population outlook (Marion County) Hauer SSP2
- Today (2025)
- 28,759 people
- By 2030
- 27,834 · -3.2%
- By 2040
- 25,974 · -9.7%
- By 2050
- 24,129 · -16.1%
- By 2075
- 20,179 · -29.8%
- By 2100
- 16,341 · -43.2%
Race, ethnicity, and origin ACS 2023
- Neighborhood character
- Predominantly White (94%)
- Race & ethnicity
- White 94% Black 3% Asian 1%
- Common ancestry
- Slovak 6% Lithuanian 5% Serbian 1%
- Foreign-born
- 1% · Canada, South Korea
- Languages at home
- 99% English-only · Spanish 1%
Political lean MEDSL · Marion
- 2024 margin
- Solid R (+81.7) · D 8.8% · R 90.5%
- 2008→2024 swing
- -25.6pp toward R · 2008: -56.1pp · 2024: -81.7pp
- All cycles
- 2024: R+81.7 2020: R+77.8 2016: R+76.2 2012: R+61.5 2008: R+56.1
Not yet ingested
- Civics
- —
Market trends
- HPI YoY
- ▼ -23.46%
- Current HPI
- 159.533
- Rent YoY
- —
- Metro
- —
- State GDP YoY
- ▲ 2.94%
- F500 in state
- 4
Industry mix (Fortune 500 HQ in AL)
| Industry | F500 HQs | Revenue |
|---|---|---|
| Financial Services | 1 | $8B |
|
||
| Healthcare | 1 | $5B |
|
||
Price history
-20.0% since first listed3 events — show timeline
- 2026-03-19 Price Changed $95,200 WAMLS
- 2025-06-13 Price Changed $102,000 WAMLS
- 2024-11-20 Listed $119,000 WAMLS
Cash-flow waterfall
monthlySold comps — $/sqft
last 12 mo · ≤1 miLoading sold comps…