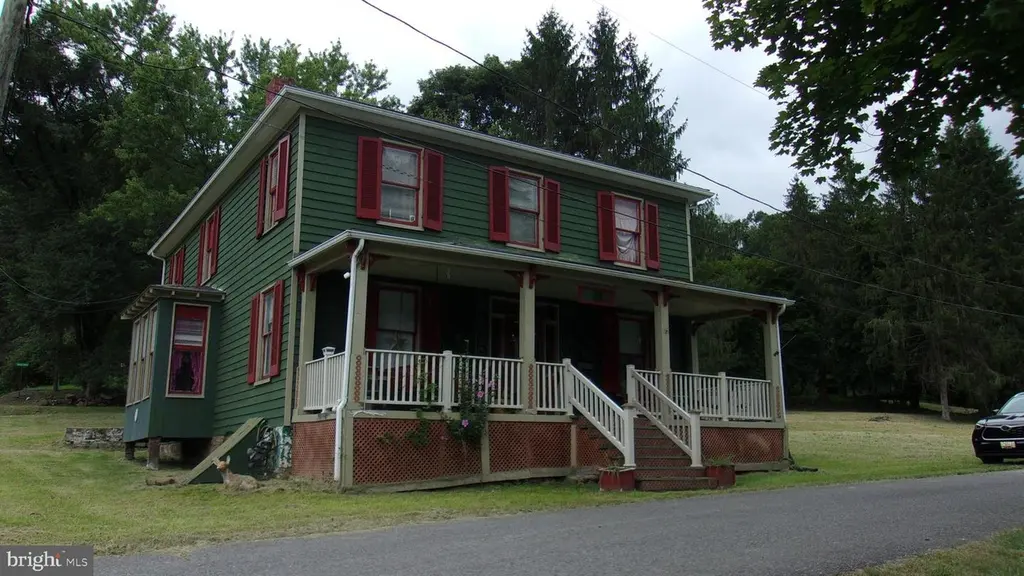
108 Knight St · Bloomington, MD
Flood risk 1/10 · Minimal
- FEMA flood zone
- X (unshaded)
- Chance of flooding over 30 yrs
- 0.0%
- Est. flood insurance / yr
- $507 – $1,088
Fire risk 2/10 · Minimal
- Est. fire insurance / yr
- $755 – $1,403
Heat risk 5/10 · Moderate
- Hot days now (above 90°F)
- 8 days/yr
- Hot days in 30 yrs
- 21 days/yr
Wind risk 2/10 · Minimal
- Chance of severe wind over 30 yrs
- —
Air-quality risk 1/10 · Minimal
- Unhealthy air days now
- 0 days/yr
- Unhealthy air days in 30 yrs
- 0 days/yr
Risk factors via First Street. Map © Google.
Why this score? — see what drove the A- grade
The composite is a weighted blend of 9 inputs, each scored 0–100. Each bar is that input's sub-score; the figure is the points it added to the 100-point composite (weight × sub-score).
- Cash flow +30.0/30.0
- ARV discount +15.0/15.0
- 1% rule +10.0/10.0
- DSCR +10.0/10.0
- Appreciation +6.9/10.0
- Livability +2.9/5.0
- Rent growth +2.5/5.0
- Condition / age +2.5/5.0
- Schools +2.0/10.0
$70,000
🖨 Deal sheet 📄 Offer letter ✓ Due diligence
Listing remarks MLS
THIS LARGE HOME IS ALMOST 3000 SQ FT!! IT IS IN NEED OF REPAIRS - GREAT CHARACTER - A LOT OF ORGINIAL WOODWORK - THE MAIN LEVEL HAS MANY RMS TO MAKE IT INTO WHATEVER YOU NEED * * * THE CONTENTS IN THE HOME DO NOT CONVEY * * *
Key facts
- Main level
- Original woodwork
- 9,147 sq ft lot
Tags
Neighborhood map
What this means for you Summary
Snapshot
- This is a 4-bed/1.0-bath single-family listed at $70k.
Deal economics
- At list price, monthly cash flow is $614 ($7k/yr) — positive.
- The deal already cash-flows at list — no discount required.
- Meets the 1% rule at list price ($1k rent vs $70k).
- Recommended offer: $62k (12.0% below list) — sets the bar for market timing.
Location & tenants
- Location reads 57/100 on livability (#402 in MD) — a working-class tenant base; expect higher turnover. Strengths: cost of living A+, housing A+, crime A; Watch: schools F, amenities F, commute F.
- Garrett County Public Schools (rural): math 17% / reading 30% proficiency, ranked #16 of 24 in MD (top 67%) — low school quality limits family demand, transient renter base, plan for 1-2y turnover.
- Market conditions: 3 active listings in the ZIP; 122 units permitted in Garrett County in 2024 (0 in 5+ unit buildings).
Forward outlook
- In year one you build about $3k of equity ($484 loan paydown + $3k appreciation (3.7% local appreciation)).
- Garrett County population projected at -23% by 2050 — secular population decline; favor cash flow + early exit over multi-decade hold.
- At projected returns (3.7% appreciation + 3.0% rent growth), your $20k cash investment doubles in ~2 years — after that, you're playing with house money.
- By year 10, paydown + projected appreciation supports a ~$30k cash-out refi (75% LTV) — recoverable capital for the next deal without selling this one.
Negotiation context
- It's been on market 289 days — a 12% lower offer ($62k) is reasonable based on typical stale-listing flexibility.
- 4 sale attempts since 16y ago with the ask held roughly flat each time — persistent listings suggest the price (not the market) is what's stuck; bring a comps-based counter.
- Current owner paid $50k; 40% above their basis — modest negotiation headroom, anchor on the comps not their cost.
Risks & watch-outs
- Watch-outs: built in 1935 — expect roof / HVAC / electrical / plumbing capex.
- Climate carrying-cost: extreme-heat days projected 8→21/yr by 2055 (HVAC capex compounding) — expect insurance premiums to compound above CPI over the hold.
Questions for the listing agent
- It's been on market 289 days. Have you received any prior offers? Is the seller open to a 12% concession, seller financing, or rate buy-down credit?
- Built in 1935 — when were the roof, HVAC, electrical panel, plumbing, and water heater last replaced?
- Why hasn't it sold? Are there any deal-killer items the seller is aware of (foundation, flood, title, zoning, code violations)?
- Is there a deadline driving the sale (1031 exchange, divorce, estate, relocation)? That informs how much negotiation room exists.
- Schools are F-rated, which usually means shorter tenancies and higher turnover. Who's the typical renter profile here, and what's been the actual vacancy rate?
- What's the average days-on-market for RENTAL listings here right now (not sales)? A rising rental-DOM trend means longer vacancies and softer asking-rent achievability than the comps imply.
- What's the recent tenant-quality profile in this submarket — average credit score on applications, eviction rate, late-payment / NSF rate, and stable-employment percentage? A property-management company in the area should have these aggregated.
- How much new for-sale + rental construction is in the pipeline within 1–3 miles? Heavy new supply typically softens prices + rents 12–24 months out; constrained supply supports both.
Investment metrics
- 1% rule
- 1.92% ✓
- Cap rate
- 16.82%
- Cash-on-cash
- 37.60%
- DSCR
- 2.67
- GRM
- 4.3
CMA / ARV
- ARV (median comp)
- $111,164
- List price
- $70,000
- Delta
- -37.03%
- Verdict
- UNDERPRICED
- Comps
- 5 within 2.0 mi
Projected returns pro-forma
3.74% appreciation · 3.0% rent growth · sell at horizon
- IRR
- 44.3%
- Equity multiple
- 3.57×
- Total profit
- $50,329
- Equity at exit
- $34,431
- IRR
- 43.4%
- Equity multiple
- 7.17×
- Total profit
- $121,019
- Equity at exit
- $55,486
Cash invested: $19,600 (down + closing). Projections, not guarantees.
Landlord ↔ Tenant lean methodology
- Overall (STATE)
- 27 Tenant-Leaning
- State Maryland
- 27 Tenant-Leaning · D+14
- County
- — inherits STATE
- City
- — inherits STATE
ZIP-level market 21523
- Home prices YoY
- 3.9%
- Active inventory
- 3
- Price-to-rent
- 4.3×
Monthly cashflow live
- Estimated rent
- $1,345 medium interval (Pro) →
- Mortgage (P&I)
- −$367
- Tax from tax record
- −$52 /mo · $623/yr
- Insurance
- −$29
- HOA
- −$0
- Vacancy / Maint / Mgmt
- −$282
- Net cashflow
- $614
Break-even live
UW: 25.0% down · 7.5% · 30yr · 1.5% tax · 5.0% vac · 8.0% maint · 8.0% mgmt
Financing live
Cash to close
- Down payment
- $17,500
- Closing costs
- $2,100
- Reserves months
- —
- Total cash needed
- —
Loan-product check · same deal, 3 products live
Conventional
25% down · 7.5% · 30yr
- Down + closing
- —
- Monthly P&I
- —
- Monthly cashflow
- —
- DSCR
- —
- Eligible?
- —
Personal DTI + credit; lowest rate.
DSCR
20% down · 8.5% · 30yr
- Down + closing
- —
- Monthly P&I
- —
- Monthly cashflow
- —
- DSCR
- —
- Eligible?
- —
No personal income docs; deal must DSCR.
Hard money
10% down · 12.0% · 12mo
- Down + closing
- —
- Monthly P&I
- —
- Monthly cashflow
- —
- DSCR
- —
- Eligible?
- —
Short-term bridge; refi at stabilization.
Listing history 26 events
-
2026-06-18days on market $70,000 Active 289 DOM
-
2026-06-17days on market $70,000 Active 288 DOM
-
2026-06-16days on market $70,000 Active 287 DOM
-
2026-06-15days on market $70,000 Active 286 DOM
-
2026-06-13days on market $70,000 Active 284 DOM
-
2026-06-12days on market $70,000 Active 283 DOM
-
2026-06-09days on market $70,000 Active 280 DOM
-
2026-06-08days on market $70,000 Active 279 DOM
-
2026-06-07days on market $70,000 Active 278 DOM
-
2026-06-07days on market $70,000 Active 277 DOM
-
2026-06-04days on market $70,000 Active 274 DOM
-
2026-06-02days on market $70,000 Active 273 DOM
-
2026-06-01days on market $70,000 Active 272 DOM
-
2026-05-31days on market $70,000 Active 271 DOM
-
2026-05-31days on market $70,000 Active 270 DOM
-
2025-09-02$70,000 Active 230-char remark
Show marketing remark (230 chars)
THIS LARGE HOME IS ALMOST 3000 SQ FT!! IT IS IN NEED OF REPAIRS - GREAT CHARACTER - A LOT OF ORGINIAL WOODWORK - THE MAIN LEVEL HAS MANY RMS TO MAKE IT INTO WHATEVER YOU NEED * * * THE CONTENTS IN THE HOME DO NOT CONVEY * * *
-
2021-08-06soldstatus $49,900 Closed 369-char remark
Show marketing remark (369 chars)
HISTORY AND CHARM ABOUND IN THIS UNIQUE COUNTRY HOME - HOME CAN HAVE 5-7 BDRMS - 2906+/- SQ FT - SOME FINISHING WORK NEEDS DONE BUT OH THE CHARACTER THIS HOME HAS - SITTING ON A CORNER LOT AND LOCATED ONLY A HALF MILE FROM SAVAGE RIVER - NEARBY JENNINGS RANDOLPH LAKE - ONLY ABOUT 20 MINUTES TO DEEP CREEK LAKE AND WISP SKI RESORT - EXCELLENT SUMMER HOME OR GET-A-WAY
-
2021-07-27status Pending 369-char remark
Show marketing remark (369 chars)
HISTORY AND CHARM ABOUND IN THIS UNIQUE COUNTRY HOME - HOME CAN HAVE 5-7 BDRMS - 2906+/- SQ FT - SOME FINISHING WORK NEEDS DONE BUT OH THE CHARACTER THIS HOME HAS - SITTING ON A CORNER LOT AND LOCATED ONLY A HALF MILE FROM SAVAGE RIVER - NEARBY JENNINGS RANDOLPH LAKE - ONLY ABOUT 20 MINUTES TO DEEP CREEK LAKE AND WISP SKI RESORT - EXCELLENT SUMMER HOME OR GET-A-WAY
-
2021-07-23$49,900 Active 369-char remark
Show marketing remark (369 chars)
HISTORY AND CHARM ABOUND IN THIS UNIQUE COUNTRY HOME - HOME CAN HAVE 5-7 BDRMS - 2906+/- SQ FT - SOME FINISHING WORK NEEDS DONE BUT OH THE CHARACTER THIS HOME HAS - SITTING ON A CORNER LOT AND LOCATED ONLY A HALF MILE FROM SAVAGE RIVER - NEARBY JENNINGS RANDOLPH LAKE - ONLY ABOUT 20 MINUTES TO DEEP CREEK LAKE AND WISP SKI RESORT - EXCELLENT SUMMER HOME OR GET-A-WAY
-
2011-01-03soldstatus $11,025 Sold
-
2011-01-03soldstatus $11,025
-
2010-12-10status Contingent (No Kick Out)
-
2010-12-09historical
-
2010-11-23$7,900 Active
-
2010-11-23$7,900
-
2007-07-03soldstatus $65,000
ⓘ Source: listings_history table (triggers on properties + properties_extension) + one-shot
backfill from property_details.listing_events for pre-trigger history.
Tax reassessment forecast MD · Partial reset (capped growth)
- Current annual tax
- $623 · $52/mo
- Projected year-2 tax
- $693 · $58/mo
- Expected delta
- +$70/yr (+$6/mo · 11.3%)
ⓘ Screening estimate from a state-policy table — verify with the county assessor before closing.
Climate risk First Street
- Flood 1/10 Low FEMA zone X (unshaded) · 0% chance over 30 yrs
- Wildfire 2/10 Low
- Heat 5/10 Major 8 d/yr ≥90°F today · 21 d/yr by 30 yrs out
- Wind 2/10 Low
- Air quality 1/10 Low 0 unhealthy d/yr today · 0 by 30 yrs out
Nearby sold comps map
Loading sold comps map…
Walkable amenities ~0.75 mi
Loading nearby amenities…
Taxation est. · year 1
- Rental income
- $16,137
- − Mortgage interest
- −$3,921
- − Property taxes
- −$623
- − Insurance
- −$350
- − Repairs & maintenance
- −$1,291
- − Management
- −$1,291
- − Depreciation
- −$2,036
- Taxable income
- $6,625
- Est. tax owed @ 24.0%
- −$1,590
- After-tax cash flow
- $5,780/yr
For passive investors: Depreciation is non-cash, so a rental often shows a tax loss while cash-flowing — sheltering income. Rental losses are passive: they offset passive income freely, and up to $25,000/yr can offset ordinary (W-2) income if you actively participate and your MAGI is under $100k (phasing out to $0 by $150k); unused losses carry forward. On sale, claimed depreciation is recaptured at up to 25%, and gains may owe capital-gains tax (a 1031 exchange can defer both). Figures are a year-1 estimate at your 24.0% rate — not tax advice; consult a CPA.
Schools (NCES district)
- District
- Garrett County Public Schools
- NCES district ID
- 2400360
- Math proficiency
- 17% ▼ -16.00%
- Reading proficiency
- 30% ▼ -13.00%
- Median HH income
- $45,705
- Composite
- 20.36/100
- National rank
- #8600
- State rank
- #16 of 24 in MD
Livability — Bloomington
- Score
- 57/100
- State rank
- #402
- US rank
- #22227
Category grades
Schools grade is shown separately in the Schools card above.
Census & demographics
- Census place
- Bloomington, MD
- City population
- 165
- Population (ZIP)
- 165
Population outlook (Garrett County) Hauer SSP2
- Today (2025)
- 28,304 people
- By 2030
- 27,248 · -3.7%
- By 2040
- 24,596 · -13.1%
- By 2050
- 21,703 · -23.3%
- By 2075
- 15,766 · -44.3%
- By 2100
- 11,363 · -59.9%
Race, ethnicity, and origin ACS 2023
- Neighborhood character
- Predominantly White (81%)
- Race & ethnicity
- White 81% Asian 11% Two or more races 8%
- Common ancestry
- Romanian 5%
- Foreign-born
- 11% · Philippines
- Languages at home
- 89% English-only · Other Asian/Pacific 11%
Political lean MEDSL · Garrett
- 2024 margin
- Solid R (+54.0) · D 21.9% · R 75.9% · Other 2.2%
- 2008→2024 swing
- -13.9pp toward R · 2008: -40.1pp · 2024: -54.0pp
- All cycles
- 2024: R+54.0 2020: R+55.9 2016: R+61.5 2012: R+52.1 2008: R+40.1
Not yet ingested
- Civics
- —
Market trends
- HPI YoY
- ▲ 3.74%
- Current HPI
- 99.7146
- Rent YoY
- —
- Metro
- —
- State GDP YoY
- ▲ 2.97%
- F500 in state
- 12
Industry mix (Fortune 500 HQ in MD)
| Industry | F500 HQs | Revenue |
|---|---|---|
| Aerospace / Defense | 1 | $71B |
|
||
| Utilities | 1 | $25B |
|
||
| Hotels | 1 | $24B |
|
||
| Consumer Goods | 1 | $7B |
|
||
| Real Estate | 1 | $6B |
|
||
| Chemicals | 1 | $2B |
|
||
Price history
+7.7% since first listed11 events — show timeline
- 2025-09-02 Listed $70,000 BRIGHT MLS
- 2021-08-06 Sold (MLS) $49,900 BRIGHT MLS
- 2021-07-27 Pending — BRIGHT MLS
- 2021-07-23 Listed $49,900 BRIGHT MLS
- 2011-01-03 Sold (MLS) $11,025 BRIGHT MLS
- 2011-01-03 Sold (MLS) $11,025 MRIS
- 2010-12-10 Pending — MRIS
- 2010-12-09 Listing Removed — BRIGHT MLS
- 2010-11-23 Listed $7,900 MRIS
- 2010-11-23 Listed $7,900 BRIGHT MLS
- 2007-07-03 Sold (Public Records) $65,000 Public Records
Property tax history
+1.6%/yrLatest (2024): $623 · +6.7% YoY. Source: county tax records.
Cash-flow waterfall
monthlySold comps — $/sqft
last 12 mo · ≤1 miLoading sold comps…