 Multi-family
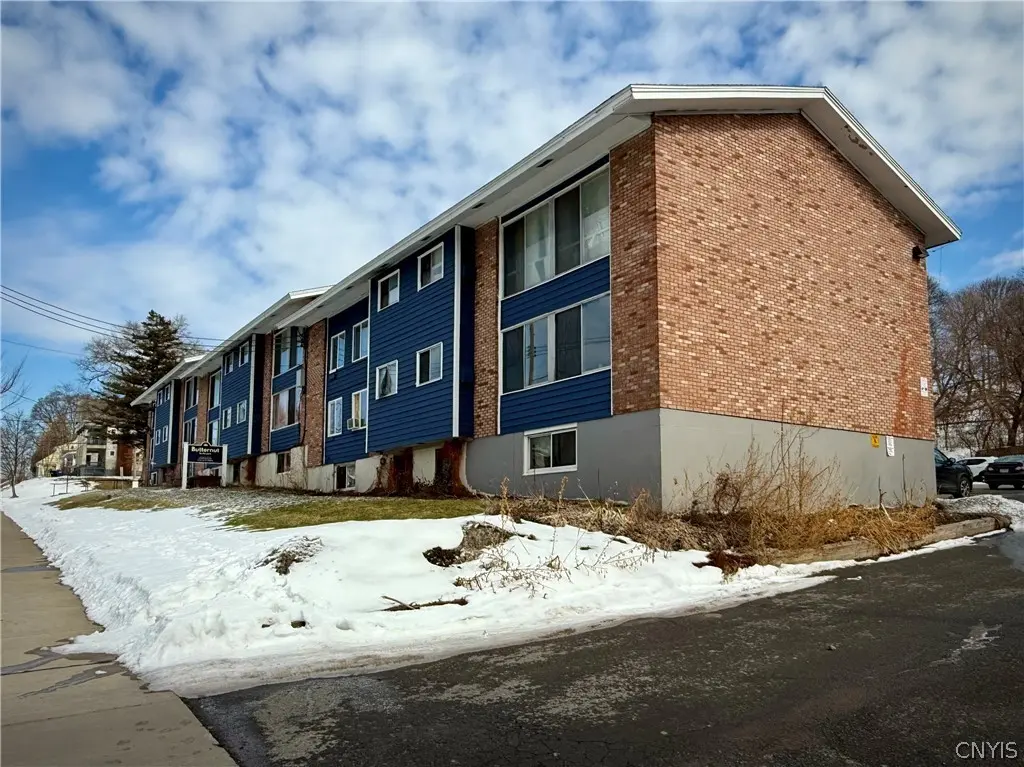
1312 Butternut St #20 · Syracuse, NY
Flood risk 1/10 · Minimal
- FEMA flood zone
- X (unshaded)
- Chance of flooding over 30 yrs
- 0.0%
- Est. flood insurance / yr
- $507 – $1,088
Fire risk 1/10 · Minimal
- Est. fire insurance / yr
- $691 – $1,283
Heat risk 3/10 · Minor
- Hot days now (above 95°F)
- 7 days/yr
- Hot days in 30 yrs
- 15 days/yr
Wind risk 1/10 · Minimal
- Chance of severe wind over 30 yrs
- 0.0%
Air-quality risk 2/10 · Minimal
- Unhealthy air days now
- 0 days/yr
- Unhealthy air days in 30 yrs
- 1 days/yr
Risk factors via First Street. Map © Google.
Why this score? — see what drove the B+ grade
The composite is a weighted blend of 9 inputs, each scored 0–100. Each bar is that input's sub-score; the figure is the points it added to the 100-point composite (weight × sub-score).
- Cash flow +30.0/30.0
- 1% rule +10.0/10.0
- DSCR +10.0/10.0
- Appreciation +10.0/10.0
- ARV discount +7.5/15.0
- Livability +3.9/5.0
- Rent growth +2.5/5.0
- Condition / age +2.5/5.0
- Schools +1.8/10.0
$3,645,000
🖨 Deal sheet 📄 Offer letter ✓ Due diligence
Multi-family units
County records classify this as Multi-Family (5+ Unit). Listing-text estimate: 1 unit. estimate disagrees with records
5+ unit building — per-unit beds/baths from public records are typically unavailable; the breakdown below (if shown) is an estimate from the listing text.
Listing remarks MLS
Available for sale is the newly-renovated and stabilized Butternut by the Park complex! Centrally located in the city of Syracuse, these buildings with 48 units benefit from strong rental demand, easy access to public transportation, a well-established neighborhood, and immediate proximity to Schiller Park. Plenty of parking, bright and airy units, refreshed wood floors and many updated kitchens and baths are offered to tenants at attractive prices, though there remains room for improvement. Benefit from Syracuse's growth and increased need for workforce housing with this well-established and reliable complex.
Key facts
- 1.8 acre lot
- Parking
- Built 1960
Neighborhood map
What this means for you Summary
Snapshot
- This is a 45-bed/?-bath multifamily listed at $3.65M.
Deal economics
- At list price, monthly cash flow is $22k ($260k/yr) — positive.
- The deal already cash-flows at list — no discount required.
- Meets the 1% rule at list price ($56k rent vs $3.65M).
- Recommended offer: $3.43M (6.0% below list) — sets the bar for market timing.
- Cap rate 13.4% vs local median 8.2% in Syracuse — top-decile yield for the area; either an underpriced asset or a hidden risk that comps aren't pricing in. Stress-test before assuming the spread holds.
Location & tenants
- Location reads 77/100 on livability (#187 in NY, #2,869 nationally) — a middle-class / working-renter tenant base. Strengths: amenities A+, commute A+, cost of living A+; Watch: schools D+, crime F, employment D-.
- Syracuse City School District (urban): math 18% / reading 26% proficiency, ranked #590 of 590 in NY (top 100%) — low school quality limits family demand, transient renter base, plan for 1-2y turnover; 74% free/reduced lunch — lower-income household profile, screen leases tightly.
- Market conditions: 99 active listings in the ZIP; lower-income renter base — watch delinquency; 616 units permitted in Onondaga County in 2024 (256 in 5+ unit buildings).
- At $56,340/mo this rent would consume 1512% of the median local household income ($45k/yr) (locally 1437% of renters already pay >50% of income on rent) — very limited rent-growth headroom before tenants either downsize or default.
Forward outlook
- In year one you build about $390k of equity ($25k loan paydown + $364k appreciation (10.0% local appreciation)).
- Onondaga County population projected to shrink 9% by 2050 — rents likely to lag national; underwrite the cash flow, not the appreciation.
- At projected returns (10.0% appreciation + 3.0% rent growth), your $1.02M cash investment doubles in ~2 years — after that, you're playing with house money.
- By year 2, paydown + projected appreciation supports a ~$626k cash-out refi (75% LTV) — recoverable capital for the next deal without selling this one.
Negotiation context
- It's been on market 80 days — a 6% lower offer ($3.43M) is reasonable based on typical stale-listing flexibility.
- Current owner paid $2.25M; list at $3.65M implies a 62% gain — meaningful room to come down on a strong offer.
Questions for the listing agent
- It's been on market 80 days. Have you received any prior offers? Is the seller open to a 6% concession, seller financing, or rate buy-down credit?
- Built in 1960 — when were the roof, HVAC, electrical panel, plumbing, and water heater last replaced?
- Why hasn't it sold? Are there any deal-killer items the seller is aware of (foundation, flood, title, zoning, code violations)?
- Is there a deadline driving the sale (1031 exchange, divorce, estate, relocation)? That informs how much negotiation room exists.
- Schools are D-rated, which usually means shorter tenancies and higher turnover. Who's the typical renter profile here, and what's been the actual vacancy rate?
- Crime grade is F in this area — have there been break-ins, vandalism, or insurance claims at this property in the last 3 years? What carrier currently insures it and at what premium?
- What's the average days-on-market for RENTAL listings here right now (not sales)? A rising rental-DOM trend means longer vacancies and softer asking-rent achievability than the comps imply.
- What's the recent tenant-quality profile in this submarket — average credit score on applications, eviction rate, late-payment / NSF rate, and stable-employment percentage? A property-management company in the area should have these aggregated.
- How much new apartment / multifamily construction is in the pipeline within 1–3 miles? Heavy new supply (>2% of stock underway) typically softens rents 12–24 months out; light construction supports rent growth.
Investment metrics
- 1% rule
- 1.55% ✓
- Cap rate
- 13.44%
- Cash-on-cash
- 25.52%
- DSCR
- 2.14
- GRM
- 5.4
CMA / ARV
No comps found within radius.
Projected returns pro-forma
10.0% appreciation · 3.0% rent growth · sell at horizon
- IRR
- 43.5%
- Equity multiple
- 4.30×
- Total profit
- $3,366,759
- Equity at exit
- $3,283,705
- IRR
- 37.6%
- Equity multiple
- 9.65×
- Total profit
- $8,826,367
- Equity at exit
- $7,081,433
Cash invested: $1,020,600 (down + closing). Projections, not guarantees.
Landlord ↔ Tenant lean methodology
- Overall (STATE)
- 15 Strongly Tenant-Friendly
- State New York
- 15 Strongly Tenant-Friendly · D+10
- County
- — inherits STATE
- City
- — inherits STATE
ZIP-level market 13208
- Home prices YoY
- 8.4%
- Active inventory
- 99
- Price-to-rent
- 258.8×
Monthly cashflow live
- Estimated rent
- $56,340 medium interval (Pro) →
- Mortgage (P&I)
- −$19,115
- Tax from tax record
- −$2,173 /mo · $26,077/yr
- Insurance
- −$1,519
- HOA
- −$0
- Vacancy / Maint / Mgmt
- −$11,831
- Net cashflow
- $21,702
Break-even live
48-unit breakdown (identical units grouped — click to expand)
| Units | Beds | Baths | Est. rent |
|---|---|---|---|
| 48× units | 2 | 1 | $56,352 |
| #1 | 2 | 1 | $1,174 |
| #2 | 2 | 1 | $1,174 |
| #3 | 2 | 1 | $1,174 |
| #4 | 2 | 1 | $1,174 |
| #5 | 2 | 1 | $1,174 |
| #6 | 2 | 1 | $1,174 |
| #7 | 2 | 1 | $1,174 |
| #8 | 2 | 1 | $1,174 |
| #9 | 2 | 1 | $1,174 |
| #10 | 2 | 1 | $1,174 |
| #11 | 2 | 1 | $1,174 |
| #12 | 2 | 1 | $1,174 |
| #13 | 2 | 1 | $1,174 |
| #14 | 2 | 1 | $1,174 |
| #15 | 2 | 1 | $1,174 |
| #16 | 2 | 1 | $1,174 |
| #17 | 2 | 1 | $1,174 |
| #18 | 2 | 1 | $1,174 |
| #19 | 2 | 1 | $1,174 |
| #20 | 2 | 1 | $1,174 |
| #21 | 2 | 1 | $1,174 |
| #22 | 2 | 1 | $1,174 |
| #23 | 2 | 1 | $1,174 |
| #24 | 2 | 1 | $1,174 |
| #25 | 2 | 1 | $1,174 |
| #26 | 2 | 1 | $1,174 |
| #27 | 2 | 1 | $1,174 |
| #28 | 2 | 1 | $1,174 |
| #29 | 2 | 1 | $1,174 |
| #30 | 2 | 1 | $1,174 |
| #31 | 2 | 1 | $1,174 |
| #32 | 2 | 1 | $1,174 |
| #33 | 2 | 1 | $1,174 |
| #34 | 2 | 1 | $1,174 |
| #35 | 2 | 1 | $1,174 |
| #36 | 2 | 1 | $1,174 |
| #37 | 2 | 1 | $1,174 |
| #38 | 2 | 1 | $1,174 |
| #39 | 2 | 1 | $1,174 |
| #40 | 2 | 1 | $1,174 |
| #41 | 2 | 1 | $1,174 |
| #42 | 2 | 1 | $1,174 |
| #43 | 2 | 1 | $1,174 |
| #44 | 2 | 1 | $1,174 |
| #45 | 2 | 1 | $1,174 |
| #46 | 2 | 1 | $1,174 |
| #47 | 2 | 1 | $1,174 |
| #48 | 2 | 1 | $1,174 |
| Total (48 units) | $56,340 | ||
UW: 25.0% down · 7.5% · 30yr · 1.5% tax · 5.0% vac · 8.0% maint · 8.0% mgmt
Financing live
Cash to close
- Down payment
- $911,250
- Closing costs
- $109,350
- Reserves months
- —
- Total cash needed
- —
Loan-product check · same deal, 3 products live
Conventional
25% down · 7.5% · 30yr
- Down + closing
- —
- Monthly P&I
- —
- Monthly cashflow
- —
- DSCR
- —
- Eligible?
- —
Personal DTI + credit; lowest rate.
DSCR
20% down · 8.5% · 30yr
- Down + closing
- —
- Monthly P&I
- —
- Monthly cashflow
- —
- DSCR
- —
- Eligible?
- —
No personal income docs; deal must DSCR.
Hard money
10% down · 12.0% · 12mo
- Down + closing
- —
- Monthly P&I
- —
- Monthly cashflow
- —
- DSCR
- —
- Eligible?
- —
Short-term bridge; refi at stabilization.
Listing history 19 events
-
2026-06-18days on market $3,645,000 Active 80 DOM
-
2026-06-17days on market $3,645,000 Active 79 DOM
-
2026-06-16days on market $3,645,000 Active 78 DOM
-
2026-06-15days on market $3,645,000 Active 77 DOM
-
2026-06-14days on market $3,645,000 Active 75 DOM
-
2026-06-13days on market $3,645,000 Active 74 DOM
-
2026-06-10days on market $3,645,000 Active 72 DOM
-
2026-06-09days on market $3,645,000 Active 71 DOM
-
2026-06-08days on market $3,645,000 Active 70 DOM
-
2026-06-07days on market $3,645,000 Active 69 DOM
-
2026-06-05days on market $3,645,000 Active 66 DOM
-
2026-06-02days on market $3,645,000 Active 64 DOM
-
2026-06-01days on market $3,645,000 Active 63 DOM
-
2026-05-31days on market $3,645,000 Active 62 DOM
-
2026-05-30days on market $3,645,000 Active 61 DOM
-
2026-03-30$3,645,000 Active 617-char remark
Show marketing remark (617 chars)
Available for sale is the newly-renovated and stabilized Butternut by the Park complex! Centrally located in the city of Syracuse, these buildings with 48 units benefit from strong rental demand, easy access to public transportation, a well-established neighborhood, and immediate proximity to Schiller Park. Plenty of parking, bright and airy units, refreshed wood floors and many updated kitchens and baths are offered to tenants at attractive prices, though there remains room for improvement. Benefit from Syracuse's growth and increased need for workforce housing with this well-established and reliable complex.
-
2024-07-16soldstatus $2,250,000
-
2012-07-27soldstatus $1,008,500
-
2007-05-16soldstatus $825,000
ⓘ Source: listings_history table (triggers on properties + properties_extension) + one-shot
backfill from property_details.listing_events for pre-trigger history.
Tax reassessment forecast NY · Partial reset (capped growth)
- Current annual tax
- $26,077 · $2,173/mo
- Projected year-2 tax
- $43,839 · $3,653/mo
- Expected delta
- +$17,762/yr (+$1,480/mo · 68.1%)
ⓘ Screening estimate from a state-policy table — verify with the county assessor before closing.
Climate risk First Street
- Flood 1/10 Low FEMA zone X (unshaded) · 0% chance over 30 yrs
- Wildfire 1/10 Low
- Heat 3/10 Moderate 7 d/yr ≥95°F today · 15 d/yr by 30 yrs out
- Wind 1/10 Low 0% chance of damaging wind over 30 yrs
- Air quality 2/10 Low 0 unhealthy d/yr today · 1 by 30 yrs out
Nearby sold comps map
Loading sold comps map…
Walkable amenities ~0.75 mi
Loading nearby amenities…
Taxation est. · year 1
- Rental income
- $676,080
- − Mortgage interest
- −$204,177
- − Property taxes
- −$26,077
- − Insurance
- −$18,225
- − Repairs & maintenance
- −$54,086
- − Management
- −$54,086
- − Depreciation
- −$106,036
- Taxable income
- $213,392
- Est. tax owed @ 24.0%
- −$51,214
- After-tax cash flow
- $209,210/yr
For passive investors: Depreciation is non-cash, so a rental often shows a tax loss while cash-flowing — sheltering income. Rental losses are passive: they offset passive income freely, and up to $25,000/yr can offset ordinary (W-2) income if you actively participate and your MAGI is under $100k (phasing out to $0 by $150k); unused losses carry forward. On sale, claimed depreciation is recaptured at up to 25%, and gains may owe capital-gains tax (a 1031 exchange can defer both). Figures are a year-1 estimate at your 24.0% rate — not tax advice; consult a CPA.
Schools (NCES district)
- District
- Syracuse City School District
- NCES district ID
- 3628590
- Math proficiency
- 18% ▼ -5.00%
- Reading proficiency
- 26% ▬ 0.00%
- Median HH income
- $32,097
- Composite
- 17.83/100
- National rank
- #9007
- State rank
- #590 of 590 in NY
Livability — Syracuse
- Score
- 77/100
- State rank
- #187
- US rank
- #2869
Category grades
Schools grade is shown separately in the Schools card above.
Census & demographics
- Census place
- Syracuse, NY
- County
- Onondaga County · 247,257 people
- City population
- 152,627
- Metro
- Syracuse, NY
- Population (ZIP)
- 22,993
- Household income
- $44,712
- Rent vs Own
- Severe rent burden
- 1437.0
Population outlook (Onondaga County) Hauer SSP2
- Today (2025)
- 467,894 people
- By 2030
- 463,381 · -1.0%
- By 2040
- 447,697 · -4.3%
- By 2050
- 426,399 · -8.9%
- By 2075
- 373,661 · -20.1%
- By 2100
- 307,967 · -34.2%
Race, ethnicity, and origin ACS 2023
- Neighborhood character
- Highly diverse neighborhood (Simpson 0.70)
- Race & ethnicity
- White 46% Black 24% Asian 14% Two or more races 10% Hispanic / Latino 6%
- Hispanic origin (detail)
- Puerto Rican 4% Dominican 1%
- Common ancestry
- Romanian 3% Swedish 3% Italian 1%
- Foreign-born
- 22% · Vietnam, Philippines, Canada
- Languages at home
- 70% English-only · Spanish 6% Other Asian/Pacific 5% Vietnamese 4%
Political lean MEDSL · Onondaga
- 2024 margin
- D (+17.3) · D 58.6% · R 41.4%
- 2008→2024 swing
- -3.0pp toward R · 2008: 20.3pp · 2024: 17.3pp
- All cycles
- 2024: D+17.3 2020: D+20.6 2016: D+12.8 2012: D+21.1 2008: D+20.3
Not yet ingested
- Civics
- —
Market trends
- HPI YoY
- ▲ 30.91%
- Current HPI
- 399.3284
- Rent YoY
- —
- Metro
- Syracuse, NY
- State GDP YoY
- ▲ 2.60%
- F500 in state
- 92
Industry mix (Fortune 500 HQ in NY)
| Industry | F500 HQs | Revenue |
|---|---|---|
| Financial Services | 10 | $950B |
|
||
| Consumer Goods | 9 | $162B |
|
||
| Insurance | 4 | $225B |
|
||
| Telecommunications | 2 | $144B |
|
||
| Pharmaceuticals | 2 | $112B |
|
||
| Media / Entertainment | 2 | $69B |
|
||
Price history
+341.8% since first listed4 events — show timeline
- 2026-03-30 Listed $3,645,000 CNYIS
- 2024-07-16 Sold (Public Records) $2,250,000 Public Records
- 2012-07-27 Sold (Public Records) $1,008,500 Public Records
- 2007-05-16 Sold (Public Records) $825,000 Public Records
Property tax history
+0.0%/yrLatest (2025): $26,077 · +0.0% YoY. Source: county tax records.
Cash-flow waterfall
monthlySold comps — $/sqft
last 12 mo · ≤1 miLoading sold comps…