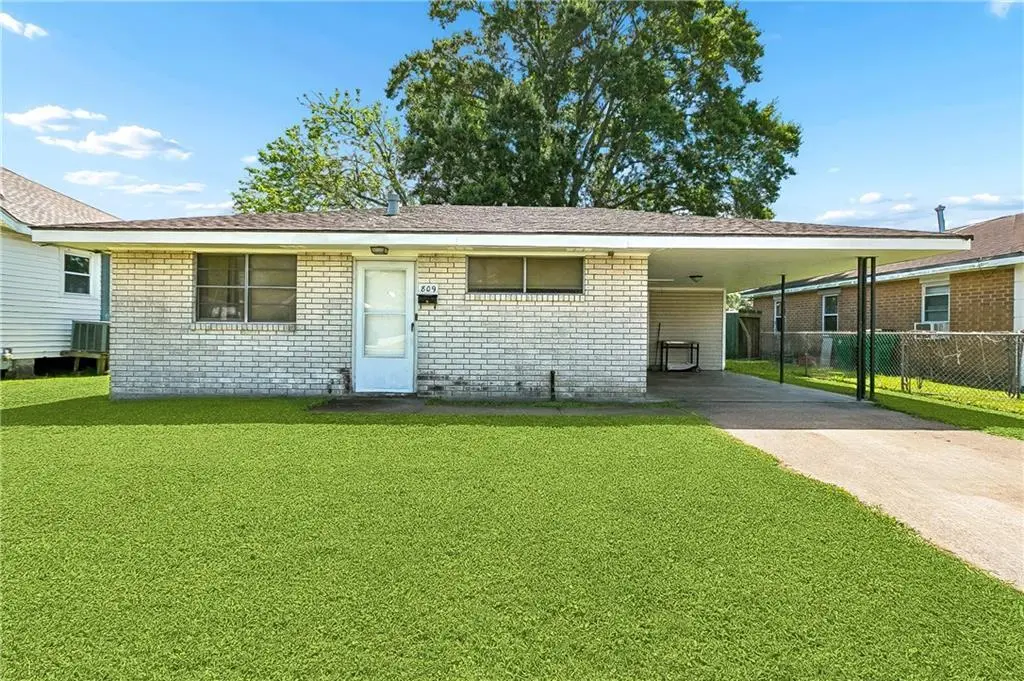
809 West Dr · Westwego, LA
Flood risk No data
- FEMA flood zone
- —
- Chance of flooding over 30 yrs
- —
- Est. flood insurance / yr
- —
Fire risk No data
- Est. fire insurance / yr
- —
Heat risk No data
- Hot days now (above threshold)
- —
- Hot days in 30 yrs
- —
Wind risk No data
- Chance of severe wind over 30 yrs
- —
Air-quality risk No data
- Unhealthy air days now
- —
- Unhealthy air days in 30 yrs
- —
Risk factors via First Street. Map © Google.
Why this score? — see what drove the C+ grade
The composite is a weighted blend of 9 inputs, each scored 0–100. Each bar is that input's sub-score; the figure is the points it added to the 100-point composite (weight × sub-score).
- Cash flow +25.1/30.0
- ARV discount +12.2/15.0
- DSCR +8.2/10.0
- 1% rule +5.5/10.0
- Livability +3.4/5.0
- Schools +2.5/10.0
- Condition / age +2.5/5.0
- Rent growth +2.3/5.0
- Appreciation +0.0/10.0
$125,000
🖨 Deal sheet (PDF) 📄 Offer letter ✓ Due diligence
Listing remarks MLS
Charming ranch-style home in the heart of Westwego! This 2-bedroom, 1-bath property offers approximately 900 sq ft of living space and sits on a spacious 50x120 lot. Features include a covered carport and a large backyard, great for outdoor enjoyment or future expansion. A new roof was installed in 2022 following Hurricane Ida, offering added peace of mind. Currently tenant-occupied, this property presents an excellent investment opportunity with immediate rental income potential. Conveniently located by local amenities, this is a great option for investors or buyers seeking an affordable starter home.
Key facts
- Parking
- Built 1968
- Listed 51 days
Property features AI
Exterior
- Parking: Carport
- Utilities: Public water; Public sewer
- Home design: Single-story home
- Construction: Brick construction; Shingle roof; Slab foundation; Built in average condition
- Exterior features: City lot, rectangular shape; Lot dimensions approximately 50 x 120
Interior
- Kitchen: Dishwasher; Microwave; Oven; Range; Refrigerator
- Bedrooms: Total of 4 rooms (includes bedrooms and living spaces)
- Bathrooms: 1 full bathroom
- Heating & cooling: Central heating; Central air conditioning
- Interior features: Attic with pull-down stairs; Ceiling fan(s)
- Laundry & utility: Washer; Dryer
Neighborhood map
What this means for you Summary
Snapshot
- This is a 2-bed/1.0-bath single-family listed at $125k.
Deal economics
- At list price, monthly cash flow is $276 ($3k/yr) — positive.
- The deal already cash-flows at list — no discount required.
- Meets the 1% rule at list price ($1k rent vs $125k).
- Recommended offer: $121k (3.0% below list) — sets the bar for market timing.
- Cap rate 8.9% vs local median 6.5% in Westwego — top-decile yield for the area; either an underpriced asset or a hidden risk that comps aren't pricing in. Stress-test before assuming the spread holds.
Location & tenants
- Location reads 68/100 on livability (#97 in LA) — a middle-class / working-renter tenant base. Strengths: cost of living A+, health & safety A+; Watch: schools C-, crime D, amenities D-.
- Jefferson Parish (suburban): math 24% / reading 34% proficiency, ranked #44 of 98 in LA (top 45%) — low school quality limits family demand, transient renter base, plan for 1-2y turnover; 70% free/reduced lunch — lower-income household profile, screen leases tightly.
- Market conditions: Rents soft (-0.8%/yr); 188 active listings in the ZIP; 17 comparable units currently listed for rent nearby; rentals at typical pace (median 25d on market — plan ~3-4 weeks tenant-placement turnaround); 518 units permitted in Jefferson Parish in 2024 (43 in 5+ unit buildings).
Forward outlook
- Local home prices are declining (-3.0%/yr); year-one equity from $864 of loan paydown is wiped out by about $4k of value loss. Plan a longer hold.
Negotiation context
- It's been on market 52 days — a 3% lower offer ($121k) is reasonable based on typical stale-listing flexibility.
- 5 sale attempts since 7y ago with the ask held roughly flat each time — persistent listings suggest the price (not the market) is what's stuck; bring a comps-based counter.
- Current owner paid $54k; list at $125k implies a 129% gain — meaningful room to come down on a strong offer.
Questions for the listing agent
- It's been on market 52 days. Have you received any prior offers? Is the seller open to a 3% concession, seller financing, or rate buy-down credit?
- Built in 1968 — when were the roof, HVAC, electrical panel, plumbing, and water heater last replaced?
- Is there a deadline driving the sale (1031 exchange, divorce, estate, relocation)? That informs how much negotiation room exists.
- Crime grade is D in this area — have there been break-ins, vandalism, or insurance claims at this property in the last 3 years? What carrier currently insures it and at what premium?
- What's the average days-on-market for RENTAL listings here right now (not sales)? A rising rental-DOM trend means longer vacancies and softer asking-rent achievability than the comps imply.
- What's the recent tenant-quality profile in this submarket — average credit score on applications, eviction rate, late-payment / NSF rate, and stable-employment percentage? A property-management company in the area should have these aggregated.
- How much new for-sale + rental construction is in the pipeline within 1–3 miles? Heavy new supply typically softens prices + rents 12–24 months out; constrained supply supports both.
Investment metrics
- 1% rule
- 1.05% ✓
- Cap rate
- 8.95%
- Cash-on-cash
- 9.47%
- DSCR
- 1.42
- GRM
- 7.9
CMA / ARV
- ARV (median comp)
- $139,456
- List price
- $125,000
- Delta
- -10.37%
- Verdict
- UNDERPRICED
- Comps
- 20 within 1.0 mi
Show comp detail 12 sales within ~0.75 mi
| Address | Dist | Beds/Ba | Sqft | Sold | Price | $/sf | Match |
|---|---|---|---|---|---|---|---|
| 815 West Dr | 0.02mi | 2/1.0 | 840 (-7%) | 4mo | $145,900 | $174 | 84 |
| 653 Avenue Ave E | 0.42mi | 2/1.0 | 875 (-3%) | 5mo | $114,000 | $130 | 72 |
| 607 Central Ave | 0.25mi | 2/1.0 | 970 (+8%) | 10mo | $109,900 | $113 | 67 |
| 945 Avenue B | 0.59mi | 3/1.0 (+1) | 900 (0%) | 3mo | $122,500 | $136 | 65 |
| 836 Avenue E | 0.42mi | 2/1.0 | 855 (-5%) | 12mo | $153,000 | $179 | 62 |
| 713 Chipley St | 0.22mi | 2/1.0 | 1,000 (+11%) | 12mo | $172,000 | $172 | 61 |
| 651 Avenue E | 0.43mi | 2/1.0 | 829 (-8%) | 10mo | $80,000 | $97 | 58 |
| 7525 Saint Anthony St | 0.46mi | 3/1.0 (+1) | 952 (+6%) | 8mo | $75,500 | $79 | 58 |
| 820 Avenue B Ave | 0.59mi | 3/2.0 (+1) | 930 (+3%) | 7mo | $215,300 | $232 | 52 |
| 631 Eighth St | 0.40mi | 3/2.0 (+1) | 1,022 (+14%) | 5mo | $190,000 | $186 | 46 |
| 7424 Pritchard St | 0.63mi | 2/1.0 | 1,000 (+11%) | 9mo | $158,000 | $158 | 45 |
| 774 Avenue B Ave | 0.59mi | 2/2.5 | 971 (+8%) | 10mo | $123,500 | $127 | 45 |
Match score weights: distance 35% · size 25% · config 20% · recency 20%. Top-matched comps best support the ARV.
Projected returns pro-forma
-3.0% appreciation · 0.0% rent growth · sell at horizon
- IRR
- -5.2%
- Equity multiple
- 0.81×
- Total profit
- $-6,559
- Equity at exit
- $18,638
- IRR
- 0.9%
- Equity multiple
- 1.05×
- Total profit
- $1,868
- Equity at exit
- $10,808
Cash invested: $35,000 (down + closing). Projections, not guarantees.
Landlord ↔ Tenant lean methodology
- Overall (STATE)
- 90 Strongly Landlord-Friendly
- State Louisiana
- 90 Strongly Landlord-Friendly · R+12
- County
- — inherits STATE
- City
- — inherits STATE
ZIP-level market 70094
- Rents YoY
- -0.8%
- Active inventory
- 188
- Price-to-rent
- 7.9×
Monthly cashflow live
- Estimated rent
- $1,316 high interval (Pro) →
- Mortgage (P&I)
- −$656
- Tax from tax record
- −$56 /mo · $673/yr
- Insurance
- −$52
- HOA
- −$0
- Vacancy / Maint / Mgmt
- −$276
- Net cashflow
- $276
Break-even live
Sensitivity live
| Price | -10% $347 | -5% $312 | +0% $276 | +5% $241 | +10% $206 |
|---|---|---|---|---|---|
| Rent | -10% $172 | -5% $224 | +0% $276 | +5% $328 | +10% $380 |
| Rate | -1.0pp $339 | -0.5pp $308 | base $276 | +0.5pp $244 | +1.0pp $211 |
UW: 25.0% down · 7.5% · 30yr · 1.5% tax · 5.0% vac · 8.0% maint · 8.0% mgmt
Financing live
Cash to close
- Down payment
- $31,250
- Closing costs
- $3,750
- Reserves months
- —
- Total cash needed
- —
Loan-product check · same deal, 3 products live
Conventional
25% down · 7.5% · 30yr
- Down + closing
- —
- Monthly P&I
- —
- Monthly cashflow
- —
- DSCR
- —
- Eligible?
- —
Personal DTI + credit; lowest rate.
DSCR
20% down · 8.5% · 30yr
- Down + closing
- —
- Monthly P&I
- —
- Monthly cashflow
- —
- DSCR
- —
- Eligible?
- —
No personal income docs; deal must DSCR.
Hard money
10% down · 12.0% · 12mo
- Down + closing
- —
- Monthly P&I
- —
- Monthly cashflow
- —
- DSCR
- —
- Eligible?
- —
Short-term bridge; refi at stabilization.
Rent comps 17 comps
| Address | Beds | Baths | Sqft | Rent | $/sqft | DOM | Units | Dist |
|---|---|---|---|---|---|---|---|---|
| 710 West Dr Westwego, LA | 2.0 | 1.0 | 941 | $1,500 | $1.59 | 5d | 1 | 0.14mi |
| 1015 West Dr Westwego, LA | 2.0 | 1.0 | 750 | $1,200 | $1.60 | 44d | 1 | 0.26mi |
| 900 Avenue H Unit D Westwego, LA | 2.0 | 1.5 | 992 | $1,300 | $1.31 | 21d | 1 | 0.41mi |
| 958 Avenue B Westwego, LA | 2.0 | 1.0 | 1018 | $1,500 | $1.47 | 44d | 1 | 0.43mi |
| 1105 Magnolia Dr Apt E Westwego, LA | 1.0 | 1.0 | 750 | $950 | $1.27 | 22d | 1 | 0.46mi |
| 1105 Magnolia Dr Unit H Westwego, LA | 1.0 | 1.0 | 750 | $950 | $1.27 | 4d | 1 | 0.46mi |
| 1300 Tanglewood Dr Westwego, LA | 1.0–3.0 | 1.0–1.5 | 781 | $1,180 | $1.51 | 3d | 14 | 0.48mi |
| 1234 Central Ave Westwego, LA | 3.0 | 1.5 | 800 | $1,200 | $1.50 | 24d | 1 | 0.53mi |
| 7429 Pritchard St Marrero, LA | 2.0 | 1.0 | 925 | $1,150 | $1.24 | 15d | 1 | 0.63mi |
| 1060 Avenue B Unit A Westwego, LA | 3.0 | 2.0 | 1124 | $1,550 | $1.38 | 24d | 1 | 0.65mi |
| 7409 4th St Unit B Marrero, LA | 1.0 | 1.0 | 665 | $900 | $1.35 | 24d | 1 | 0.73mi |
| 1413 Central Ave Unit C Westwego, LA | 2.0 | 1.5 | 1000 | $1,200 | $1.20 | 44d | 1 | 0.74mi |
| 196 Louisiana St Westwego, LA | 1.0 | 1.0 | 600 | $850 | $1.42 | 22d | 1 | 0.78mi |
| 196 Louisiana St Unit A Westwego, LA | 1.0 | 1.0 | 1000 | $850 | $0.85 | 24d | 1 | 0.78mi |
| 412 Avenue A Westwego, LA | 2.0 | 1.0 | 1103 | $1,500 | $1.36 | 44d | 1 | 0.87mi |
| 524 Bertucci St Marrero, LA | 2.0 | 1.0 | 960 | $1,300 | $1.35 | 15d | 1 | 1.00mi |
| 942 Francis St Marrero, LA | 1.0 | 1.0 | 625 | $1,125 | $1.80 | 24d | 1 | 1.17mi |
Listing history 25 events
-
2026-06-21days on market $125,000 Active 52 DOM
-
2026-06-18days on market $125,000 Active 49 DOM
-
2026-06-17days on market $125,000 Active 48 DOM
-
2026-06-16days on market $125,000 Active 47 DOM
-
2026-06-15days on market $125,000 Active 46 DOM
-
2026-06-13days on market $125,000 Active 44 DOM
-
2026-06-10days on market $125,000 Active 41 DOM
-
2026-06-09days on market $125,000 Active 40 DOM
-
2026-06-08days on market $125,000 Active 39 DOM
-
2026-06-07days on market $125,000 Active 38 DOM
-
2026-06-03days on market $125,000 Active 34 DOM
-
2026-06-02days on market $125,000 Active 33 DOM
-
2026-06-01days on market $125,000 Active 32 DOM
-
2026-05-31days on market $125,000 Active 31 DOM
-
2026-04-30price $125,000 609-char remark
Show marketing remark (609 chars)
Charming ranch-style home in the heart of Westwego! This 2-bedroom, 1-bath property offers approximately 900 sq ft of living space and sits on a spacious 50x120 lot. Features include a covered carport and a large backyard, great for outdoor enjoyment or future expansion. A new roof was installed in 2022 following Hurricane Ida, offering added peace of mind. Currently tenant-occupied, this property presents an excellent investment opportunity with immediate rental income potential. Conveniently located by local amenities, this is a great option for investors or buyers seeking an affordable starter home.
-
2026-04-30$12,500 Active 609-char remark
Show marketing remark (609 chars)
Charming ranch-style home in the heart of Westwego! This 2-bedroom, 1-bath property offers approximately 900 sq ft of living space and sits on a spacious 50x120 lot. Features include a covered carport and a large backyard, great for outdoor enjoyment or future expansion. A new roof was installed in 2022 following Hurricane Ida, offering added peace of mind. Currently tenant-occupied, this property presents an excellent investment opportunity with immediate rental income potential. Conveniently located by local amenities, this is a great option for investors or buyers seeking an affordable starter home.
-
2026-04-30$125,000 Active 609-char remark
Show marketing remark (609 chars)
Charming ranch-style home in the heart of Westwego! This 2-bedroom, 1-bath property offers approximately 900 sq ft of living space and sits on a spacious 50x120 lot. Features include a covered carport and a large backyard, great for outdoor enjoyment or future expansion. A new roof was installed in 2022 following Hurricane Ida, offering added peace of mind. Currently tenant-occupied, this property presents an excellent investment opportunity with immediate rental income potential. Conveniently located by local amenities, this is a great option for investors or buyers seeking an affordable starter home.
-
2019-08-28soldstatus $54,500
-
2019-08-27soldstatus $54,500
-
2019-08-27soldstatus $54,500 Closed
-
2019-08-01status Pending
-
2019-07-31$55,000
-
2019-07-31$55,000
-
2019-07-31$55,000 Active
-
1981-10-01soldstatus
ⓘ Source: listings_history table (triggers on properties + properties_extension) + one-shot
backfill from property_details.listing_events for pre-trigger history.
Tax reassessment forecast LA · Resets to sale price
- Current annual tax
- $673 · $56/mo
- Projected year-2 tax
- $688 · $57/mo
- Expected delta
- +$14/yr (+$1/mo · 2.1%)
ⓘ Screening estimate from a state-policy table — verify with the county assessor before closing.
Nearby sold comps map
Loading sold comps map…
Walkable amenities ~0.75 mi
Loading nearby amenities…
Taxation est. · year 1
- Rental income
- $15,797
- − Mortgage interest
- −$7,002
- − Property taxes
- −$673
- − Insurance
- −$625
- − Repairs & maintenance
- −$1,264
- − Management
- −$1,264
- − Depreciation
- −$3,636
- Taxable income
- $1,333
- Est. tax owed @ 24.0%
- −$320
- After-tax cash flow
- $2,995/yr
For passive investors: Depreciation is non-cash, so a rental often shows a tax loss while cash-flowing — sheltering income. Rental losses are passive: they offset passive income freely, and up to $25,000/yr can offset ordinary (W-2) income if you actively participate and your MAGI is under $100k (phasing out to $0 by $150k); unused losses carry forward. On sale, claimed depreciation is recaptured at up to 25%, and gains may owe capital-gains tax (a 1031 exchange can defer both). Figures are a year-1 estimate at your 24.0% rate — not tax advice; consult a CPA.
Schools (NCES district)
- District
- Jefferson Parish
- NCES district ID
- 2200840
- Math proficiency
- 24% ▼ -36.00%
- Reading proficiency
- 34% ▼ -30.00%
- Median HH income
- $48,421
- Composite
- 25.19/100
- National rank
- #7511
- State rank
- #44 of 98 in LA
Livability — Westwego
- Score
- 68/100
- State rank
- #97
- US rank
- #9851
Category grades
Schools grade is shown separately in the Schools card above.
Census & demographics
- Census place
- Westwego, LA
- County
- Jefferson Parish · 426,999 people
- City population
- 32,130
- Metro
- New Orleans-Metairie, LA
- Population (ZIP)
- 32,130
- Household income
- $53,597
- Rent vs Own
- Severe rent burden
- 1457.0
Population outlook (Jefferson County) Hauer SSP2
- Today (2025)
- 451,696 people
- By 2030
- 455,451 · +0.8%
- By 2040
- 458,308 · +1.5%
- By 2050
- 461,031 · +2.1%
- By 2075
- 476,351 · +5.5%
- By 2100
- 499,377 · +10.6%
Race, ethnicity, and origin ACS 2023
- Neighborhood character
- Diverse neighborhood (Simpson 0.65)
- Race & ethnicity
- Black 46% White 36% Hispanic / Latino 13% Two or more races 6% Asian 2%
- Hispanic origin (detail)
- Mexican 2% Dominican 2%
- Common ancestry
- Lithuanian 9% Scottish 1%
- Foreign-born
- 8% · Canada, Vietnam
- Languages at home
- 86% English-only · Spanish 11% Vietnamese 2% French/Haitian/Cajun 1%
Political lean MEDSL · Jefferson
- 2024 margin
- R (+12.9) · D 42.5% · R 55.5% · Other 2.1%
- 2008→2024 swing
- +13.6pp toward D · 2008: -26.6pp · 2024: -12.9pp
- All cycles
- 2024: R+12.9 2020: R+11.1 2016: R+14.8 2012: R+18.4 2008: R+26.6
Not yet ingested
- Civics
- —
Market trends
- HPI YoY
- ▼ -111.56%
- Current HPI
- 102.9992
- Rent YoY
- ▼ -0.80%
- Metro
- New Orleans-Metairie, LA
- State GDP YoY
- ▲ 3.29%
- F500 in state
- 10
Industry mix (Fortune 500 HQ in LA)
| Industry | F500 HQs | Revenue |
|---|---|---|
| Telecommunications | 2 | $23B |
|
||
| Utilities | 1 | $12B |
|
||
| Wholesale / Distribution | 1 | $5B |
|
||
| Advertising | 1 | $2B |
|
||
Price history
+127.3% since first listed11 events — show timeline
- 2026-04-30 Price Changed $125,000 GSREIN
- 2026-04-30 Listed $125,000 AcadianaMLS
- 2026-04-30 Listed $12,500 GSREIN
- 2019-08-28 Sold (Public Records) $54,500 Public Records
- 2019-08-27 Sold (MLS) $54,500 GSREIN
- 2019-08-27 Sold (MLS) $54,500 SBOR
- 2019-08-01 Pending — GSREIN
- 2019-07-31 Listed $55,000 GSREIN
- 2019-07-31 Listed $55,000 SBOR
- 2019-07-31 Listed $55,000 AcadianaMLS
- 1981-10-01 Sold (Public Records) — Public Records
Property tax history
-0.5%/yrLatest (2025): $673 · -0.2% YoY. Source: county tax records.
Cash-flow waterfall
monthlySold comps — $/sqft
last 12 mo · ≤1 miLoading sold comps…