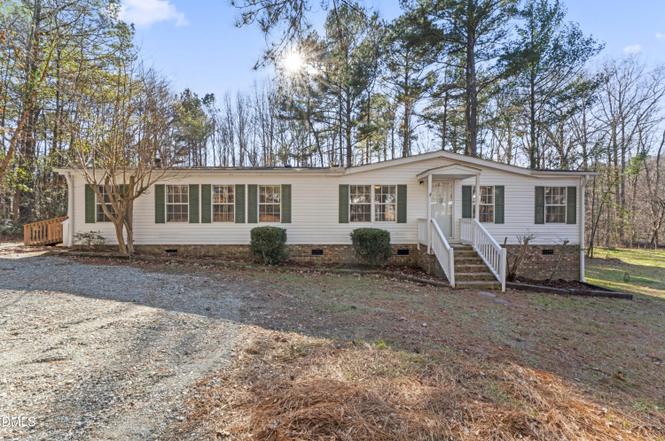
1145 Taos Trl · Fuquay-Varina, NC
Flood risk 1/10 · Minimal
- FEMA flood zone
- X (unshaded)
- Chance of flooding over 30 yrs
- 0.0%
- Est. flood insurance / yr
- $507 – $1,088
Fire risk 3/10 · Minor
- Est. fire insurance / yr
- $906 – $1,684
Heat risk 6/10 · Moderate
- Hot days now (above 106°F)
- 7 days/yr
- Hot days in 30 yrs
- 17 days/yr
Wind risk 6/10 · Moderate
- Chance of severe wind over 30 yrs
- 67.0%
Air-quality risk 2/10 · Minimal
- Unhealthy air days now
- 1 days/yr
- Unhealthy air days in 30 yrs
- 1 days/yr
Risk factors via First Street. Map © Google.
Why this score? — see what drove the D grade
The composite is a weighted blend of 9 inputs, each scored 0–100. Each bar is that input's sub-score; the figure is the points it added to the 100-point composite (weight × sub-score).
- Cash flow +14.9/30.0
- ARV discount +7.5/15.0
- Schools +4.9/10.0
- DSCR +4.6/10.0
- 1% rule +3.1/10.0
- Rent growth +2.9/5.0
- Livability +2.5/5.0
- Condition / age +2.5/5.0
- Appreciation +0.0/10.0
$255,000
🖨 Deal sheet (PDF) 📄 Offer letter ✓ Due diligence
Listing remarks
Private Retreat. Prime Location. Nearly an Acre. Enjoy space, privacy, and convenience in this charming 3BR/2BA home just minutes from I-540 and the heart of the Triangle. Inside, a bright open floor plan flows from the cozy fireplace in the living room to the dining area and out through French doors to a large rear deck. Perfect for morning coffee, weekend cookouts, or relaxing under mature trees in your peaceful backyard. The kitchen offers plenty of prep space and storage, while the split-bedroom layout provides privacy for the spacious primary suite featuring a soaking tub and dual closets. Fresh paint throughout, new crawlspace vapor barrier, mudroom with exterior access, dedicated lau
Key facts
- Open floor plan
- Cozy fireplace
- Rear deck
Tags
Property features AI
Finance
- Other: Lot approximately 0.92 acres
- HOA & community: No association
Exterior
- Parking: Gravel parking
- Utilities: Well water; Septic tank; Electricity connected; Water connected; Septic connected
- Home design: Manufactured house (double wide); One story; Brick/mortar foundation; Shingle roof
- Construction: Vinyl siding
- Exterior features: Deck; Publicly maintained asphalt road access; Zoned R-30
Interior
- Bedrooms: 3 bedrooms (all on the main level)
- Flooring: Vinyl
- Bathrooms: 2 full bathrooms
- Heating & cooling: Heat pump provides heating and cooling
- Interior features: Water heater; Vinyl flooring
Neighborhood map
What this means for you Summary
Snapshot
- This is a 3-bed/2.0-bath manufactured listed at $255k.
Deal economics
- At list price, monthly cash flow is $77 ($922/yr) — positive.
- The deal already cash-flows at list — no discount required.
- To meet the 1% rule (rent ≥ 1% of price), the offer needs to be $207k (19.0% below list).
- Recommended offer: $207k (19.0% below list) — sets the bar for 1% rule.
- Cap rate 6.7% vs local median 3.0% in Fuquay-Varina — top-decile yield for the area; either an underpriced asset or a hidden risk that comps aren't pricing in. Stress-test before assuming the spread holds.
Location & tenants
- Location reads: area grade D — affects rentability + tenant quality, not the cash-flow math above.
- Wake County Schools (suburban): math 52% / reading 60% proficiency, ranked #35 of 178 in NC (top 20%) — acceptable for families but not a draw, mixed tenant base, ~2y average lease.
- Zoned schools: Rand Road Elementary (math 31% / reading 40%, grade F, #817 of 1,410 statewide, top 58%, 370 students, 50% FRL); North Garner Middle (math 29% / reading 38%, grade F, #299 of 475 statewide, top 64%, 975 students, 57% FRL); Garner High (math 32% / reading 56%, grade F, #367 of 535 statewide, top 69%, 1,683 students, 50% FRL) — zoned schools average 52% FRL vs 30% district-wide (22 pts higher); higher-poverty schools than district average — tighter screening recommended.
- Zoned-school proficiency averages 38% at this address vs 56% district-wide (-18 pts) — the specific schools serving this property underperform the Wake County Schools average; the district grade overstates school quality for this exact location.
- Market conditions: Rents rising (+1.6%/yr); 493 active listings in the ZIP; 1 comparable units currently listed for rent nearby; solid renter incomes; 15,249 units permitted in Wake County in 2024 (5,568 in 5+ unit buildings).
Forward outlook
- Local home prices are declining (-3.0%/yr); year-one equity from $2k of loan paydown is wiped out by about $8k of value loss. Plan a longer hold.
- Wake County population projected at +51% by 2050 — long-run rental-demand tailwind backs the buy-and-hold thesis.
Negotiation context
- It's been on market 143 days — a 12% lower offer ($224k) is reasonable based on typical stale-listing flexibility.
- Current owner paid $54k; list at $255k implies a 377% gain — meaningful room to come down on a strong offer.
Risks & watch-outs
- Climate carrying-cost: major wind risk, 67% chance of damaging wind over 30y; extreme-heat days projected 7→17/yr by 2055 (HVAC capex compounding) — expect insurance premiums to compound above CPI over the hold.
Questions for the listing agent
- It's been on market 143 days. Have you received any prior offers? Is the seller open to a 19% concession, seller financing, or rate buy-down credit?
- Why hasn't it sold? Are there any deal-killer items the seller is aware of (foundation, flood, title, zoning, code violations)?
- Is there a deadline driving the sale (1031 exchange, divorce, estate, relocation)? That informs how much negotiation room exists.
- The area grade is low — what's the realistic commute time and amenity access for the typical tenant pool here? Any planned neighborhood developments (good or bad) we should know about?
- What's the average days-on-market for RENTAL listings here right now (not sales)? A rising rental-DOM trend means longer vacancies and softer asking-rent achievability than the comps imply.
- What's the recent tenant-quality profile in this submarket — average credit score on applications, eviction rate, late-payment / NSF rate, and stable-employment percentage? A property-management company in the area should have these aggregated.
- How much new for-sale + rental construction is in the pipeline within 1–3 miles? Heavy new supply typically softens prices + rents 12–24 months out; constrained supply supports both.
Investment metrics
- 1% rule
- 0.81% ✗
- Cap rate
- 6.65%
- Cash-on-cash
- 1.29%
- DSCR
- 1.06
- GRM
- 10.3
CMA / ARV
No comps found within radius.
Projected returns pro-forma
-3.0% appreciation · 1.59% rent growth · sell at horizon
- IRR
- -15.7%
- Equity multiple
- 0.45×
- Total profit
- $-39,414
- Equity at exit
- $38,021
- IRR
- -9.7%
- Equity multiple
- 0.44×
- Total profit
- $-39,942
- Equity at exit
- $22,048
Cash invested: $71,400 (down + closing). Projections, not guarantees.
Landlord ↔ Tenant lean methodology
- Overall (STATE)
- 85 Strongly Landlord-Friendly
- State North Carolina
- 85 Strongly Landlord-Friendly · R+3
- County
- — inherits STATE
- City
- — inherits STATE
ZIP-level market 27603
- Rents YoY
- 1.6%
- Active inventory
- 493
- Price-to-rent
- 10.3×
Monthly cashflow live
- Estimated rent
- $2,067 medium interval (Pro) →
- Mortgage (P&I)
- −$1,337
- Tax from tax record
- −$112 /mo · $1,348/yr
- Insurance
- −$106
- HOA
- −$0
- Vacancy / Maint / Mgmt
- −$434
- Net cashflow
- $77
Break-even live
Sensitivity live
| Price | -10% $221 | -5% $149 | +0% $77 | +5% $5 | +10% $-68 |
|---|---|---|---|---|---|
| Rent | -10% $-86 | -5% $-5 | +0% $77 | +5% $158 | +10% $240 |
| Rate | -1.0pp $205 | -0.5pp $142 | base $77 | +0.5pp $11 | +1.0pp $-56 |
UW: 25.0% down · 7.5% · 30yr · 1.5% tax · 5.0% vac · 8.0% maint · 8.0% mgmt
Financing live
Cash to close
- Down payment
- $63,750
- Closing costs
- $7,650
- Reserves months
- —
- Total cash needed
- —
Loan-product check · same deal, 3 products live
Conventional
25% down · 7.5% · 30yr
- Down + closing
- —
- Monthly P&I
- —
- Monthly cashflow
- —
- DSCR
- —
- Eligible?
- —
Personal DTI + credit; lowest rate.
DSCR
20% down · 8.5% · 30yr
- Down + closing
- —
- Monthly P&I
- —
- Monthly cashflow
- —
- DSCR
- —
- Eligible?
- —
No personal income docs; deal must DSCR.
Hard money
10% down · 12.0% · 12mo
- Down + closing
- —
- Monthly P&I
- —
- Monthly cashflow
- —
- DSCR
- —
- Eligible?
- —
Short-term bridge; refi at stabilization.
Rent comps 1 comps
| Address | Beds | Baths | Sqft | Rent | $/sqft | DOM | Units | Dist |
|---|---|---|---|---|---|---|---|---|
| 1021 Silver Farm Rd Raleigh, NC | 3.0 | 3.0 | 2097 | $2,685 | $1.28 | 25d | 1 | 0.39mi |
Listing history 5 events
-
2026-05-04status Pending
-
2026-04-02price $255,000
-
2026-01-25price $265,000
-
2025-12-11$272,000 Active
-
2016-08-22soldstatus $53,500
ⓘ Source: listings_history table (triggers on properties + properties_extension) + one-shot
backfill from property_details.listing_events for pre-trigger history.
Tax reassessment forecast NC · Resets to sale price
- Current annual tax
- $1,348 · $112/mo
- Projected year-2 tax
- $2,091 · $174/mo
- Expected delta
- +$743/yr (+$62/mo · 55.1%)
ⓘ Screening estimate from a state-policy table — verify with the county assessor before closing.
Climate risk First Street
- Flood 1/10 Low FEMA zone X (unshaded) · 0% chance over 30 yrs
- Wildfire 3/10 Moderate
- Heat 6/10 Major 7 d/yr ≥106°F today · 17 d/yr by 30 yrs out
- Wind 6/10 Major 67% chance of damaging wind over 30 yrs
- Air quality 2/10 Low 1 unhealthy d/yr today · 1 by 30 yrs out
Nearby sold comps map
Loading sold comps map…
Walkable amenities ~0.75 mi
Loading nearby amenities…
Taxation est. · year 1
- Rental income
- $24,800
- − Mortgage interest
- −$14,284
- − Property taxes
- −$1,348
- − Insurance
- −$1,275
- − Repairs & maintenance
- −$1,984
- − Management
- −$1,984
- − Depreciation
- −$7,418
- Taxable loss
- −$3,493
- Est. tax savings @ 24.0%
- +$838
- After-tax cash flow
- $1,760/yr
For passive investors: Depreciation is non-cash, so a rental often shows a tax loss while cash-flowing — sheltering income. Rental losses are passive: they offset passive income freely, and up to $25,000/yr can offset ordinary (W-2) income if you actively participate and your MAGI is under $100k (phasing out to $0 by $150k); unused losses carry forward. On sale, claimed depreciation is recaptured at up to 25%, and gains may owe capital-gains tax (a 1031 exchange can defer both). Figures are a year-1 estimate at your 24.0% rate — not tax advice; consult a CPA.
Schools (NCES district)
- District
- Wake County Schools
- NCES district ID
- 3704720
- Math proficiency
- 52% ▲ 2.00%
- Reading proficiency
- 60% ▲ 4.00%
- Median HH income
- $67,509
- Composite
- 49.41/100
- National rank
- #2010
- State rank
- #35 of 178 in NC
Livability — Fuquay-Varina
No livability data for this city. (Only ~50 U.S. cities are tracked.)
Census & demographics
- County
- Wake County · 1,216,256 people
- Metro
- Raleigh-Cary, NC
- Population (ZIP)
- 53,972
- Household income
- $90,484
- Rent vs Own
- Severe rent burden
- 1914.0
Population outlook (Wake County) Hauer SSP2
- Today (2025)
- 1,293,152 people
- By 2030
- 1,428,223 · +10.4%
- By 2040
- 1,698,188 · +31.3%
- By 2050
- 1,955,807 · +51.2%
- By 2075
- 2,520,273 · +94.9%
- By 2100
- 2,893,335 · +123.7%
Race, ethnicity, and origin ACS 2023
- Neighborhood character
- Diverse neighborhood (Simpson 0.57)
- Race & ethnicity
- White 62% Black 17% Hispanic / Latino 14% Two or more races 10% Asian 2%
- Hispanic origin (detail)
- Mexican 9% Puerto Rican 1%
- Common ancestry
- Serbian 3% Slovak 2% Italian 2%
- Foreign-born
- 10% · Canada, China
- Languages at home
- 85% English-only · Spanish 10% Other Indo-European 1% Arabic 1%
Political lean MEDSL · Wake
- 2024 margin
- Strong D (+25.5) · D 61.9% · R 36.4% · Other 1.7%
- 2008→2024 swing
- +11.1pp toward D · 2008: 14.4pp · 2024: 25.5pp
- All cycles
- 2024: D+25.5 2020: D+26.4 2016: D+20.5 2012: D+10.2 2008: D+14.4
Not yet ingested
- Civics
- —
Market trends
- HPI YoY
- ▼ -132.00%
- Current HPI
- 243.2963
- Rent YoY
- ▲ 1.59%
- Metro
- Raleigh-Cary, NC
- State GDP YoY
- ▲ 3.28%
- F500 in state
- 26
Industry mix (Fortune 500 HQ in NC)
| Industry | F500 HQs | Revenue |
|---|---|---|
| Financial Services | 2 | $213B |
|
||
| Retail | 2 | $95B |
|
||
| Industrial Conglomerate | 1 | $38B |
|
||
| Metals / Steel | 1 | $35B |
|
||
| Utilities | 1 | $30B |
|
||
| Industrial Machinery | 1 | $19B |
|
||
Price history
+376.6% since first listed5 events — show timeline
- 2026-05-04 Pending — TMLS
- 2026-04-02 Price Changed $255,000 TMLS
- 2026-01-25 Price Changed $265,000 TMLS
- 2025-12-11 Listed $272,000 TMLS
- 2016-08-22 Sold (Public Records) $53,500 Public Records
Property tax history
+5.8%/yrLatest (2025): $1,348 · +2.9% YoY. Source: county tax records.
Cash-flow waterfall
monthlySold comps — $/sqft
last 12 mo · ≤1 miLoading sold comps…