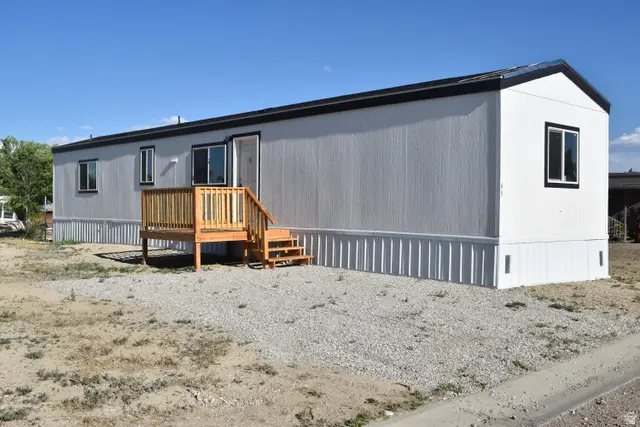
425 N Esquire Pkwy #49 · Castle Dale, UT
Flood risk 1/10 · Minimal
- FEMA flood zone
- —
- Chance of flooding over 30 yrs
- 0.0%
- Est. flood insurance / yr
- —
Fire risk 4/10 · Minor
- Est. fire insurance / yr
- $453 – $841
Heat risk 3/10 · Minor
- Hot days now (above 92°F)
- 7 days/yr
- Hot days in 30 yrs
- 21 days/yr
Wind risk 1/10 · Minimal
- Chance of severe wind over 30 yrs
- —
Air-quality risk 1/10 · Minimal
- Unhealthy air days now
- 0 days/yr
- Unhealthy air days in 30 yrs
- 0 days/yr
Risk factors via First Street. Map © Google.
Why this score? — see what drove the B- grade
The composite is a weighted blend of 9 inputs, each scored 0–100. Each bar is that input's sub-score; the figure is the points it added to the 100-point composite (weight × sub-score).
- Cash flow +24.2/30.0
- DSCR +7.8/10.0
- ARV discount +7.5/15.0
- 1% rule +6.3/10.0
- Appreciation +5.3/10.0
- Condition / age +5.0/5.0
- Livability +3.6/5.0
- Schools +3.4/10.0
- Rent growth +2.5/5.0
$89,000
🖨 Deal sheet 📄 Offer letter ✓ Due diligence
Listing remarks
Brand new 2026 manufactured home priced at just $89,900! This move-in ready 3 bed/2 bath features an open-concept layout, modern cabinetry, updated flooring, energy-efficient windows, and all-new appliances. The primary suite includes a private bath and ample closet space. Enjoy a brand new deck and fresh curb appeal. Perfect for first-time buyers, downsizers, or investors - comfort and style at an unbeatable price!
Key facts
- Modern cabinetry
- Private bath
- Updated flooring
Tags
Property features AI
Finance
- Financial info: $100 annual tax
- HOA & community: Clubhouse; Subdivision: Esquire Park; Has home warranty
Exterior
- Utilities: Electricity connected; Sewer connected; Water connected (culinary)
- Home design: Mobile-style residence; Built/standing construction; Single-story
- Construction: Built/standing condition; Other construction materials
- Exterior features: Mountain view; Xeriscaped landscaping; Asphalt roof; Residential use
Interior
- Bedrooms: 3 main-level bedrooms; Primary bedroom on the 1st floor
- Flooring: Carpet; Linoleum
- Bathrooms: 2 full bathrooms
- Heating & cooling: Electric forced air heating
- Interior features: Single-level living; Total of 8 rooms; No basement
Neighborhood map
What this means for you Summary
Snapshot
- This is a 3-bed/2.0-bath manufactured listed at $89k. Condition is rated excellent.
Deal economics
- At list price, monthly cash flow is $178 ($2k/yr) — positive.
- The deal already cash-flows at list — no discount required.
- Meets the 1% rule at list price ($1k rent vs $89k).
Location & tenants
- Location reads 72/100 on livability (#82 in UT) — a middle-class / working-renter tenant base. Strengths: crime A+, cost of living A+, housing A+; Watch: amenities F, commute F.
- Emery District (rural): math 43% / reading 35% proficiency, ranked #52 of 80 in UT (top 65%) — families likely to look elsewhere, expect single-tenant / working-renter base with shorter leases.
- Zoned schools: Castle Dale School (math 47% / reading 37%, grade F, #287 of 585 statewide, top 52%, 145 students, 48% FRL); Canyon View Middle School (math 32% / reading 27%, grade F, #109 of 138 statewide, top 80%, 200 students, 49% FRL).
- Market conditions: 24 active listings in the ZIP; 55 units permitted in Emery County in 2024 (0 in 5+ unit buildings).
Forward outlook
- In year one you build about $1k of equity ($615 loan paydown + $473 appreciation (0.5% local appreciation)).
- Emery County population projected at -36% by 2050 — secular population decline; favor cash flow + early exit over multi-decade hold.
- At projected returns (0.5% appreciation + 3.0% rent growth), your $25k cash investment doubles in ~7 years — after that, you're playing with house money.
Negotiation context
- Only 13 days on market — expect competitive offers; lowballing is unlikely to land.
Questions for the listing agent
- Is there a deadline driving the sale (1031 exchange, divorce, estate, relocation)? That informs how much negotiation room exists.
- What's the average days-on-market for RENTAL listings here right now (not sales)? A rising rental-DOM trend means longer vacancies and softer asking-rent achievability than the comps imply.
- What's the recent tenant-quality profile in this submarket — average credit score on applications, eviction rate, late-payment / NSF rate, and stable-employment percentage? A property-management company in the area should have these aggregated.
- How much new for-sale + rental construction is in the pipeline within 1–3 miles? Heavy new supply typically softens prices + rents 12–24 months out; constrained supply supports both.
Investment metrics
- 1% rule
- 1.13% ✓
- Cap rate
- 8.70%
- Cash-on-cash
- 8.58%
- DSCR
- 1.38
- GRM
- 7.4
CMA / ARV
No comps found within radius.
Projected returns pro-forma
0.53% appreciation · 3.0% rent growth · sell at horizon
- IRR
- 9.0%
- Equity multiple
- 1.44×
- Total profit
- $11,015
- Equity at exit
- $28,236
- IRR
- 13.4%
- Equity multiple
- 2.55×
- Total profit
- $38,549
- Equity at exit
- $35,914
Cash invested: $24,920 (down + closing). Projections, not guarantees.
Landlord ↔ Tenant lean methodology
- Overall (STATE)
- 86 Strongly Landlord-Friendly
- State Utah
- 86 Strongly Landlord-Friendly · R+15
- County
- — inherits STATE
- City
- — inherits STATE
ZIP-level market 84513
- Home prices YoY
- 0.5%
- Active inventory
- 24
- Price-to-rent
- 7.4×
Monthly cashflow live
- Estimated rent
- $1,004 medium interval (Pro) →
- Mortgage (P&I)
- −$467
- Tax est. 1.5%
- −$111 /mo · $1,335/yr
- Insurance
- −$37
- HOA
- −$0
- Vacancy / Maint / Mgmt
- −$211
- Net cashflow
- $178
Break-even live
UW: 25.0% down · 7.5% · 30yr · 1.5% tax · 5.0% vac · 8.0% maint · 8.0% mgmt
Financing live
Cash to close
- Down payment
- $22,250
- Closing costs
- $2,670
- Reserves months
- —
- Total cash needed
- —
Loan-product check · same deal, 3 products live
Conventional
25% down · 7.5% · 30yr
- Down + closing
- —
- Monthly P&I
- —
- Monthly cashflow
- —
- DSCR
- —
- Eligible?
- —
Personal DTI + credit; lowest rate.
DSCR
20% down · 8.5% · 30yr
- Down + closing
- —
- Monthly P&I
- —
- Monthly cashflow
- —
- DSCR
- —
- Eligible?
- —
No personal income docs; deal must DSCR.
Hard money
10% down · 12.0% · 12mo
- Down + closing
- —
- Monthly P&I
- —
- Monthly cashflow
- —
- DSCR
- —
- Eligible?
- —
Short-term bridge; refi at stabilization.
Listing history 12 events
-
2026-06-18days on market $89,000 Active 13 DOM
-
2026-06-17days on market $89,000 Active 12 DOM
-
2026-06-16days on market $89,000 Active 11 DOM
-
2026-06-15days on market $89,000 Active 10 DOM
-
2026-06-15days on market $89,000 Active 9 DOM
-
2026-06-13days on market $89,000 Active 8 DOM
-
2026-06-12days on market $89,000 Active 7 DOM
-
2026-06-09days on market $89,000 Active 4 DOM
-
2026-06-08days on market $89,000 Active 3 DOM
-
2026-06-08days on market $89,000 Active 2 DOM
-
2026-06-07remarks 419-char remark
-
2026-06-07$89,000 Active 1 DOM
ⓘ Source: listings_history table (triggers on properties + properties_extension) + one-shot
backfill from property_details.listing_events for pre-trigger history.
Climate risk First Street
- Flood 1/10 Low 0% chance over 30 yrs
- Wildfire 4/10 Moderate
- Heat 3/10 Moderate 7 d/yr ≥92°F today · 21 d/yr by 30 yrs out
- Wind 1/10 Low
- Air quality 1/10 Low 0 unhealthy d/yr today · 0 by 30 yrs out
Nearby sold comps map
Loading sold comps map…
Walkable amenities ~0.75 mi
Loading nearby amenities…
Taxation est. · year 1
- Rental income
- $12,051
- − Mortgage interest
- −$4,985
- − Property taxes
- −$1,335
- − Insurance
- −$445
- − Repairs & maintenance
- −$964
- − Management
- −$964
- − Depreciation
- −$2,589
- Taxable income
- $768
- Est. tax owed @ 24.0%
- −$184
- After-tax cash flow
- $1,955/yr
For passive investors: Depreciation is non-cash, so a rental often shows a tax loss while cash-flowing — sheltering income. Rental losses are passive: they offset passive income freely, and up to $25,000/yr can offset ordinary (W-2) income if you actively participate and your MAGI is under $100k (phasing out to $0 by $150k); unused losses carry forward. On sale, claimed depreciation is recaptured at up to 25%, and gains may owe capital-gains tax (a 1031 exchange can defer both). Figures are a year-1 estimate at your 24.0% rate — not tax advice; consult a CPA.
Condition & rehab AI · 13 photos
This move-in ready 2026 manufactured home is in excellent condition with modern updates and fresh curb appeal.
Value-add opportunities
- Both Landscaping and curb appeal — Enhances both resale and rental value.
- Both Painting interior walls — Fresh paint enhances curb appeal and interior aesthetics.
- Both Landscaping and curb appeal — Enhances both resale and rental value.
Renovation cost estimate screening
Value-add ROI direction
- Both Landscaping and curb appeal — Enhances both resale and rental value. ↑
- Both Painting interior walls — Fresh paint enhances curb appeal and interior aesthetics. ↑
- Both Landscaping and curb appeal — Enhances both resale and rental value. ↑
ⓘ Cost ranges are severity-bucket heuristics (US national rule-of-thumb). Get contractor quotes + a written scope before underwriting a rehab budget.
Schools (NCES district)
- District
- Emery District
- NCES district ID
- 4900270
- Math proficiency
- 43% ▼ -1.00%
- Reading proficiency
- 35% ▼ -7.00%
- Median HH income
- $50,076
- Composite
- 33.71/100
- National rank
- #5381
- State rank
- #52 of 80 in UT
Livability — Castle Dale
- Score
- 72/100
- State rank
- #82
- US rank
- #6347
Category grades
Schools grade is shown separately in the Schools card above.
Census & demographics
- Census place
- Castle Dale, UT
- Population (ZIP)
- 1,463
Population outlook (Emery County) Hauer SSP2
- Today (2025)
- 9,137 people
- By 2030
- 8,406 · -8.0%
- By 2040
- 7,030 · -23.1%
- By 2050
- 5,829 · -36.2%
- By 2075
- 3,587 · -60.7%
- By 2100
- 2,532 · -72.3%
Race, ethnicity, and origin ACS 2023
- Neighborhood character
- Predominantly White (89%)
- Race & ethnicity
- White 89% Two or more races 10% Hispanic / Latino 5%
- Hispanic origin (detail)
- Mexican 5%
- Common ancestry
- Slovak 5% Italian 5% Lithuanian 2%
- Languages at home
- 99% English-only · Spanish 1%
Political lean MEDSL · Emery
- 2024 margin
- Solid R (+74.6) · D 12.0% · R 86.6% · Other 1.3%
- 2008→2024 swing
- -21.0pp toward R · 2008: -53.6pp · 2024: -74.6pp
- All cycles
- 2024: R+74.6 2020: R+74.7 2016: R+70.9 2012: R+71.9 2008: R+53.6
Not yet ingested
- Civics
- —
Market trends
- HPI YoY
- ▲ 0.53%
- Current HPI
- 108.5628
- Rent YoY
- —
- Metro
- —
- State GDP YoY
- ▲ 3.54%
- F500 in state
- 2
Industry mix (Fortune 500 HQ in UT)
| Industry | F500 HQs | Revenue |
|---|---|---|
| Financial Services | 1 | $3B |
|
||
Price history
1 event — show timeline
- 2026-06-05 Listed $89,000 WFRMLS
Cash-flow waterfall
monthlySold comps — $/sqft
last 12 mo · ≤1 miLoading sold comps…