 🏗️ New Construction
Summit (Oakview) Plan · Carrollton, KY
Flood risk 1/10 · Minimal
- FEMA flood zone
- X (unshaded)
- Chance of flooding over 30 yrs
- 0.0%
- Est. flood insurance / yr
- $507 – $1,088
Fire risk 3/10 · Minor
- Est. fire insurance / yr
- $839 – $1,559
Heat risk 5/10 · Moderate
- Hot days now (above 104°F)
- 7 days/yr
- Hot days in 30 yrs
- 19 days/yr
Wind risk 2/10 · Minimal
- Chance of severe wind over 30 yrs
- 2.0%
Air-quality risk 3/10 · Minor
- Unhealthy air days now
- 2 days/yr
- Unhealthy air days in 30 yrs
- 4 days/yr
Risk factors via First Street. Map © Google.
Why this score? — see what drove the D grade
The composite is a weighted blend of 9 inputs, each scored 0–100. Each bar is that input's sub-score; the figure is the points it added to the 100-point composite (weight × sub-score).
- Appreciation +10.0/10.0
- 1% rule +8.8/10.0
- ARV discount +7.5/15.0
- Cash flow +6.5/30.0
- Livability +3.6/5.0
- Rent growth +2.5/5.0
- Condition / age +2.5/5.0
- Schools +1.5/10.0
- DSCR +0.7/10.0
$67,995
🖨 Deal sheet (PDF) 📄 Offer letter ✓ Due diligence
Listing remarks
Located off I-71, Oakview Pointe is a quiet suburban community close to shopping and employment, with a recreation area, playground, and just a short drive to General Butler State Park. Community Amenities Ball field, Basketball Court, Picnic Area, Playground, and Walking/Nature Trails Schools Carroll County School District: Richard B. Cartmell Elementary School, Carroll County Middle School, and Carroll County High School For current prices of homes in Oakview Pointe call our sales office today!
Key facts
- Listed 326 days
Property features AI
Finance
- Financial info: List price: $67,995
- HOA & community: HOA fee: $385
Exterior
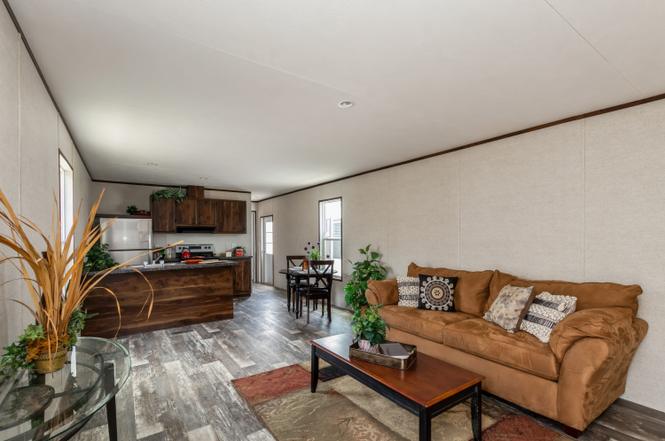
- Home design: New construction plan; Plan name: Summit (Oakview); Entry address: Summit (Oakview) Plan, Carrollton, KY 41008
- Construction: Living area approximately 1013
Interior
- Bedrooms: 2 bedrooms
- Bathrooms: 2 full bathrooms
- Interior features: Plan: Summit (Oakview)
Neighborhood map
What this means for you Summary
Snapshot
- This is a 2-bed/2.0-bath manufactured listed at $68k.
Deal economics
- At list price, monthly cash flow is $-116 ($-1k/yr) — negative.
- To cash-flow at today's rent, offer at most $51k (24.7% below list).
- Meets the 1% rule at list price ($935 rent vs $68k).
- Recommended offer: $51k (24.7% below list) — sets the bar for cash-flow.
- Cap rate 4.2% vs local median 3.3% in Carrollton — meaningfully above typical; check what's discounted (condition, days-on-market, listing class) to confirm the premium yield is real.
Location & tenants
- Location reads 72/100 on livability (#129 in KY) — a middle-class / working-renter tenant base. Strengths: crime A+, cost of living A+, housing A+; Watch: amenities F, commute F, employment F.
- Carroll County (town): math 12% / reading 23% proficiency, ranked #163 of 165 in KY (top 99%) — low school quality limits family demand, transient renter base, plan for 1-2y turnover.
- Zoned schools: Cartmell Elementary (math 12% / reading 17%, grade F, #627 of 676 statewide, top 93%, 410 students, 59% FRL); Carroll County Middle School (math 11% / reading 25%, grade F, #208 of 217 statewide, top 96%, 590 students, 59% FRL); Carroll County High School (math 17% / reading 22%, grade F, #213 of 254 statewide, top 86%, 572 students, 56% FRL) — zoned schools at 58% FRL track the district average.
- Market conditions: 60 active listings in the ZIP; 3 units permitted in Carroll County in 2024 (0 in 5+ unit buildings).
Forward outlook
- In year one you build about $7k of equity ($470 loan paydown + $7k appreciation (10.0% local appreciation)).
- Carroll County population projected at -15% by 2050 — secular population decline; favor cash flow + early exit over multi-decade hold.
- By year 5, paydown + projected appreciation supports a ~$34k cash-out refi (75% LTV) — recoverable capital for the next deal without selling this one.
Negotiation context
- It's been on market 327 days — a 12% lower offer ($60k) is reasonable based on typical stale-listing flexibility.
Risks & watch-outs
- Watch-outs: HOA is 41% of rent.
- Climate carrying-cost: extreme-heat days projected 7→19/yr by 2055 (HVAC capex compounding) — expect insurance premiums to compound above CPI over the hold.
Questions for the listing agent
- What do current leases actually rent for vs. the listed asking? Can we see a recent rent roll and the last 12 months of T-12 income?
- It's been on market 327 days. Have you received any prior offers? Is the seller open to a 25% concession, seller financing, or rate buy-down credit?
- What does the HOA fee cover, when was the last increase, and are there any pending special assessments or reserve-fund shortfalls?
- Why hasn't it sold? Are there any deal-killer items the seller is aware of (foundation, flood, title, zoning, code violations)?
- Is there a deadline driving the sale (1031 exchange, divorce, estate, relocation)? That informs how much negotiation room exists.
- Schools are D-rated, which usually means shorter tenancies and higher turnover. Who's the typical renter profile here, and what's been the actual vacancy rate?
- The area grade is low — what's the realistic commute time and amenity access for the typical tenant pool here? Any planned neighborhood developments (good or bad) we should know about?
- What's the average days-on-market for RENTAL listings here right now (not sales)? A rising rental-DOM trend means longer vacancies and softer asking-rent achievability than the comps imply.
- What's the recent tenant-quality profile in this submarket — average credit score on applications, eviction rate, late-payment / NSF rate, and stable-employment percentage? A property-management company in the area should have these aggregated.
- How much new for-sale + rental construction is in the pipeline within 1–3 miles? Heavy new supply typically softens prices + rents 12–24 months out; constrained supply supports both.
Investment metrics
- 1% rule
- 1.38% ✓
- Cap rate
- 4.25%
- Cash-on-cash
- -7.31%
- DSCR
- 0.67
- GRM
- 6.1
CMA / ARV
No comps found within radius.
Projected returns pro-forma
10.0% appreciation · 3.0% rent growth · sell at horizon
- IRR
- 19.3%
- Equity multiple
- 2.57×
- Total profit
- $29,899
- Equity at exit
- $61,255
- IRR
- 17.9%
- Equity multiple
- 5.96×
- Total profit
- $94,353
- Equity at exit
- $132,099
Cash invested: $19,039 (down + closing). Projections, not guarantees.
Landlord ↔ Tenant lean methodology
- Overall (STATE)
- 83 Strongly Landlord-Friendly
- State Kentucky
- 83 Strongly Landlord-Friendly · R+16
- County
- — inherits STATE
- City
- — inherits STATE
ZIP-level market 41008
- Home prices YoY
- 16.4%
- Active inventory
- 60
- Price-to-rent
- 6.1×
Monthly cashflow live
- Estimated rent
- $935 medium interval (Pro) →
- Mortgage (P&I)
- −$357
- Tax est. 1.5%
- −$85 /mo · $1,020/yr
- Insurance
- −$28
- HOA
- −$385
- Vacancy / Maint / Mgmt
- −$196
- Net cashflow
- $-116
Break-even live
Sensitivity live
| Price | -10% $-69 | -5% $-92 | +0% $-116 | +5% $-139 | +10% $-163 |
|---|---|---|---|---|---|
| Rent | -10% $-190 | -5% $-153 | +0% $-116 | +5% $-79 | +10% $-42 |
| Rate | -1.0pp $-82 | -0.5pp $-99 | base $-116 | +0.5pp $-134 | +1.0pp $-151 |
UW: 25.0% down · 7.5% · 30yr · 1.5% tax · 5.0% vac · 8.0% maint · 8.0% mgmt
Financing live
Cash to close
- Down payment
- $16,999
- Closing costs
- $2,040
- Reserves months
- —
- Total cash needed
- —
Loan-product check · same deal, 3 products live
Conventional
25% down · 7.5% · 30yr
- Down + closing
- —
- Monthly P&I
- —
- Monthly cashflow
- —
- DSCR
- —
- Eligible?
- —
Personal DTI + credit; lowest rate.
DSCR
20% down · 8.5% · 30yr
- Down + closing
- —
- Monthly P&I
- —
- Monthly cashflow
- —
- DSCR
- —
- Eligible?
- —
No personal income docs; deal must DSCR.
Hard money
10% down · 12.0% · 12mo
- Down + closing
- —
- Monthly P&I
- —
- Monthly cashflow
- —
- DSCR
- —
- Eligible?
- —
Short-term bridge; refi at stabilization.
HOA detail
- Monthly dues
- $385 · $4,620/yr
Listing history 18 events
-
2026-06-22days on market $67,995 Active 327 DOM
-
2026-06-21days on market $67,995 Active 326 DOM
-
2026-06-21days on market $67,995 Active 325 DOM
-
2026-06-18days on market $67,995 Active 323 DOM
-
2026-06-17days on market $67,995 Active 322 DOM
-
2026-06-16days on market $67,995 Active 321 DOM
-
2026-06-15days on market $67,995 Active 320 DOM
-
2026-06-13days on market $67,995 Active 318 DOM
-
2026-06-12days on market $67,995 Active 317 DOM
-
2026-06-09days on market $67,995 Active 314 DOM
-
2026-06-08days on market $67,995 Active 313 DOM
-
2026-06-07days on market $67,995 Active 312 DOM
-
2026-06-07days on market $67,995 Active 311 DOM
-
2026-06-04days on market $67,995 Active 308 DOM
-
2026-06-02days on market $67,995 Active 307 DOM
-
2026-06-01days on market $67,995 Active 306 DOM
-
2026-05-31days on market $67,995 Active 305 DOM
-
2026-05-31days on market $67,995 Active 304 DOM
ⓘ Source: listings_history table (triggers on properties + properties_extension) + one-shot
backfill from property_details.listing_events for pre-trigger history.
Climate risk First Street
- Flood 1/10 Low FEMA zone X (unshaded) · 0% chance over 30 yrs
- Wildfire 3/10 Moderate
- Heat 5/10 Major 7 d/yr ≥104°F today · 19 d/yr by 30 yrs out
- Wind 2/10 Low 2% chance of damaging wind over 30 yrs
- Air quality 3/10 Moderate 2 unhealthy d/yr today · 4 by 30 yrs out
Nearby sold comps map
Loading sold comps map…
Walkable amenities ~0.75 mi
Loading nearby amenities…
Taxation est. · year 1
- Rental income
- $11,225
- − Mortgage interest
- −$3,809
- − Property taxes
- −$1,020
- − Insurance
- −$340
- − Repairs & maintenance
- −$898
- − Management
- −$898
- − HOA
- −$4,620
- − Depreciation
- −$1,978
- Taxable loss
- −$2,338
- Est. tax savings @ 24.0%
- +$561
- After-tax cash flow
- $-830/yr
For passive investors: Depreciation is non-cash, so a rental often shows a tax loss while cash-flowing — sheltering income. Rental losses are passive: they offset passive income freely, and up to $25,000/yr can offset ordinary (W-2) income if you actively participate and your MAGI is under $100k (phasing out to $0 by $150k); unused losses carry forward. On sale, claimed depreciation is recaptured at up to 25%, and gains may owe capital-gains tax (a 1031 exchange can defer both). Figures are a year-1 estimate at your 24.0% rate — not tax advice; consult a CPA.
Schools (NCES district)
- District
- Carroll County
- NCES district ID
- 2100990
- Math proficiency
- 12% ▼ -14.00%
- Reading proficiency
- 23% ▼ -15.00%
- Median HH income
- $41,646
- Composite
- 15.0/100
- National rank
- #9361
- State rank
- #163 of 165 in KY
Livability — Carrollton
- Score
- 72/100
- State rank
- #129
- US rank
- #6156
Category grades
Schools grade is shown separately in the Schools card above.
Census & demographics
- Population (ZIP)
- 7,754
Population outlook (Carroll County) Hauer SSP2
- Today (2025)
- 10,359 people
- By 2030
- 10,058 · -2.9%
- By 2040
- 9,465 · -8.6%
- By 2050
- 8,788 · -15.2%
- By 2075
- 7,079 · -31.7%
- By 2100
- 5,066 · -51.1%
Race, ethnicity, and origin ACS 2023
- Neighborhood character
- Predominantly White (85%)
- Race & ethnicity
- White 85% Hispanic / Latino 9% Two or more races 8% Black 3%
- Hispanic origin (detail)
- Mexican 7%
- Common ancestry
- Iranian 2% Lithuanian 1% Slovak 1%
- Foreign-born
- 3% · Canada
- Languages at home
- 91% English-only · Spanish 6% German/W. Germanic 2%
Political lean MEDSL · Carroll
- 2024 margin
- Solid R (+51.0) · D 23.9% · R 74.9% · Other 1.2%
- 2008→2024 swing
- -42.7pp toward R · 2008: -8.2pp · 2024: -51.0pp
- All cycles
- 2024: R+51.0 2020: R+44.4 2016: R+38.5 2012: R+10.1 2008: R+8.2
Not yet ingested
- Civics
- —
Market trends
- HPI YoY
- ▲ 37.93%
- Current HPI
- 269.52
- Rent YoY
- —
- Metro
- —
- State GDP YoY
- ▲ 1.81%
- F500 in state
- 4
Industry mix (Fortune 500 HQ in KY)
| Industry | F500 HQs | Revenue |
|---|---|---|
| Healthcare | 1 | $118B |
|
||
| Food / Beverage | 1 | $7B |
|
||
Cash-flow waterfall
monthlySold comps — $/sqft
last 12 mo · ≤1 miLoading sold comps…