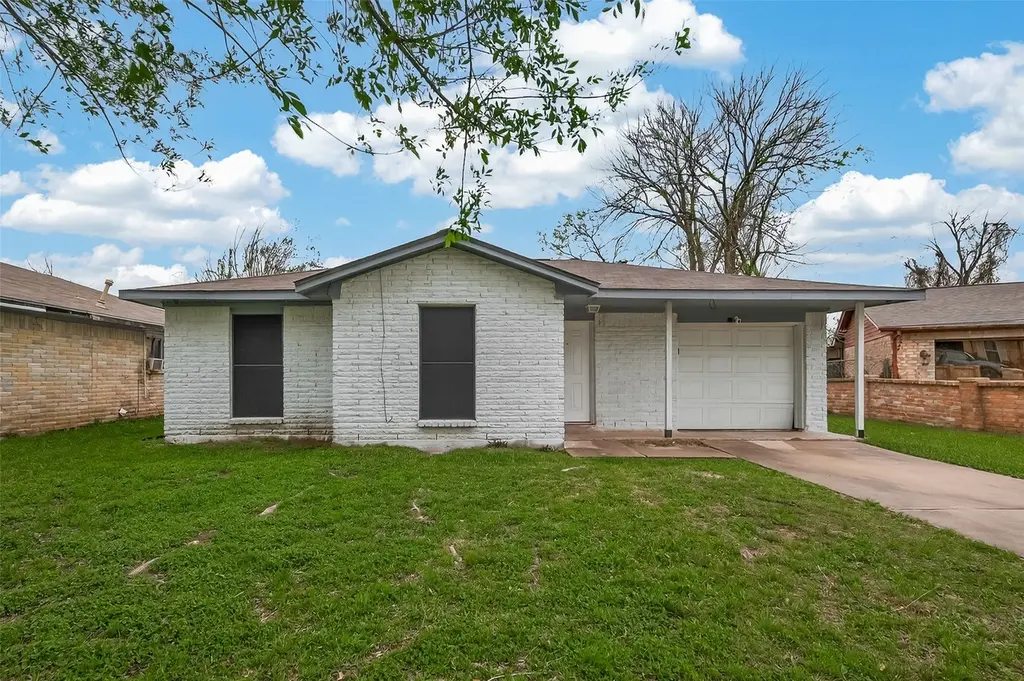
12811 Roandale Dr · Houston, TX
Flood risk 1/10 · Minimal
- FEMA flood zone
- X (unshaded)
- Chance of flooding over 30 yrs
- 0.0%
- Est. flood insurance / yr
- $507 – $1,088
Fire risk 1/10 · Minimal
- Est. fire insurance / yr
- $1,222 – $2,270
Heat risk 9/10 · Severe
- Hot days now (above 109°F)
- 7 days/yr
- Hot days in 30 yrs
- 24 days/yr
Wind risk 9/10 · Severe
- Chance of severe wind over 30 yrs
- 99.0%
Air-quality risk 2/10 · Minimal
- Unhealthy air days now
- 2 days/yr
- Unhealthy air days in 30 yrs
- 2 days/yr
Risk factors via First Street. Map © Google.
Why this score? — see what drove the C- grade
The composite is a weighted blend of 9 inputs, each scored 0–100. Each bar is that input's sub-score; the figure is the points it added to the 100-point composite (weight × sub-score).
- Cash flow +13.5/30.0
- ARV discount +13.2/15.0
- Appreciation +6.3/10.0
- DSCR +4.1/10.0
- 1% rule +4.0/10.0
- Livability +3.7/5.0
- Rent growth +2.8/5.0
- Schools +2.7/10.0
- Condition / age +2.5/5.0
$193,500
🖨 Deal sheet 📄 Offer letter ✓ Due diligence
Listing remarks MLS
VACANT, Charming one-story brick home nestled among mature trees. Inside, you’ll find a bright and inviting layout with no carpet, allowing for easy maintenance. The kitchen features stainless steel appliances and direct access to the backyard, perfect for entertaining. Natural light flows throughout the home, highlighting the spacious living room, cozy family room, and formal dining area. With 3 bedrooms and 2 full bathrooms, this home offers comfort and functionality. Enjoy a private, fenced backyard ideal for relaxing or gatherings. Great opportunity for investors.
Key facts
- One story brick home
- 5,745 sq ft lot
- Garage
Tags
Neighborhood map
What this means for you Summary
Snapshot
- This is a 3-bed/2.0-bath single-family listed at $194k.
Deal economics
- At list price, monthly cash flow is $8 ($101/yr) — positive.
- The deal already cash-flows at list — no discount required.
- To meet the 1% rule (rent ≥ 1% of price), the offer needs to be $175k (9.7% below list).
- Recommended offer: $170k (12.0% below list) — sets the bar for market timing.
- Cap rate 6.3% vs local median 3.2% in Houston — top-decile yield for the area; either an underpriced asset or a hidden risk that comps aren't pricing in. Stress-test before assuming the spread holds.
Location & tenants
- Location reads 74/100 on livability (#184 in TX, #4,771 nationally) — a middle-class / working-renter tenant base. Strengths: amenities A+, cost of living A+, housing A+; Watch: schools D, crime F.
- Houston ISD (urban): math 27% / reading 35% proficiency, ranked #593 of 826 in TX (top 72%) — families likely to look elsewhere, expect single-tenant / working-renter base with shorter leases; 71% free/reduced lunch — lower-income household profile, screen leases tightly.
- Market conditions: Rents rising (+1.2%/yr); 303 active listings in the ZIP; 26 comparable units currently listed for rent nearby; rentals leasing fast (median 12d on market — plan ~1-2 weeks tenant-placement turnaround); 29,883 units permitted in Harris County in 2024 (8,621 in 5+ unit buildings).
- This rent runs 37% of the median local income ($57k/yr) — at the standard rent-burdened threshold; future hikes will face affordability resistance.
Forward outlook
- In year one you build about $6k of equity ($1k loan paydown + $5k appreciation (2.6% local appreciation)).
- Harris County population projected at +47% by 2050 — long-run rental-demand tailwind backs the buy-and-hold thesis.
- At projected returns (2.6% appreciation + 1.2% rent growth), your $54k cash investment doubles in ~8 years — after that, you're playing with house money.
- By year 6, paydown + projected appreciation supports a ~$34k cash-out refi (75% LTV) — recoverable capital for the next deal without selling this one.
Negotiation context
- It's been on market 141 days — a 12% lower offer ($170k) is reasonable based on typical stale-listing flexibility.
- 11 sale attempts since 11y ago with the ask held roughly flat each time — persistent listings suggest the price (not the market) is what's stuck; bring a comps-based counter.
Risks & watch-outs
- Climate carrying-cost: severe wind risk, 99% chance of damaging wind over 30y; extreme-heat days projected 7→24/yr by 2055 (HVAC capex compounding) — expect insurance premiums to compound above CPI over the hold.
Questions for the listing agent
- It's been on market 141 days. Have you received any prior offers? Is the seller open to a 12% concession, seller financing, or rate buy-down credit?
- Built in 1978 — when were the roof, HVAC, electrical panel, plumbing, and water heater last replaced?
- Why hasn't it sold? Are there any deal-killer items the seller is aware of (foundation, flood, title, zoning, code violations)?
- Is there a deadline driving the sale (1031 exchange, divorce, estate, relocation)? That informs how much negotiation room exists.
- Schools are D-rated, which usually means shorter tenancies and higher turnover. Who's the typical renter profile here, and what's been the actual vacancy rate?
- Crime grade is F in this area — have there been break-ins, vandalism, or insurance claims at this property in the last 3 years? What carrier currently insures it and at what premium?
- What's the average days-on-market for RENTAL listings here right now (not sales)? A rising rental-DOM trend means longer vacancies and softer asking-rent achievability than the comps imply.
- What's the recent tenant-quality profile in this submarket — average credit score on applications, eviction rate, late-payment / NSF rate, and stable-employment percentage? A property-management company in the area should have these aggregated.
- How much new for-sale + rental construction is in the pipeline within 1–3 miles? Heavy new supply typically softens prices + rents 12–24 months out; constrained supply supports both.
Investment metrics
- 1% rule
- 0.90% ✗
- Cap rate
- 6.35%
- Cash-on-cash
- 0.19%
- DSCR
- 1.01
- GRM
- 9.2
CMA / ARV
- ARV (median comp)
- $221,344
- List price
- $193,500
- Delta
- -12.58%
- Verdict
- UNDERPRICED
- Comps
- 20 within 1.0 mi
Show comp detail 12 sales within ~0.75 mi
| Address | Dist | Beds/Ba | Sqft | Sold | Price | $/sf | Match |
|---|---|---|---|---|---|---|---|
| 4218 Richmeadow Dr | 0.28mi | 3/2.0 | 1,388 (+4%) | 0mo | $238,500 | $172 | 79 |
| 5227 Honeyvine Dr | 0.38mi | 3/2.0 | 1,407 (+6%) | 2mo | $199,000 | $141 | 70 |
| 12123 Murr Way | 0.25mi | 3/2.0 | 1,476 (+11%) | 6mo | $225,000 | $152 | 65 |
| 12002 Comfort Glen Ct | 0.66mi | 3/2.0 | 1,400 (+5%) | 3mo | $189,900 | $136 | 58 |
| 12935 Rockford Dr | 0.56mi | 3/2.0 | 1,444 (+9%) | 4mo | $220,000 | $152 | 56 |
| 11926 Panay Dr | 0.48mi | 3/2.0 | 1,494 (+12%) | 2mo | $230,000 | $154 | 55 |
| 4807 Tili And Gili St | 0.70mi | 3/2.5 | 1,423 (+7%) | 2mo | $249,990 | $176 | 52 |
| 5313 Basquiat Dr | 0.59mi | 4/2.0 (+1) | 1,427 (+8%) | 4mo | $279,538 | $196 | 52 |
| 4821 Peanut Butter And Jelly Dr | 0.70mi | 3/2.5 | 1,423 (+7%) | 4mo | $269,990 | $190 | 50 |
| 12916 Ami And Tami Pl | 0.70mi | 3/2.5 | 1,423 (+7%) | 6mo | $249,990 | $176 | 48 |
| 12821 Donegal Way | 0.51mi | 4/2.0 (+1) | 1,512 (+14%) | 1mo | $239,000 | $158 | 47 |
| 12027 Duane St | 0.53mi | 4/2.0 (+1) | 1,504 (+13%) | 4mo | $248,000 | $165 | 45 |
Match score weights: distance 35% · size 25% · config 20% · recency 20%. Top-matched comps best support the ARV.
Projected returns pro-forma
2.61% appreciation · 1.17% rent growth · sell at horizon
- IRR
- 5.6%
- Equity multiple
- 1.31×
- Total profit
- $16,790
- Equity at exit
- $82,807
- IRR
- 7.9%
- Equity multiple
- 2.11×
- Total profit
- $60,097
- Equity at exit
- $124,443
Cash invested: $54,180 (down + closing). Projections, not guarantees.
Landlord ↔ Tenant lean methodology
- Overall (STATE)
- 87 Strongly Landlord-Friendly
- State Texas
- 87 Strongly Landlord-Friendly · R+5
- County
- — inherits STATE
- City
- — inherits STATE
ZIP-level market 77048
- Home prices YoY
- 1.0%
- Rents YoY
- 1.2%
- Active inventory
- 303
- Price-to-rent
- 9.2×
Monthly cashflow live
- Estimated rent
- $1,747 high interval (Pro) →
- Mortgage (P&I)
- −$1,015
- Tax from tax record
- −$276 /mo · $3,314/yr
- Insurance
- −$81
- HOA
- −$0
- Vacancy / Maint / Mgmt
- −$367
- Net cashflow
- $8
Break-even live
UW: 25.0% down · 7.5% · 30yr · 1.5% tax · 5.0% vac · 8.0% maint · 8.0% mgmt
Financing live
Cash to close
- Down payment
- $48,375
- Closing costs
- $5,805
- Reserves months
- —
- Total cash needed
- —
Loan-product check · same deal, 3 products live
Conventional
25% down · 7.5% · 30yr
- Down + closing
- —
- Monthly P&I
- —
- Monthly cashflow
- —
- DSCR
- —
- Eligible?
- —
Personal DTI + credit; lowest rate.
DSCR
20% down · 8.5% · 30yr
- Down + closing
- —
- Monthly P&I
- —
- Monthly cashflow
- —
- DSCR
- —
- Eligible?
- —
No personal income docs; deal must DSCR.
Hard money
10% down · 12.0% · 12mo
- Down + closing
- —
- Monthly P&I
- —
- Monthly cashflow
- —
- DSCR
- —
- Eligible?
- —
Short-term bridge; refi at stabilization.
Rent comps 26 comps
| Address | Beds | Baths | Sqft | Rent | $/sqft | DOM | Units | Dist |
|---|---|---|---|---|---|---|---|---|
| 12210 Roandale Dr Houston, TX | 3.0 | 2.0 | 1738 | $1,775 | $1.02 | 44d | 1 | 0.13mi |
| 12227 Cape Hyannis Dr Houston, TX | 3.0 | 2.0 | 1432 | $1,705 | $1.19 | 14d | 1 | 0.18mi |
| 12207 Duane Ct Houston, TX | 3.0 | 2.0 | 1548 | $1,691 | $1.09 | 8d | 1 | 0.45mi |
| 3918 Almeda-Genoa Rd Houston, TX | 1.0–3.0 | 1.0–2.0 | 1038 | $2,220 | $2.14 | 2d | 26 | 0.72mi |
| 4015 Marchant Rd Houston, TX | 3.0 | 2.0 | 1200 | $1,700 | $1.42 | 44d | 1 | 0.73mi |
| 5425 E Orem Dr Houston, TX | 1.0–4.0 | 1.0–2.0 | 1040 | $1,472 | $1.42 | 5d | 13 | 0.78mi |
| 13555 Cullen Blvd Houston, TX | 1.0–3.0 | 1.0–2.0 | 917 | $1,900 | $2.07 | 44d | 35 | 0.78mi |
| 13561 Cullen Blvd Houston, TX | 2.0 | 2.0 | 990 | $1,450 | $1.46 | 44d | 1 | 0.80mi |
| 11319 Murr Way Houston, TX | 3.0 | 1.5 | 1213 | $1,699 | $1.40 | 19d | 1 | 0.90mi |
| 11819 Leitrim Way Houston, TX | 3.0 | 1.0 | 1476 | $1,150 | $0.78 | 5d | 1 | 0.91mi |
| 4814 Centipede Rd Unit B Houston, TX | 3.0 | 2.5 | 1701 | $1,950 | $1.15 | 22d | 1 | 0.92mi |
| 13311 Lucky Bill Ln Houston, TX | 3.0 | 2.5 | 1597 | $2,250 | $1.41 | 44d | 1 | 1.15mi |
| 4071 Schurmier Rd Unit SLC2 Houston, TX | 2.0 | 2.0 | 990 | $1,575 | $1.59 | 3d | 1 | 1.16mi |
| 5602 Selinsky Rd Unit 422 Houston, TX | 2.0 | 2.0 | 1062 | $1,089 | $1.03 | 8d | 1 | 1.16mi |
| 5602 Selinsky Rd Unit 5659 Houston, TX | 2.0 | 2.0 | 1062 | $1,113 | $1.05 | 11d | 1 | 1.16mi |
| 5602 Selinsky Rd Unit 421 Houston, TX | 2.0 | 2.0 | 1062 | $1,089 | $1.03 | 5d | 1 | 1.16mi |
| 5602 Selinsky Rd Unit 510 Houston, TX | 3.0 | 2.0 | 1167 | $1,313 | $1.13 | 11d | 1 | 1.16mi |
| 5602 Selinsky Rd Unit 3187 Houston, TX | 3.0 | 2.0 | 1167 | $1,281 | $1.10 | 3d | 1 | 1.16mi |
| 5602 Selinsky Rd Unit 2187 Houston, TX | 2.0 | 2.0 | 1062 | $1,081 | $1.02 | 3d | 1 | 1.16mi |
| 5602 Selinsky Rd Unit 2047 Houston, TX | 2.0 | 2.0 | 1062 | $1,113 | $1.05 | 3d | 1 | 1.16mi |
| 5602 Selinsky Rd Unit 3047 Houston, TX | 3.0 | 2.0 | 1167 | $1,324 | $1.13 | 11d | 1 | 1.16mi |
| 13427 Lucky Bill Ln Houston, TX | 3.0 | 2.5 | 1443 | $2,095 | $1.45 | 8d | 1 | 1.24mi |
| 13442 Lucky Bill Ln Houston, TX | 3.0 | 2.0 | 1427 | $2,195 | $1.54 | 22d | 1 | 1.26mi |
| 5426 Greylog Dr Houston, TX | 3.0 | 2.0 | 1205 | $1,750 | $1.45 | 24d | 1 | 1.27mi |
| 13958 Cottingham St Houston, TX | 1.0–2.0 | 1.0–2.0 | 1048 | $1,825 | $1.74 | 2d | 35 | 1.35mi |
| 3020 Gunnersbury Dr Houston, TX | 4.0 | 2.0 | 1670 | $1,499 | $0.90 | 15d | 1 | 1.48mi |
Listing history 44 events
-
2026-06-18days on market $193,500 Active 141 DOM
-
2026-06-17days on market $193,500 Active 140 DOM
-
2026-06-16days on market $193,500 Active 139 DOM
-
2026-06-15days on market $193,500 Active 138 DOM
-
2026-06-13days on market $193,500 Active 136 DOM
-
2026-06-10days on market $193,500 Active 132 DOM
-
2026-06-08days on market $193,500 Active 131 DOM
-
2026-06-07days on market $193,500 Active 130 DOM
-
2026-06-04days on market $193,500 Active 127 DOM
-
2026-06-01days on market $193,500 Active 124 DOM
-
2026-05-31days on market $193,500 Active 123 DOM
-
2026-05-19price $193,500 580-char remark
Show marketing remark (580 chars)
VACANT, Charming one-story brick home nestled among mature trees. Inside, you’ll find a bright and inviting layout with no carpet, allowing for easy maintenance. The kitchen features stainless steel appliances and direct access to the backyard, perfect for entertaining. Natural light flows throughout the home, highlighting the spacious living room, cozy family room, and formal dining area. With 3 bedrooms and 2 full bathrooms, this home offers comfort and functionality. Enjoy a private, fenced backyard ideal for relaxing or gatherings. Great opportunity for investors.
-
2026-01-28$199,990 Active 580-char remark
Show marketing remark (580 chars)
VACANT, Charming one-story brick home nestled among mature trees. Inside, you’ll find a bright and inviting layout with no carpet, allowing for easy maintenance. The kitchen features stainless steel appliances and direct access to the backyard, perfect for entertaining. Natural light flows throughout the home, highlighting the spacious living room, cozy family room, and formal dining area. With 3 bedrooms and 2 full bathrooms, this home offers comfort and functionality. Enjoy a private, fenced backyard ideal for relaxing or gatherings. Great opportunity for investors.
-
2026-01-26historical
-
2025-09-12$199,990 Active
-
2025-09-09historical
-
2025-07-20$1,600
-
2025-05-27$205,000 Active
-
2025-05-23historical $1,600
-
2025-05-13historical
-
2025-04-15$1,600
-
2025-02-16historical $1,600
-
2025-01-31$1,600
-
2025-01-14$205,000 Active
-
2023-08-16historical $1,525
-
2023-07-22price $1,525
-
2023-07-17price $1,600
-
2022-02-22soldstatus
-
2021-08-03soldstatus
-
2021-08-02soldstatus Sold
-
2021-07-26status Pending
-
2021-07-19status Option Pending
-
2021-07-02$149,999 Active
-
2020-12-18soldstatus
-
2020-12-16soldstatus Sold
-
2020-12-08status Pending
-
2020-11-04$125,000 Active
-
2019-12-09historical
-
2019-09-26$139,440 Active
-
2015-05-01historical
-
2015-04-03price $89,950
-
2015-02-04$93,900 Active
-
2001-11-05soldstatus
-
1988-01-02soldstatus
ⓘ Source: listings_history table (triggers on properties + properties_extension) + one-shot
backfill from property_details.listing_events for pre-trigger history.
Tax reassessment forecast TX · Resets to sale price
- Current annual tax
- $3,314 · $276/mo
- Projected year-2 tax
- $3,541 · $295/mo
- Expected delta
- +$227/yr (+$19/mo · 6.8%)
ⓘ Screening estimate from a state-policy table — verify with the county assessor before closing.
Climate risk First Street
- Flood 1/10 Low FEMA zone X (unshaded) · 0% chance over 30 yrs
- Wildfire 1/10 Low
- Heat 9/10 Extreme 7 d/yr ≥109°F today · 24 d/yr by 30 yrs out
- Wind 9/10 Extreme 99% chance of damaging wind over 30 yrs
- Air quality 2/10 Low 2 unhealthy d/yr today · 2 by 30 yrs out
Nearby sold comps map
Loading sold comps map…
Walkable amenities ~0.75 mi
Loading nearby amenities…
Taxation est. · year 1
- Rental income
- $20,962
- − Mortgage interest
- −$10,839
- − Property taxes
- −$3,314
- − Insurance
- −$968
- − Repairs & maintenance
- −$1,677
- − Management
- −$1,677
- − Depreciation
- −$5,629
- Taxable loss
- −$3,142
- Est. tax savings @ 24.0%
- +$754
- After-tax cash flow
- $855/yr
For passive investors: Depreciation is non-cash, so a rental often shows a tax loss while cash-flowing — sheltering income. Rental losses are passive: they offset passive income freely, and up to $25,000/yr can offset ordinary (W-2) income if you actively participate and your MAGI is under $100k (phasing out to $0 by $150k); unused losses carry forward. On sale, claimed depreciation is recaptured at up to 25%, and gains may owe capital-gains tax (a 1031 exchange can defer both). Figures are a year-1 estimate at your 24.0% rate — not tax advice; consult a CPA.
Schools (NCES district)
- District
- Houston ISD
- NCES district ID
- 4823640
- Math proficiency
- 27% ▼ -18.00%
- Reading proficiency
- 35% ▼ -6.00%
- Median HH income
- $46,054
- Composite
- 26.63/100
- National rank
- #7173
- State rank
- #593 of 826 in TX
Livability — Houston
- Score
- 74/100
- State rank
- #184
- US rank
- #4771
Category grades
Schools grade is shown separately in the Schools card above.
Census & demographics
- Census place
- Houston, TX
- County
- Harris County · 4,702,590 people
- City population
- 3,226,434
- Metro
- Houston-The Woodlands-Sugar Land, TX
- Population (ZIP)
- 21,151
- Household income
- $56,747
- Rent vs Own
- Severe rent burden
- 1117.0
Population outlook (Harris County) Hauer SSP2
- Today (2025)
- 5,571,493 people
- By 2030
- 6,089,821 · +9.3%
- By 2040
- 7,142,806 · +28.2%
- By 2050
- 8,185,864 · +46.9%
- By 2075
- 10,574,329 · +89.8%
- By 2100
- 12,109,958 · +117.4%
Race, ethnicity, and origin ACS 2023
- Neighborhood character
- Predominantly Black (69%)
- Race & ethnicity
- Black 69% Hispanic / Latino 24% Two or more races 6% Asian 3% White 2%
- Hispanic origin (detail)
- Mexican 17% Puerto Rican 1%
- Foreign-born
- 12% · Canada, Vietnam
- Languages at home
- 76% English-only · Spanish 20% Tagalog/Filipino 2% Vietnamese 1%
Political lean MEDSL · Harris
- 2024 margin
- Lean D (+5.5) · D 52.0% · R 46.4% · Other 1.6%
- 2008→2024 swing
- +3.9pp toward D · 2008: 1.6pp · 2024: 5.5pp
- All cycles
- 2024: D+5.5 2020: D+13.3 2016: D+12.4 2012: D+0.1 2008: D+1.6
Not yet ingested
- Civics
- —
Market trends
- HPI YoY
- ▲ 2.61%
- Current HPI
- 266.4468
- Rent YoY
- ▲ 1.17%
- Metro
- Houston-The Woodlands-Sugar Land, TX
- State GDP YoY
- ▲ 3.95%
- F500 in state
- 110
Industry mix (Fortune 500 HQ in TX)
| Industry | F500 HQs | Revenue |
|---|---|---|
| Energy | 16 | $1,198B |
|
||
| Technology | 5 | $198B |
|
||
| Engineering / Construction | 4 | $72B |
|
||
| Energy Services | 3 | $60B |
|
||
| Utilities | 3 | $41B |
|
||
| Healthcare | 2 | $330B |
|
||
Price history
+106.1% since first listed33 events — show timeline
- 2026-05-19 Price Changed $193,500 HARMLS
- 2026-01-28 Listed $199,990 HARMLS
- 2026-01-26 Listing Removed — HARMLS
- 2025-09-12 Listed $199,990 HARMLS
- 2025-09-09 Listing Removed — HARMLS
- 2025-07-20 Listed for Rent $1,600 APPFOLIO
- 2025-05-27 Listed $205,000 HARMLS
- 2025-05-23 Rental Removed $1,600 APPFOLIO
- 2025-05-13 Listing Removed — HARMLS
- 2025-04-15 Listed for Rent $1,600 APPFOLIO
- 2025-02-16 Rental Removed $1,600 APPFOLIO
- 2025-01-31 Listed for Rent $1,600 APPFOLIO
- 2025-01-14 Listed $205,000 HARMLS
- 2023-08-16 Rental Removed $1,525 HARMLS
- 2023-07-22 Price Changed $1,525 HARMLS
- 2023-07-17 Price Changed $1,600 HARMLS
- 2022-02-22 Sold (Public Records) — Public Records
- 2021-08-03 Sold (Public Records) — Public Records
- 2021-08-02 Sold (MLS) — HARMLS
- 2021-07-26 Pending — HARMLS
- 2021-07-19 Pending — HARMLS
- 2021-07-02 Listed $149,999 HARMLS
- 2020-12-18 Sold (Public Records) — Public Records
- 2020-12-16 Sold (MLS) — HARMLS
- 2020-12-08 Pending — HARMLS
- 2020-11-04 Listed $125,000 HARMLS
- 2019-12-09 Listing Removed — HARMLS
- 2019-09-26 Listed $139,440 HARMLS
- 2015-05-01 Listing Removed — HARMLS
- 2015-04-03 Price Changed $89,950 HARMLS
- 2015-02-04 Listed $93,900 HARMLS
- 2001-11-05 Sold (Public Records) — Public Records
- 1988-01-02 Sold (Public Records) — Public Records
Property tax history
+3.4%/yrLatest (2025): $3,314 · +21.9% YoY. Source: county tax records.
Cash-flow waterfall
monthlySold comps — $/sqft
last 12 mo · ≤1 miLoading sold comps…