1318 Richton Rd · Montgomery, AL
Flood risk 1/10 · Minimal
- FEMA flood zone
- X (unshaded)
- Chance of flooding over 30 yrs
- 0.0%
- Est. flood insurance / yr
- $507 – $1,088
Fire risk 4/10 · Minor
- Est. fire insurance / yr
- $916 – $1,700
Heat risk 8/10 · Major
- Hot days now (above 107°F)
- 7 days/yr
- Hot days in 30 yrs
- 21 days/yr
Wind risk 8/10 · Major
- Chance of severe wind over 30 yrs
- 80.0%
Air-quality risk 3/10 · Minor
- Unhealthy air days now
- 3 days/yr
- Unhealthy air days in 30 yrs
- 3 days/yr
Risk factors via First Street. Map © Google.
Why this score? — see what drove the C- grade
The composite is a weighted blend of 9 inputs, each scored 0–100. Each bar is that input's sub-score; the figure is the points it added to the 100-point composite (weight × sub-score).
- Cash flow +17.7/30.0
- ARV discount +15.0/15.0
- DSCR +5.6/10.0
- 1% rule +3.6/10.0
- Rent growth +3.2/5.0
- Livability +3.2/5.0
- Condition / age +2.5/5.0
- Schools +1.7/10.0
- Appreciation +0.0/10.0
$260,500
🖨 Deal sheet 📄 Offer letter ✓ Due diligence
Listing remarks MLS
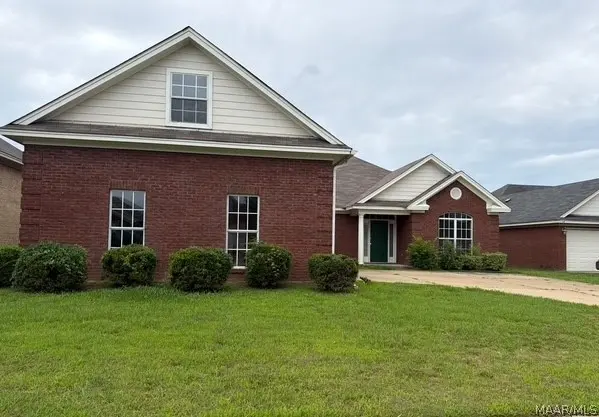
Welcome to Thorington Trace! This warm family home sits in a quiet cul-de-sac and features 4 bedrooms & 2 baths. Huge bonus room above garage is outfitted with 2 closets to be a 5th bedroom or rec room. Family room is bright and able to accommodate larger furniture. The open kitchen has sunny breakfast area & leads to the covered patio and large back yard. The main bedroom & bath is on one side of the home with additional bedroom. The owner's bath has separate vanities, tile shower and soaking tub. Two additional large bedrooms off kitchen with full bath, laundry room with pocket door and stairs to bonus room. The hall bath features a double vanity, tons of storage and a tiled shower/bathtub. Coming in from the oversized garage, there is space to have storage for bags & backpacks. Come take a tour today, this sweet home is ready for new owners!
Key facts
- Large bonus room
- Quiet cul-de-sac
- 8,712 sq ft lot
Tags
Property features AI
Finance
- HOA & community: Homeowners association with an annual fee of $200
Exterior
- Parking: Attached 2-car garage
- Utilities: Public water; Public sewer; Electricity available; Natural gas available; Cable available
- Home design: Located on a cul-de-sac; City lot; Slab foundation
- Construction: Brick construction; Home warranty included
- Exterior features: Covered patio; Fully fenced yard; Patio
Interior
- Kitchen: Eat-in kitchen; Breakfast nook; Dishwasher; Garbage disposal; Electric water heater
- Bedrooms: Three bedrooms on the first floor; Bonus room on the second floor
- Flooring: Carpet; Tile; Wood
- Bathrooms: Two full bathrooms
- Heating & cooling: Central heating (electric); Central air conditioning (electric)
- Interior features: Breakfast bar; Living/Dining room configuration; Gas log fireplace (one)
- Laundry & utility: First-floor laundry
Neighborhood map
What this means for you Summary
Snapshot
- This is a 4-bed/2.0-bath single-family listed at $260k.
Deal economics
- At list price, monthly cash flow is $212 ($3k/yr) — positive.
- The deal already cash-flows at list — no discount required.
- To meet the 1% rule (rent ≥ 1% of price), the offer needs to be $224k (14.1% below list).
- Recommended offer: $224k (14.1% below list) — sets the bar for 1% rule.
- Cap rate 7.3% vs local median 6.0% in Montgomery — meaningfully above typical; check what's discounted (condition, days-on-market, listing class) to confirm the premium yield is real.
Location & tenants
- Location reads 65/100 on livability (#138 in AL) — a middle-class / working-renter tenant base. Strengths: cost of living A+, housing A+; Watch: schools C-, employment D, crime F.
- Montgomery County (urban): math 9% / reading 31% proficiency, ranked #106 of 129 in AL (top 82%) — low school quality limits family demand, transient renter base, plan for 1-2y turnover; 70% free/reduced lunch — lower-income household profile, screen leases tightly.
- Market conditions: Rents rising (+3.0%/yr); 407 active listings in the ZIP; 8 comparable units currently listed for rent nearby; rentals at typical pace (median 21d on market — plan ~3-4 weeks tenant-placement turnaround); 460 units permitted in Montgomery County in 2024 (37 in 5+ unit buildings).
- This rent runs 36% of the median local income ($75k/yr) — at the standard rent-burdened threshold; future hikes will face affordability resistance.
Forward outlook
- Local home prices are declining (-3.0%/yr); year-one equity from $2k of loan paydown is wiped out by about $8k of value loss. Plan a longer hold.
- Montgomery County population projected to shrink 8% by 2050 — rents likely to lag national; underwrite the cash flow, not the appreciation.
Negotiation context
- It's been on market 16 days — a 2% lower offer ($257k) is reasonable based on typical stale-listing flexibility.
- 2 sale attempts since 7y ago with the ask held roughly flat each time — persistent listings suggest the price (not the market) is what's stuck; bring a comps-based counter.
- Current owner paid $218k; 19% above their basis — modest negotiation headroom, anchor on the comps not their cost.
Risks & watch-outs
- Climate carrying-cost: severe wind risk, 80% chance of damaging wind over 30y; extreme-heat days projected 7→21/yr by 2055 (HVAC capex compounding) — expect insurance premiums to compound above CPI over the hold.
Questions for the listing agent
- What does the HOA fee cover, when was the last increase, and are there any pending special assessments or reserve-fund shortfalls?
- Is there a deadline driving the sale (1031 exchange, divorce, estate, relocation)? That informs how much negotiation room exists.
- Crime grade is F in this area — have there been break-ins, vandalism, or insurance claims at this property in the last 3 years? What carrier currently insures it and at what premium?
- What's the average days-on-market for RENTAL listings here right now (not sales)? A rising rental-DOM trend means longer vacancies and softer asking-rent achievability than the comps imply.
- What's the recent tenant-quality profile in this submarket — average credit score on applications, eviction rate, late-payment / NSF rate, and stable-employment percentage? A property-management company in the area should have these aggregated.
- How much new for-sale + rental construction is in the pipeline within 1–3 miles? Heavy new supply typically softens prices + rents 12–24 months out; constrained supply supports both.
Investment metrics
- 1% rule
- 0.86% ✗
- Cap rate
- 7.27%
- Cash-on-cash
- 3.49%
- DSCR
- 1.16
- GRM
- 9.7
CMA / ARV
- ARV (on-the-fly)
- $330,959
- Comps found
- 12
Show comp detail 12 sales within ~0.75 mi
| Address | Dist | Beds/Ba | Sqft | Sold | Price | $/sf | Match |
|---|---|---|---|---|---|---|---|
| 8518 Pipit Ct | 0.25mi | 3/2.5 (-1) | 2,303 (-3%) | 2mo | $310,000 | $135 | 74 |
| 9500 Greythorne Ct | 0.26mi | 4/3.0 | 2,233 (-6%) | 3mo | $323,000 | $145 | 71 |
| 9400 Kettlewell Ct | 0.45mi | 4/3.0 | 2,405 (+1%) | 5mo | $330,000 | $137 | 69 |
| 8725 Carillion Pl | 0.38mi | 3/2.0 (-1) | 2,265 (-5%) | 1mo | $310,000 | $137 | 68 |
| 9419 Broadleaf Dr | 0.40mi | 4/2.5 | 2,243 (-6%) | 7mo | $312,000 | $139 | 64 |
| 9506 Greythorne Way | 0.19mi | 4/2.0 | 2,039 (-14%) | 7mo | $291,000 | $143 | 61 |
| 8731 Carillion Pl | 0.39mi | 4/3.0 | 2,592 (+9%) | 4mo | $366,000 | $141 | 60 |
| 9721 Helmsley Cir | 0.64mi | 4/3.0 | 2,267 (-5%) | 1mo | $290,000 | $128 | 58 |
| 9212 Harrington Cir | 0.54mi | 4/2.0 | 2,066 (-13%) | 3mo | $320,000 | $155 | 51 |
| 9283 Berrington Pl | 0.67mi | 4/3.5 | 2,521 (+6%) | 5mo | $319,900 | $127 | 49 |
| 9238 Berrington Pl | 0.71mi | 4/3.0 | 2,667 (+12%) | 1mo | $330,000 | $124 | 42 |
| 9354 Charley Ln | 0.74mi | 4/2.5 | 2,682 (+13%) | 4mo | $422,034 | $157 | 39 |
Match score weights: distance 35% · size 25% · config 20% · recency 20%. Top-matched comps best support the ARV.
Projected returns pro-forma
-3.0% appreciation · 2.99% rent growth · sell at horizon
- IRR
- -10.9%
- Equity multiple
- 0.60×
- Total profit
- $-28,842
- Equity at exit
- $38,841
- IRR
- -1.7%
- Equity multiple
- 0.89×
- Total profit
- $-8,284
- Equity at exit
- $22,523
Cash invested: $72,940 (down + closing). Projections, not guarantees.
Landlord ↔ Tenant lean methodology
- Overall (STATE)
- 90 Strongly Landlord-Friendly
- State Alabama
- 90 Strongly Landlord-Friendly · R+15
- County
- — inherits STATE
- City
- — inherits STATE
ZIP-level market 36117
- Home prices YoY
- -20.0%
- Rents YoY
- 3.0%
- Active inventory
- 407
- Price-to-rent
- 9.7×
Monthly cashflow live
- Estimated rent
- $2,238 high interval (Pro) →
- Mortgage (P&I)
- −$1,366
- Tax from tax record
- −$65 /mo · $776/yr
- Insurance
- −$109
- HOA
- −$17
- Vacancy / Maint / Mgmt
- −$470
- Net cashflow
- $212
Break-even live
UW: 25.0% down · 7.5% · 30yr · 1.5% tax · 5.0% vac · 8.0% maint · 8.0% mgmt
Financing live
Cash to close
- Down payment
- $65,125
- Closing costs
- $7,815
- Reserves months
- —
- Total cash needed
- —
Loan-product check · same deal, 3 products live
Conventional
25% down · 7.5% · 30yr
- Down + closing
- —
- Monthly P&I
- —
- Monthly cashflow
- —
- DSCR
- —
- Eligible?
- —
Personal DTI + credit; lowest rate.
DSCR
20% down · 8.5% · 30yr
- Down + closing
- —
- Monthly P&I
- —
- Monthly cashflow
- —
- DSCR
- —
- Eligible?
- —
No personal income docs; deal must DSCR.
Hard money
10% down · 12.0% · 12mo
- Down + closing
- —
- Monthly P&I
- —
- Monthly cashflow
- —
- DSCR
- —
- Eligible?
- —
Short-term bridge; refi at stabilization.
Rent comps 8 comps
| Address | Beds | Baths | Sqft | Rent | $/sqft | DOM | Units | Dist |
|---|---|---|---|---|---|---|---|---|
| 1136 Hallwood Ln Montgomery, AL | 3.0 | 2.0 | 1909 | $2,100 | $1.10 | 13d | 1 | 0.21mi |
| 9832 Helmsley Cir Montgomery, AL | 4.0 | 2.5 | 2050 | $2,300 | $1.12 | 13d | 1 | 0.41mi |
| 8829 Ashland Park Pl Montgomery, AL | 3.0 | 2.0 | 1636 | $2,000 | $1.22 | 21d | 1 | 0.61mi |
| 9661 Colleton Pl Montgomery, AL | 3.0 | 2.0 | 1721 | $2,000 | $1.16 | 43d | 1 | 0.65mi |
| 9211 Hanston Pl Montgomery, AL | 4.0 | 2.0 | 2164 | $2,395 | $1.11 | 44d | 1 | 0.78mi |
| 9320 Sturbridge Pl Montgomery, AL | 4.0 | 2.5 | 2971 | $2,600 | $0.88 | 21d | 1 | 1.12mi |
| 9131 Thetford Way Montgomery, AL | 4.0 | 4.0 | 3165 | $3,100 | $0.98 | 21d | 1 | 1.36mi |
| 8318 Chadburn Way Montgomery, AL | 4.0 | 2.5 | 2621 | $3,100 | $1.18 | 43d | 1 | 1.47mi |
HOA detail
- Monthly dues
- $17 · $204/yr
Listing history 12 events
-
2026-06-18days on market $260,500 Active 16 DOM
-
2026-06-17days on market $260,500 Active 15 DOM
-
2026-06-16days on market $260,500 Active 14 DOM
-
2026-06-15days on market $260,500 Active 13 DOM
-
2026-06-14days on market $260,500 Active 11 DOM
-
2026-06-13days on market $260,500 Active 10 DOM
-
2026-06-10days on market $260,500 Active 8 DOM
-
2026-06-09days on market $260,500 Active 7 DOM
-
2026-06-08days on market $260,500 Active 6 DOM
-
2026-06-07days on market $260,500 Active 5 DOM
-
2026-06-03remarks 699-char remark
-
2026-06-03$260,500 Active 1 DOM
ⓘ Source: listings_history table (triggers on properties + properties_extension) + one-shot
backfill from property_details.listing_events for pre-trigger history.
Tax reassessment forecast AL · Resets to sale price
- Current annual tax
- $776 · $65/mo
- Projected year-2 tax
- $1,068 · $89/mo
- Expected delta
- +$292/yr (+$24/mo · 37.7%)
ⓘ Screening estimate from a state-policy table — verify with the county assessor before closing.
Climate risk First Street
- Flood 1/10 Low FEMA zone X (unshaded) · 0% chance over 30 yrs
- Wildfire 4/10 Moderate
- Heat 8/10 Severe 7 d/yr ≥107°F today · 21 d/yr by 30 yrs out
- Wind 8/10 Severe 80% chance of damaging wind over 30 yrs
- Air quality 3/10 Moderate 3 unhealthy d/yr today · 3 by 30 yrs out
Nearby sold comps map
Loading sold comps map…
Walkable amenities ~0.75 mi
Loading nearby amenities…
Taxation est. · year 1
- Rental income
- $26,862
- − Mortgage interest
- −$14,592
- − Property taxes
- −$776
- − Insurance
- −$1,302
- − Repairs & maintenance
- −$2,149
- − Management
- −$2,149
- − HOA
- −$204
- − Depreciation
- −$7,578
- Taxable loss
- −$1,889
- Est. tax savings @ 24.0%
- +$453
- After-tax cash flow
- $2,999/yr
For passive investors: Depreciation is non-cash, so a rental often shows a tax loss while cash-flowing — sheltering income. Rental losses are passive: they offset passive income freely, and up to $25,000/yr can offset ordinary (W-2) income if you actively participate and your MAGI is under $100k (phasing out to $0 by $150k); unused losses carry forward. On sale, claimed depreciation is recaptured at up to 25%, and gains may owe capital-gains tax (a 1031 exchange can defer both). Figures are a year-1 estimate at your 24.0% rate — not tax advice; consult a CPA.
Schools (NCES district)
- District
- Montgomery County
- NCES district ID
- 0102430
- Math proficiency
- 9% ▼ -21.00%
- Reading proficiency
- 31% ▼ -1.00%
- Median HH income
- $43,902
- Composite
- 17.24/100
- National rank
- #9093
- State rank
- #106 of 129 in AL
Livability — Montgomery
- Score
- 65/100
- State rank
- #138
- US rank
- #13416
Category grades
Schools grade is shown separately in the Schools card above.
Census & demographics
- Census place
- Montgomery, AL
- County
- Montgomery County · 190,016 people
- City population
- 175,913
- Metro
- Montgomery, AL
- Population (ZIP)
- 53,172
- Household income
- $74,720
- Rent vs Own
- Severe rent burden
- 1742.0
Population outlook (Montgomery County) Hauer SSP2
- Today (2025)
- 224,008 people
- By 2030
- 221,460 · -1.1%
- By 2040
- 214,179 · -4.4%
- By 2050
- 204,912 · -8.5%
- By 2075
- 177,821 · -20.6%
- By 2100
- 145,134 · -35.2%
Race, ethnicity, and origin ACS 2023
- Neighborhood character
- Diverse neighborhood (Simpson 0.60)
- Race & ethnicity
- Black 53% White 34% Asian 8% Two or more races 3% Hispanic / Latino 3%
- Common ancestry
- Italian 1% Slovak 1% Lithuanian 1%
- Foreign-born
- 9% · South Korea, Canada, China
- Languages at home
- 90% English-only · Korean 4% Spanish 3% Other Indo-European 1%
Political lean MEDSL · Montgomery
- 2024 margin
- Solid D (+30.7) · D 64.8% · R 34.1% · Other 1.1%
- 2008→2024 swing
- +11.5pp toward D · 2008: 19.2pp · 2024: 30.7pp
- All cycles
- 2024: D+30.7 2020: D+31.5 2016: D+26.2 2012: D+24.3 2008: D+19.2
Not yet ingested
- Civics
- —
Market trends
- HPI YoY
- ▼ -37.24%
- Current HPI
- 148.7728
- Rent YoY
- ▲ 2.99%
- Metro
- Montgomery, AL
- State GDP YoY
- ▲ 2.94%
- F500 in state
- 4
Industry mix (Fortune 500 HQ in AL)
| Industry | F500 HQs | Revenue |
|---|---|---|
| Financial Services | 1 | $8B |
|
||
| Healthcare | 1 | $5B |
|
||
Price history
+16.9% since first listed3 events — show timeline
- 2026-06-02 Listed $260,500 MAAR
- 2020-03-13 Sold (MLS) $218,000 MAAR
- 2019-09-18 Listed $222,900 MAAR
Property tax history
-0.0%/yrLatest (2020): $776 · +2.4% YoY. Source: county tax records.
Cash-flow waterfall
monthlySold comps — $/sqft
last 12 mo · ≤1 miLoading sold comps…