 5-Plex
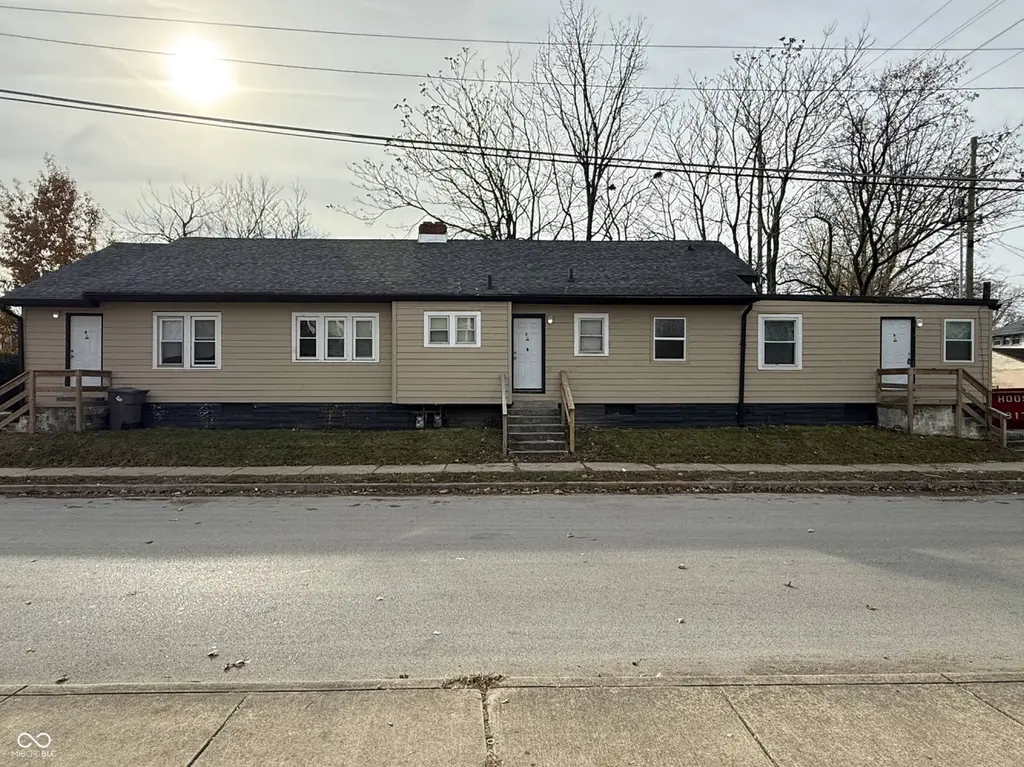
3178 N Capitol Ave · Indianapolis city (balance), IN
Flood risk 6/10 · Moderate
- FEMA flood zone
- X (unshaded)
- Chance of flooding over 30 yrs
- 0.74%
- Est. flood insurance / yr
- $473 – $860
Fire risk 1/10 · Minimal
- Est. fire insurance / yr
- $717 – $1,331
Heat risk 3/10 · Minor
- Hot days now (above 101°F)
- 7 days/yr
- Hot days in 30 yrs
- 19 days/yr
Wind risk 2/10 · Minimal
- Chance of severe wind over 30 yrs
- 0.0%
Air-quality risk 4/10 · Minor
- Unhealthy air days now
- 5 days/yr
- Unhealthy air days in 30 yrs
- 7 days/yr
Risk factors via First Street. Map © Google.
Why this score? — see what drove the B- grade
The composite is a weighted blend of 9 inputs, each scored 0–100. Each bar is that input's sub-score; the figure is the points it added to the 100-point composite (weight × sub-score).
- Cash flow +30.0/30.0
- DSCR +10.0/10.0
- 1% rule +8.2/10.0
- ARV discount +7.5/15.0
- Rent growth +4.1/5.0
- Livability +2.5/5.0
- Condition / age +2.5/5.0
- Schools +1.4/10.0
- Appreciation +0.0/10.0
$475,000
🖨 Deal sheet (PDF) 📄 Offer letter ✓ Due diligence
Multi-family units
County records classify this as Multi-Family (2-4 Unit). Listing-text estimate: 5 units. estimate disagrees with records
Listing remarks MLS
5-unit investment property, 100% occupied and newly renovated. This turnkey opportunity currently generates $5,721 per month with long-term tenants in place. Unit turns have been completed on all units, and the property features all new siding. Basement offers additional income potential through future laundry and/or tenant storage.
Key facts
- Long-term tenants
- New siding
- Investment property
Tags
Neighborhood map
What this means for you Summary
Snapshot
- This is a 5 × 3-bed/3.0-bath units multifamily listed at $475k.
Deal economics
- At list price, monthly cash flow is $2k ($22k/yr) — positive. Per door: $372/mo.
- The deal already cash-flows at list — no discount required.
- Meets the 1% rule at list price ($6k rent vs $475k).
- Recommended offer: $446k (6.0% below list) — sets the bar for market timing.
- Cap rate 11.0% vs local median 4.4% in Indianapolis city (balance) — top-decile yield for the area; either an underpriced asset or a hidden risk that comps aren't pricing in. Stress-test before assuming the spread holds.
Location & tenants
- Location reads: area grade B — affects rentability + tenant quality, not the cash-flow math above.
- Indianapolis Public Schools (urban): math 14% / reading 20% proficiency, ranked #286 of 301 in IN (top 95%) — low school quality limits family demand, transient renter base, plan for 1-2y turnover; 77% free/reduced lunch — lower-income household profile, screen leases tightly.
- Market conditions: Rents rising fast (+6.4%/yr); 283 active listings in the ZIP; 12 comparable units currently listed for rent nearby; rentals at typical pace (median 23d on market — plan ~3-4 weeks tenant-placement turnaround); 1,906 units permitted in Marion County in 2024 (621 in 5+ unit buildings).
- At $6,261/mo this rent would consume 125% of the median local household income ($60k/yr) (locally 978% of renters already pay >50% of income on rent) — very limited rent-growth headroom before tenants either downsize or default.
Forward outlook
- Local home prices are declining (-3.0%/yr); year-one equity from $3k of loan paydown is wiped out by about $14k of value loss. Plan a longer hold.
- Marion County population projected at +18% by 2050 — long-run rental-demand tailwind backs the buy-and-hold thesis.
- At projected returns (-3.0% appreciation + 6.4% rent growth), your $133k cash investment doubles in ~6 years — after that, you're playing with house money.
Negotiation context
- It's been on market 62 days — a 6% lower offer ($446k) is reasonable based on typical stale-listing flexibility.
- 4 sale attempts since 21y ago with the ask held roughly flat each time — persistent listings suggest the price (not the market) is what's stuck; bring a comps-based counter.
- Current owner paid $37k; list at $475k implies a 1184% gain — meaningful room to come down on a strong offer.
Risks & watch-outs
- Watch-outs: built in 1925 — expect roof / HVAC / electrical / plumbing capex.
- Climate carrying-cost: major flood risk — expect insurance premiums to compound above CPI over the hold.
Questions for the listing agent
- It's been on market 62 days. Have you received any prior offers? Is the seller open to a 6% concession, seller financing, or rate buy-down credit?
- Can we see the unit-by-unit rent roll, current vacancy, and any below-market leases? What's the average tenancy length?
- What capital expenditures (roof, boiler, parking lot, exteriors) have been made in the last 5 years, and what's planned in the next 2?
- Built in 1925 — when were the roof, HVAC, electrical panel, plumbing, and water heater last replaced?
- Why hasn't it sold? Are there any deal-killer items the seller is aware of (foundation, flood, title, zoning, code violations)?
- Is there a deadline driving the sale (1031 exchange, divorce, estate, relocation)? That informs how much negotiation room exists.
- What's the average days-on-market for RENTAL listings here right now (not sales)? A rising rental-DOM trend means longer vacancies and softer asking-rent achievability than the comps imply.
- What's the recent tenant-quality profile in this submarket — average credit score on applications, eviction rate, late-payment / NSF rate, and stable-employment percentage? A property-management company in the area should have these aggregated.
- How much new apartment / multifamily construction is in the pipeline within 1–3 miles? Heavy new supply (>2% of stock underway) typically softens rents 12–24 months out; light construction supports rent growth.
Investment metrics
- 1% rule
- 1.32% ✓
- Cap rate
- 11.00%
- Cash-on-cash
- 16.80%
- DSCR
- 1.75
- GRM
- 6.3
CMA / ARV
- ARV (median comp)
- $178,868
- List price
- $475,000
- Delta
- 165.56%
- Verdict
- OVERPRICED
- Comps
- 20 within 1.0 mi
Show comp detail 3 sales within ~0.75 mi
| Address | Dist | Beds/Ba | Sqft | Sold | Price | $/sf | Match |
|---|---|---|---|---|---|---|---|
| 3547 N Illinois St | 0.52mi | 2/2.0 (+1) | 2,088 (-5%) | 1mo | $302,000 | $145 | 57 |
| 3120 Boulevard Pl | 0.16mi | 1/2.0 | 1,876 (-15%) | 20mo | $125,000 | $67 | 47 |
| 3629 Graceland Ave | 0.58mi | 2/3.0 (+1) | 2,154 (-2%) | 23mo | $110,000 | $51 | 37 |
Match score weights: distance 35% · size 25% · config 20% · recency 20%. Top-matched comps best support the ARV.
Projected returns pro-forma
-3.0% appreciation · 6.43% rent growth · sell at horizon
- IRR
- 11.7%
- Equity multiple
- 1.48×
- Total profit
- $63,959
- Equity at exit
- $70,824
- IRR
- 23.1%
- Equity multiple
- 3.31×
- Total profit
- $306,731
- Equity at exit
- $41,069
Cash invested: $133,000 (down + closing). Projections, not guarantees.
Landlord ↔ Tenant lean methodology
- Overall (STATE)
- 90 Strongly Landlord-Friendly
- State Indiana
- 90 Strongly Landlord-Friendly · R+11
- County
- — inherits STATE
- City
- — inherits STATE
ZIP-level market 46208
- Rents YoY
- 6.4%
- Active inventory
- 283
- Price-to-rent
- 31.6×
Monthly cashflow live
- Estimated rent
- $6,261 medium interval (Pro) →
- Mortgage (P&I)
- −$2,491
- Tax from tax record
- −$395 /mo · $4,741/yr
- Insurance
- −$198
- HOA
- −$0
- Vacancy / Maint / Mgmt
- −$1,315
- Net cashflow
- $1,862
Break-even live
Sensitivity live
| Price | -10% $2,131 | -5% $1,997 | +0% $1,862 | +5% $1,728 | +10% $1,593 |
|---|---|---|---|---|---|
| Rent | -10% $1,368 | -5% $1,615 | +0% $1,862 | +5% $2,110 | +10% $2,357 |
| Rate | -1.0pp $2,101 | -0.5pp $1,983 | base $1,862 | +0.5pp $1,739 | +1.0pp $1,614 |
5-unit breakdown (identical units grouped — click to expand)
| Units | Beds | Baths | Est. rent |
|---|---|---|---|
| 5× units | 3 | 3 | $6,260 |
| #1 | 3 | 3 | $1,252 |
| #2 | 3 | 3 | $1,252 |
| #3 | 3 | 3 | $1,252 |
| #4 | 3 | 3 | $1,252 |
| #5 | 3 | 3 | $1,252 |
| Total (5 units) | $6,261 | ||
UW: 25.0% down · 7.5% · 30yr · 1.5% tax · 5.0% vac · 8.0% maint · 8.0% mgmt
Financing live
Cash to close
- Down payment
- $118,750
- Closing costs
- $14,250
- Reserves months
- —
- Total cash needed
- —
Loan-product check · same deal, 3 products live
Conventional
25% down · 7.5% · 30yr
- Down + closing
- —
- Monthly P&I
- —
- Monthly cashflow
- —
- DSCR
- —
- Eligible?
- —
Personal DTI + credit; lowest rate.
DSCR
20% down · 8.5% · 30yr
- Down + closing
- —
- Monthly P&I
- —
- Monthly cashflow
- —
- DSCR
- —
- Eligible?
- —
No personal income docs; deal must DSCR.
Hard money
10% down · 12.0% · 12mo
- Down + closing
- —
- Monthly P&I
- —
- Monthly cashflow
- —
- DSCR
- —
- Eligible?
- —
Short-term bridge; refi at stabilization.
Rent comps 12 comps
| Address | Beds | Baths | Sqft | Rent | $/sqft | DOM | Units | Dist |
|---|---|---|---|---|---|---|---|---|
| 3707 N Meridian St Indianapolis, IN | 2.0 | 1.0–2.0 | 1042 | $932 | $0.89 | 44d | 1 | 0.65mi |
| 3554 Washington Blvd Indianapolis, IN | 1.0 | 1.0 | 1714 | $750 | $0.44 | 24d | 1 | 0.68mi |
| 3801 N Meridian St Indianapolis, IN | 1.0–3.0 | 1.0–2.0 | 1057 | $925 | $0.87 | 21d | 35 | 0.84mi |
| 962 W 35th St Indianapolis, IN | 2.0 | 1.0 | 1768 | $1,195 | $0.68 | 3d | 1 | 0.88mi |
| 2830 N Park Ave Indianapolis, IN | 2.0 | 3.0 | 1500 | $1,600 | $1.07 | 44d | 1 | 0.88mi |
| 3359 N College Ave Indianapolis, IN | 2.0 | 1.5 | 1450 | $1,795 | $1.24 | 11d | 1 | 0.95mi |
| 2141 N Talbott St Indianapolis, IN | 2.0 | 2.5 | 1556 | $2,600 | $1.67 | 13d | 1 | 1.24mi |
| 1331 W 34th St Indianapolis, IN | 2.0 | 1.0 | 2160 | $1,399 | $0.65 | 24d | 1 | 1.29mi |
| 2136 Central Ave Indianapolis, IN | 3.0 | 1.0–2.0 | 1325 | $2,032 | $1.53 | 2d | 33 | 1.34mi |
| 4071 N College Ave Indianapolis, IN | 2.0 | 2.5 | 2000 | $2,200 | $1.10 | 5d | 1 | 1.45mi |
| 4073 N College Ave Indianapolis, IN | 2.0 | 2.5 | 2000 | $2,500 | $1.25 | 44d | 1 | 1.45mi |
| 2124 Broadway St Unit 4 Indianapolis, IN | 1.0 | 1.0 | 2730 | $1,075 | $0.39 | 22d | 1 | 1.46mi |
Listing history 26 events
-
2026-06-21days on market $475,000 Active 62 DOM
-
2026-06-18days on market $475,000 Active 59 DOM
-
2026-06-17days on market $475,000 Active 58 DOM
-
2026-06-16days on market $475,000 Active 57 DOM
-
2026-06-15days on market $475,000 Active 56 DOM
-
2026-06-13days on market $475,000 Active 54 DOM
-
2026-06-13days on market $475,000 Active 53 DOM
-
2026-06-09days on market $475,000 Active 50 DOM
-
2026-06-08remarks 370-char remark
-
2026-06-08days on market $475,000 Active 49 DOM
-
2026-06-07days on market $475,000 Active 48 DOM
-
2026-06-03days on market $475,000 Active 44 DOM
-
2026-06-02days on market $475,000 Active 43 DOM
-
2026-06-01days on market $475,000 Active 42 DOM
-
2026-05-31days on market $475,000 Active 41 DOM
-
2026-04-20$475,000 Active 334-char remark
Show marketing remark (334 chars)
5-unit investment property, 100% occupied and newly renovated. This turnkey opportunity currently generates $5,721 per month with long-term tenants in place. Unit turns have been completed on all units, and the property features all new siding. Basement offers additional income potential through future laundry and/or tenant storage.
-
2015-07-24soldstatus $37,000 Sold 461-char remark
Show marketing remark (461 chars)
Terrific potential for an investor. In an up and coming rehab area already well under way. 3 possible units in this cute home facing Capitol. 2nd and 3rd entries face 32nd street. Hardwood floors, partially fenced, 2 car gar. underneath, MEMBERSHIP IN CHILDRENS MUSEUM INCLUDED AT THESE ADDRESSES. Close to Ivy tech, IUPUI, Med. School, Dental School, and Law school. With a little elbow grease: Live in one and use the others to pay expenses and tuition!
-
2015-07-06status Pending 461-char remark
Show marketing remark (461 chars)
Terrific potential for an investor. In an up and coming rehab area already well under way. 3 possible units in this cute home facing Capitol. 2nd and 3rd entries face 32nd street. Hardwood floors, partially fenced, 2 car gar. underneath, MEMBERSHIP IN CHILDRENS MUSEUM INCLUDED AT THESE ADDRESSES. Close to Ivy tech, IUPUI, Med. School, Dental School, and Law school. With a little elbow grease: Live in one and use the others to pay expenses and tuition!
-
2015-06-25historical Contingent - Backup Pending Contracts 461-char remark
Show marketing remark (461 chars)
Terrific potential for an investor. In an up and coming rehab area already well under way. 3 possible units in this cute home facing Capitol. 2nd and 3rd entries face 32nd street. Hardwood floors, partially fenced, 2 car gar. underneath, MEMBERSHIP IN CHILDRENS MUSEUM INCLUDED AT THESE ADDRESSES. Close to Ivy tech, IUPUI, Med. School, Dental School, and Law school. With a little elbow grease: Live in one and use the others to pay expenses and tuition!
-
2015-06-19status Active 461-char remark
Show marketing remark (461 chars)
Terrific potential for an investor. In an up and coming rehab area already well under way. 3 possible units in this cute home facing Capitol. 2nd and 3rd entries face 32nd street. Hardwood floors, partially fenced, 2 car gar. underneath, MEMBERSHIP IN CHILDRENS MUSEUM INCLUDED AT THESE ADDRESSES. Close to Ivy tech, IUPUI, Med. School, Dental School, and Law school. With a little elbow grease: Live in one and use the others to pay expenses and tuition!
-
2015-05-01historical 461-char remark
Show marketing remark (461 chars)
Terrific potential for an investor. In an up and coming rehab area already well under way. 3 possible units in this cute home facing Capitol. 2nd and 3rd entries face 32nd street. Hardwood floors, partially fenced, 2 car gar. underneath, MEMBERSHIP IN CHILDRENS MUSEUM INCLUDED AT THESE ADDRESSES. Close to Ivy tech, IUPUI, Med. School, Dental School, and Law school. With a little elbow grease: Live in one and use the others to pay expenses and tuition!
-
2015-03-09price $39,000 461-char remark
Show marketing remark (461 chars)
Terrific potential for an investor. In an up and coming rehab area already well under way. 3 possible units in this cute home facing Capitol. 2nd and 3rd entries face 32nd street. Hardwood floors, partially fenced, 2 car gar. underneath, MEMBERSHIP IN CHILDRENS MUSEUM INCLUDED AT THESE ADDRESSES. Close to Ivy tech, IUPUI, Med. School, Dental School, and Law school. With a little elbow grease: Live in one and use the others to pay expenses and tuition!
-
2015-01-22price $49,900 461-char remark
Show marketing remark (461 chars)
Terrific potential for an investor. In an up and coming rehab area already well under way. 3 possible units in this cute home facing Capitol. 2nd and 3rd entries face 32nd street. Hardwood floors, partially fenced, 2 car gar. underneath, MEMBERSHIP IN CHILDRENS MUSEUM INCLUDED AT THESE ADDRESSES. Close to Ivy tech, IUPUI, Med. School, Dental School, and Law school. With a little elbow grease: Live in one and use the others to pay expenses and tuition!
-
2014-10-23$68,900 Active 461-char remark
Show marketing remark (461 chars)
Terrific potential for an investor. In an up and coming rehab area already well under way. 3 possible units in this cute home facing Capitol. 2nd and 3rd entries face 32nd street. Hardwood floors, partially fenced, 2 car gar. underneath, MEMBERSHIP IN CHILDRENS MUSEUM INCLUDED AT THESE ADDRESSES. Close to Ivy tech, IUPUI, Med. School, Dental School, and Law school. With a little elbow grease: Live in one and use the others to pay expenses and tuition!
-
2006-09-13soldstatus $40,000
-
2005-10-11$45,000
ⓘ Source: listings_history table (triggers on properties + properties_extension) + one-shot
backfill from property_details.listing_events for pre-trigger history.
Tax reassessment forecast IN · Partial reset (capped growth)
- Current annual tax
- $4,741 · $395/mo
- Projected year-2 tax
- $4,741 · $395/mo
- Expected delta
- $0/yr ($0/mo · 0.0%)
ⓘ Screening estimate from a state-policy table — verify with the county assessor before closing.
Climate risk First Street
- Flood 6/10 Major FEMA zone X (unshaded) · 74% chance over 30 yrs
- Wildfire 1/10 Low
- Heat 3/10 Moderate 7 d/yr ≥101°F today · 19 d/yr by 30 yrs out
- Wind 2/10 Low 0% chance of damaging wind over 30 yrs
- Air quality 4/10 Moderate 5 unhealthy d/yr today · 7 by 30 yrs out
Nearby sold comps map
Loading sold comps map…
Walkable amenities ~0.75 mi
Loading nearby amenities…
Taxation est. · year 1
- Rental income
- $75,132
- − Mortgage interest
- −$26,607
- − Property taxes
- −$4,741
- − Insurance
- −$2,375
- − Repairs & maintenance
- −$6,011
- − Management
- −$6,011
- − Depreciation
- −$13,818
- Taxable income
- $15,569
- Est. tax owed @ 24.0%
- −$3,737
- After-tax cash flow
- $18,610/yr
For passive investors: Depreciation is non-cash, so a rental often shows a tax loss while cash-flowing — sheltering income. Rental losses are passive: they offset passive income freely, and up to $25,000/yr can offset ordinary (W-2) income if you actively participate and your MAGI is under $100k (phasing out to $0 by $150k); unused losses carry forward. On sale, claimed depreciation is recaptured at up to 25%, and gains may owe capital-gains tax (a 1031 exchange can defer both). Figures are a year-1 estimate at your 24.0% rate — not tax advice; consult a CPA.
Schools (NCES district)
- District
- Indianapolis Public Schools
- NCES district ID
- 1804770
- Math proficiency
- 14% ▼ -7.00%
- Reading proficiency
- 20% ▼ -3.00%
- Median HH income
- $32,034
- Composite
- 13.69/100
- National rank
- #9499
- State rank
- #286 of 301 in IN
Livability — Indianapolis city (balance)
No livability data for this city. (Only ~50 U.S. cities are tracked.)
Census & demographics
- Census place
- Indianapolis city (balance), IN
- County
- Marion County · 998,460 people
- City population
- 881,119
- Metro
- Indianapolis-Carmel-Anderson, IN
- Population (ZIP)
- 22,379
- Household income
- $60,062
- Rent vs Own
- Severe rent burden
- 978.0
Population outlook (Marion County) Hauer SSP2
- Today (2025)
- 1,025,572 people
- By 2030
- 1,065,727 · +3.9%
- By 2040
- 1,141,577 · +11.3%
- By 2050
- 1,208,920 · +17.9%
- By 2075
- 1,367,288 · +33.3%
- By 2100
- 1,438,201 · +40.2%
Race, ethnicity, and origin ACS 2023
- Neighborhood character
- Diverse neighborhood (Simpson 0.62)
- Race & ethnicity
- White 46% Black 40% Hispanic / Latino 8% Two or more races 6% Asian 2%
- Hispanic origin (detail)
- Mexican 4%
- Common ancestry
- Romanian 2% Slovak 2% Italian 1%
- Foreign-born
- 4% · Canada
- Languages at home
- 93% English-only · Spanish 5% French/Haitian/Cajun 1% Other Indo-European 1%
Political lean MEDSL · Marion
- 2024 margin
- Strong D (+27.7) · D 63.0% · R 35.3% · Other 1.7%
- 2008→2024 swing
- -0.7pp no change · 2008: 28.4pp · 2024: 27.7pp
- All cycles
- 2024: D+27.7 2020: D+29.1 2016: D+22.8 2012: D+22.2 2008: D+28.4
Not yet ingested
- Civics
- —
Market trends
- HPI YoY
- ▼ -324.63%
- Current HPI
- 319.7725
- Rent YoY
- ▲ 6.43%
- Metro
- Indianapolis-Carmel-Anderson, IN
- State GDP YoY
- ▲ 2.90%
- F500 in state
- 18
Industry mix (Fortune 500 HQ in IN)
| Industry | F500 HQs | Revenue |
|---|---|---|
| Industrial Machinery | 2 | $37B |
|
||
| Healthcare | 1 | $177B |
|
||
| Pharmaceuticals | 1 | $45B |
|
||
| Metals / Steel | 1 | $18B |
|
||
| Agriculture | 1 | $17B |
|
||
| Packaging | 1 | $12B |
|
||
Price history
+955.6% since first listed11 events — show timeline
- 2026-04-20 Listed $475,000 MIBOR as Distributed by MLS Grid
- 2015-07-24 Sold (MLS) $37,000 MIBOR as Distributed by MLS Grid
- 2015-07-06 Pending — MIBOR as Distributed by MLS Grid
- 2015-06-25 Contingent — MIBOR as Distributed by MLS Grid
- 2015-06-19 Relisted — MIBOR as Distributed by MLS Grid
- 2015-05-01 Listing Removed — MIBOR as Distributed by MLS Grid
- 2015-03-09 Price Changed $39,000 MIBOR as Distributed by MLS Grid
- 2015-01-22 Price Changed $49,900 MIBOR as Distributed by MLS Grid
- 2014-10-23 Listed $68,900 MIBOR as Distributed by MLS Grid
- 2006-09-13 Sold (MLS) $40,000 MIBOR as Distributed by MLS Grid
- 2005-10-11 Listed $45,000 MIBOR as Distributed by MLS Grid
Property tax history
+10.8%/yrLatest (2025): $4,741 · +548.0% YoY. Source: county tax records.
Cash-flow waterfall
monthlySold comps — $/sqft
last 12 mo · ≤1 miLoading sold comps…