2253 Barbera Rd · Oswego, IL
Flood risk 1/10 · Minimal
- FEMA flood zone
- X (unshaded)
- Chance of flooding over 30 yrs
- 0.0%
- Est. flood insurance / yr
- $473 – $860
Fire risk 1/10 · Minimal
- Est. fire insurance / yr
- $804 – $1,492
Heat risk 3/10 · Minor
- Hot days now (above 103°F)
- 7 days/yr
- Hot days in 30 yrs
- 15 days/yr
Wind risk 2/10 · Minimal
- Chance of severe wind over 30 yrs
- 1.0%
Air-quality risk 3/10 · Minor
- Unhealthy air days now
- 3 days/yr
- Unhealthy air days in 30 yrs
- 4 days/yr
Risk factors via First Street. Map © Google.
Why this score? — see what drove the D grade
The composite is a weighted blend of 9 inputs, each scored 0–100. Each bar is that input's sub-score; the figure is the points it added to the 100-point composite (weight × sub-score).
- Cash flow +12.4/30.0
- ARV discount +7.5/15.0
- Condition / age +5.0/5.0
- 1% rule +4.6/10.0
- Livability +4.0/5.0
- DSCR +3.7/10.0
- Rent growth +3.6/5.0
- Schools +3.1/10.0
- Appreciation +0.0/10.0
$334,990
🖨 Deal sheet (PDF) 📄 Offer letter ✓ Due diligence
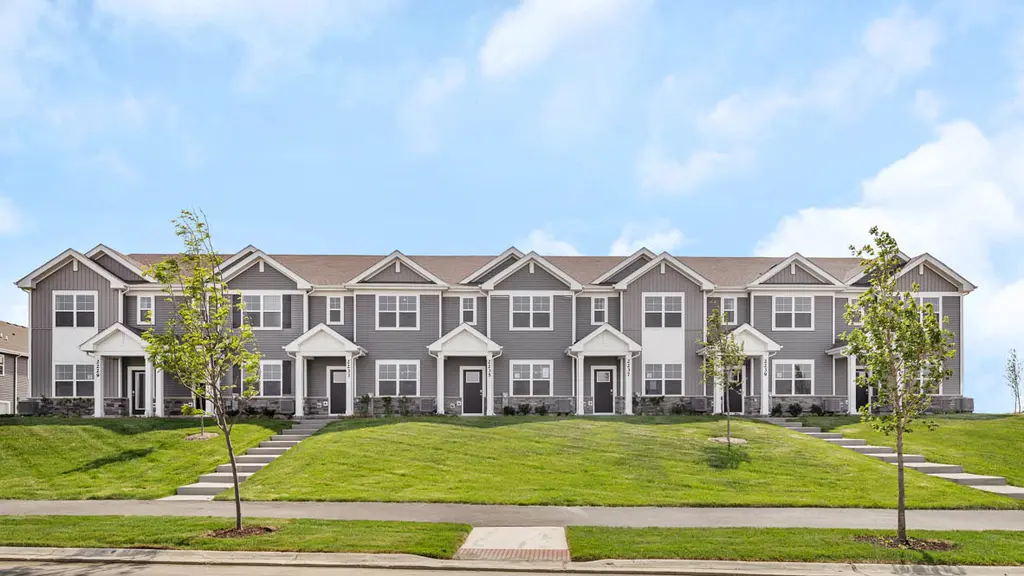
Listing remarks
Discover yourself at 2253 Barbera Dr. , Oswego, Illinois, a beautiful NEW home in our Sonoma Trails community. This Middle UNIT townhome will be ready for Fall move-in! Homesite includes a fully sodded yard that is maintained throughout the year as well as snow removal in the winter. This Norfolk townhome plan offers over 1,500 square feet of living space with 3 bedrooms plus a loft, 2.5 baths, a mudroom and a 2-car garage. As soon as you step inside, you'll be greeted by our open concept living area, 9 ft Ceilings, and luxury vinyl plank throughout the first floor. The expansive kitchen overlooks the dining and great room areas, making it the ideal space to entertain. Additionally, your ki
Key facts
- Spacious island
- Quartz countertops
- Expansive kitchen
Tags
Neighborhood map
What this means for you Summary
Snapshot
- This is a 3-bed/2.5-bath townhouse listed at $335k. Condition is rated excellent.
Deal economics
- At list price, monthly cash flow is $-54 ($-650/yr) — negative.
- To cash-flow at today's rent, offer at most $327k (2.3% below list).
- To meet the 1% rule (rent ≥ 1% of price), the offer needs to be $321k (4.2% below list).
- Recommended offer: $321k (4.2% below list) — sets the bar for 1% rule.
- Cap rate 6.1% vs local median 3.9% in Oswego — top-decile yield for the area; either an underpriced asset or a hidden risk that comps aren't pricing in. Stress-test before assuming the spread holds.
Location & tenants
- Location reads 81/100 on livability (#83 in IL, #1,366 nationally) — a professional / high-income tenant draw. Strengths: crime A+, employment A+, housing A+; Watch: amenities F, commute F.
- CUSD 308 (suburban): math 29% / reading 34% proficiency, ranked #179 of 620 in IL (top 29%) — families likely to look elsewhere, expect single-tenant / working-renter base with shorter leases; only 20% free/reduced lunch — higher-income household profile.
- Zoned schools: Grande Park Elem Sch (math 31% / reading 40%, grade F, #510 of 2,056 statewide, top 25%, 637 students, 0% FRL); Murphy Junior High School (math 30% / reading 43%, grade F, #178 of 665 statewide, top 27%, 713 students, 0% FRL); Oswego East High School (math 35% / reading 40%, grade F, #104 of 693 statewide, top 15%, 2,836 students, 0% FRL) — zoned schools average 0% FRL vs 20% district-wide (20 pts lower); this property's tenant base skews higher-income than the district average.
- Market conditions: Rents rising fast (+4.5%/yr); 300 active listings in the ZIP; 11 comparable units currently listed for rent nearby; rentals lingering (median 46d on market — plan ~5-8 weeks vacancy on turnover, expect pricing pressure); 55% of comp listings sitting > 30 days — soft ceiling on asking rent; high-income renter base; 706 units permitted in Kendall County in 2024 (263 in 5+ unit buildings).
- This rent runs 32% of the median local income ($119k/yr) — at the standard rent-burdened threshold; future hikes will face affordability resistance.
Forward outlook
- Local home prices are declining (-3.0%/yr); year-one equity from $2k of loan paydown is wiped out by about $10k of value loss. Plan a longer hold.
- Kendall County population projected at +20% by 2050 — long-run rental-demand tailwind backs the buy-and-hold thesis.
Negotiation context
- It's been on market 15 days — a 2% lower offer ($330k) is reasonable based on typical stale-listing flexibility.
Questions for the listing agent
- What do current leases actually rent for vs. the listed asking? Can we see a recent rent roll and the last 12 months of T-12 income?
- What does the HOA fee cover, when was the last increase, and are there any pending special assessments or reserve-fund shortfalls?
- Is there a deadline driving the sale (1031 exchange, divorce, estate, relocation)? That informs how much negotiation room exists.
- Schools are B-rated — typically a magnet for longer-tenancy family renters. What's the average tenant stay here, and is there a school-zone premium baked into asking?
- The area grade is low — what's the realistic commute time and amenity access for the typical tenant pool here? Any planned neighborhood developments (good or bad) we should know about?
- What's the average days-on-market for RENTAL listings here right now (not sales)? A rising rental-DOM trend means longer vacancies and softer asking-rent achievability than the comps imply.
- What's the recent tenant-quality profile in this submarket — average credit score on applications, eviction rate, late-payment / NSF rate, and stable-employment percentage? A property-management company in the area should have these aggregated.
- How much new for-sale + rental construction is in the pipeline within 1–3 miles? Heavy new supply typically softens prices + rents 12–24 months out; constrained supply supports both.
Investment metrics
- 1% rule
- 0.96% ✗
- Cap rate
- 6.10%
- Cash-on-cash
- -0.69%
- DSCR
- 0.97
- GRM
- 8.7
CMA / ARV
- ARV (on-the-fly)
- $334,831
- Comps found
- 12
Show comp detail 12 sales within ~0.75 mi
| Address | Dist | Beds/Ba | Sqft | Sold | Price | $/sf | Match |
|---|---|---|---|---|---|---|---|
| 2108 Bodega Dr | 0.00mi | 3/2.5 | 1,543 (0%) | 9mo | $339,990 | $220 | 92 |
| 2259 Riesling Rd | 0.49mi | 3/2.5 | 1,543 (0%) | 5mo | $334,990 | $217 | 73 |
| 2257 Riesling Rd | 0.49mi | 3/2.5 | 1,543 (0%) | 6mo | $334,990 | $217 | 72 |
| 2251 Riesling Rd | 0.49mi | 3/2.5 | 1,543 (0%) | 6mo | $341,990 | $222 | 72 |
| 2246 Barbera Dr | 0.49mi | 3/2.5 | 1,543 (0%) | 8mo | $344,990 | $224 | 71 |
| 2232 Barbera Dr | 0.49mi | 3/2.5 | 1,543 (0%) | 9mo | $334,990 | $217 | 70 |
| 2236 Barbera Dr | 0.49mi | 3/2.5 | 1,543 (0%) | 9mo | $374,990 | $243 | 70 |
| 145 Henderson St | 0.49mi | 3/2.5 | 1,717 (+11%) | 5mo | $395,000 | $230 | 54 |
| 146 Henderson St | 0.49mi | 3/2.5 | 1,717 (+11%) | 9mo | $365,000 | $213 | 51 |
| 444 Hathaway Ln | 0.49mi | 3/2.5 | 1,767 (+14%) | 7mo | $370,000 | $209 | 47 |
| 131 Henderson St | 0.49mi | 3/2.5 | 1,767 (+14%) | 8mo | $381,490 | $216 | 46 |
| 141 Henderson St | 0.49mi | 3/2.5 | 1,767 (+14%) | 8mo | $350,000 | $198 | 46 |
Match score weights: distance 35% · size 25% · config 20% · recency 20%. Top-matched comps best support the ARV.
Projected returns pro-forma
-3.0% appreciation · 4.47% rent growth · sell at horizon
- IRR
- -15.5%
- Equity multiple
- 0.44×
- Total profit
- $-52,699
- Equity at exit
- $49,948
- IRR
- -4.4%
- Equity multiple
- 0.69×
- Total profit
- $-29,081
- Equity at exit
- $28,964
Cash invested: $93,797 (down + closing). Projections, not guarantees.
Landlord ↔ Tenant lean methodology
- Overall (STATE)
- 43 Moderately Tenant-Leaning
- State Illinois
- 43 Moderately Tenant-Leaning · D+7
- County
- — inherits STATE
- City
- — inherits STATE
ZIP-level market 60543
- Home prices YoY
- -30.3%
- Rents YoY
- 4.5%
- Active inventory
- 300
- Price-to-rent
- 8.7×
Monthly cashflow live
- Estimated rent
- $3,210 high interval (Pro) →
- Mortgage (P&I)
- −$1,757
- Tax est. 1.5%
- −$419 /mo · $5,025/yr
- Insurance
- −$140
- HOA
- −$275
- Vacancy / Maint / Mgmt
- −$674
- Net cashflow
- $-54
Break-even live
Sensitivity live
| Price | -10% $177 | -5% $62 | +0% $-54 | +5% $-170 | +10% $-286 |
|---|---|---|---|---|---|
| Rent | -10% $-308 | -5% $-181 | +0% $-54 | +5% $73 | +10% $199 |
| Rate | -1.0pp $115 | -0.5pp $31 | base $-54 | +0.5pp $-141 | +1.0pp $-229 |
UW: 25.0% down · 7.5% · 30yr · 1.5% tax · 5.0% vac · 8.0% maint · 8.0% mgmt
Financing live
Cash to close
- Down payment
- $83,748
- Closing costs
- $10,050
- Reserves months
- —
- Total cash needed
- —
Loan-product check · same deal, 3 products live
Conventional
25% down · 7.5% · 30yr
- Down + closing
- —
- Monthly P&I
- —
- Monthly cashflow
- —
- DSCR
- —
- Eligible?
- —
Personal DTI + credit; lowest rate.
DSCR
20% down · 8.5% · 30yr
- Down + closing
- —
- Monthly P&I
- —
- Monthly cashflow
- —
- DSCR
- —
- Eligible?
- —
No personal income docs; deal must DSCR.
Hard money
10% down · 12.0% · 12mo
- Down + closing
- —
- Monthly P&I
- —
- Monthly cashflow
- —
- DSCR
- —
- Eligible?
- —
Short-term bridge; refi at stabilization.
Rent comps 11 comps
| Address | Beds | Baths | Sqft | Rent | $/sqft | DOM | Units | Dist |
|---|---|---|---|---|---|---|---|---|
| 501 Vinca Ln Oswego, IL | 2.0–3.0 | 1.5–2.5 | 1792 | $4,000 | $2.23 | 0d | 19 | 1.17mi |
| 513 Vinca Ln Oswego, IL | 3.0 | 2.0 | 1609 | $3,000 | $1.86 | 45d | 1 | 1.19mi |
| 517 Vinca Ln Oswego, IL | 3.0 | 2.5 | 1747 | $2,900 | $1.66 | 45d | 1 | 1.19mi |
| 519 Vinca Ln Oswego, IL | 3.0 | 2.5 | 1559 | $3,401 | $2.18 | 12d | 1 | 1.20mi |
| 519 Vinca Ln Oswego, IL | 3.0 | 2.5 | 1559 | $2,700 | $1.73 | 45d | 1 | 1.20mi |
| 119 Dorset Ave Oswego, IL | 3.0 | 2.5 | 1559 | $2,900 | $1.86 | 45d | 1 | 1.28mi |
| 279 Dorset Ave Oswego, IL | 3.0 | 2.0 | 1609 | $4,000 | $2.49 | 12d | 1 | 1.28mi |
| 254 Dorset Ave Oswego, IL | 3.0 | 2.5 | 1559 | $2,651 | $1.70 | 45d | 1 | 1.31mi |
| 137 Dorset Ave Oswego, IL | 3.0 | 2.0 | 2189 | $4,000 | $1.83 | 14d | 1 | 1.34mi |
| 157 Dorset Ave Oswego, IL | 3.0 | 2.5 | 1559 | $2,751 | $1.76 | 45d | 1 | 1.39mi |
| 182 Dorset Ave Oswego, IL | 3.0 | 2.5 | 1747 | $3,501 | $2.00 | 12d | 1 | 1.41mi |
HOA detail
- Monthly dues
- $275 · $3,300/yr
- Likely covers
- snow removal
Listing history 2 events
-
2026-04-03status Pending
-
2026-03-17$334,990 Active
ⓘ Source: listings_history table (triggers on properties + properties_extension) + one-shot
backfill from property_details.listing_events for pre-trigger history.
Climate risk First Street
- Flood 1/10 Low FEMA zone X (unshaded) · 0% chance over 30 yrs
- Wildfire 1/10 Low
- Heat 3/10 Moderate 7 d/yr ≥103°F today · 15 d/yr by 30 yrs out
- Wind 2/10 Low 100% chance of damaging wind over 30 yrs
- Air quality 3/10 Moderate 3 unhealthy d/yr today · 4 by 30 yrs out
Nearby sold comps map
Loading sold comps map…
Walkable amenities ~0.75 mi
Loading nearby amenities…
Taxation est. · year 1
- Rental income
- $38,519
- − Mortgage interest
- −$18,765
- − Property taxes
- −$5,025
- − Insurance
- −$1,675
- − Repairs & maintenance
- −$3,082
- − Management
- −$3,082
- − HOA
- −$3,300
- − Depreciation
- −$9,745
- Taxable loss
- −$6,153
- Est. tax savings @ 24.0%
- +$1,477
- After-tax cash flow
- $827/yr
For passive investors: Depreciation is non-cash, so a rental often shows a tax loss while cash-flowing — sheltering income. Rental losses are passive: they offset passive income freely, and up to $25,000/yr can offset ordinary (W-2) income if you actively participate and your MAGI is under $100k (phasing out to $0 by $150k); unused losses carry forward. On sale, claimed depreciation is recaptured at up to 25%, and gains may owe capital-gains tax (a 1031 exchange can defer both). Figures are a year-1 estimate at your 24.0% rate — not tax advice; consult a CPA.
Condition & rehab AI · 6 photos
This move-in-ready townhouse in Oswego, Illinois, offers a beautiful and well-maintained living space with modern amenities and a clean curb appeal.
Value-add opportunities
- Both Painting the exterior and interior walls — Fresh paint enhances curb appeal and interior aesthetics.
- Both Landscaping improvements — Enhanced landscaping can increase both resale and rental value.
- Both Adding smart home features — Smart home features can increase both resale and rental value by making the home more modern and convenient.
Renovation cost estimate screening
Value-add ROI direction
- Both Painting the exterior and interior walls — Fresh paint enhances curb appeal and interior aesthetics. ↑
- Both Landscaping improvements — Enhanced landscaping can increase both resale and rental value. ↑
- Both Adding smart home features — Smart home features can increase both resale and rental value by making the home more modern and convenient. ↑
ⓘ Cost ranges are severity-bucket heuristics (US national rule-of-thumb). Get contractor quotes + a written scope before underwriting a rehab budget.
Schools (NCES district)
- District
- CUSD 308
- NCES district ID
- 1730270
- Math proficiency
- 29% ▼ -10.00%
- Reading proficiency
- 34% ▼ -9.00%
- Median HH income
- $89,945
- Composite
- 31.25/100
- National rank
- #6028
- State rank
- #179 of 620 in IL
Livability — Oswego
- Score
- 81/100
- State rank
- #83
- US rank
- #1366
Category grades
Schools grade is shown separately in the Schools card above.
Census & demographics
- County
- Kendall County · 71,842 people
- City population
- 43,047
- Metro
- Chicago-Naperville-Elgin, IL-IN-WI
- Population (ZIP)
- 43,047
- Household income
- $119,371
- Rent vs Own
- Severe rent burden
- 317.0
Population outlook (Kendall County) Hauer SSP2
- Today (2025)
- 138,283 people
- By 2030
- 144,935 · +4.8%
- By 2040
- 156,944 · +13.5%
- By 2050
- 165,424 · +19.6%
- By 2075
- 174,715 · +26.3%
- By 2100
- 168,523 · +21.9%
Race, ethnicity, and origin ACS 2023
- Neighborhood character
- Majority White (64%)
- Race & ethnicity
- White 64% Hispanic / Latino 18% Two or more races 13% Black 10% Asian 4%
- Hispanic origin (detail)
- Mexican 14% Puerto Rican 2%
- Common ancestry
- Romanian 7% Lithuanian 2% Italian 2%
- Foreign-born
- 13% · Canada
- Languages at home
- 79% English-only · Spanish 14% Other Indo-European 2% Russian/Polish/Slavic 2%
Political lean MEDSL · Kendall
- 2024 margin
- Toss-up / Even · D 50.0% · R 48.5% · Other 1.6%
- 2008→2024 swing
- -5.7pp toward R · 2008: 7.2pp · 2024: 1.5pp
- All cycles
- 2024: D+1.5 2020: D+5.7 2016: R+1.5 2012: R+4.1 2008: D+7.2
Not yet ingested
- Civics
- —
Market trends
- HPI YoY
- ▼ -91.42%
- Current HPI
- 210.3944
- Rent YoY
- ▲ 4.47%
- Metro
- Chicago-Naperville-Elgin, IL-IN-WI
- State GDP YoY
- ▲ 1.59%
- F500 in state
- 60
Industry mix (Fortune 500 HQ in IL)
| Industry | F500 HQs | Revenue |
|---|---|---|
| Insurance | 4 | $201B |
|
||
| Consumer Goods | 4 | $87B |
|
||
| Industrial Machinery | 3 | $64B |
|
||
| Healthcare | 2 | $55B |
|
||
| Retail / Pharmacy | 1 | $148B |
|
||
| Agriculture / Food | 1 | $86B |
|
||
Price history
2 events — show timeline
- 2026-04-03 Pending — MRED as Distributed by MLS Grid
- 2026-03-17 Listed $334,990 MRED as Distributed by MLS Grid
Cash-flow waterfall
monthlySold comps — $/sqft
last 12 mo · ≤1 miLoading sold comps…