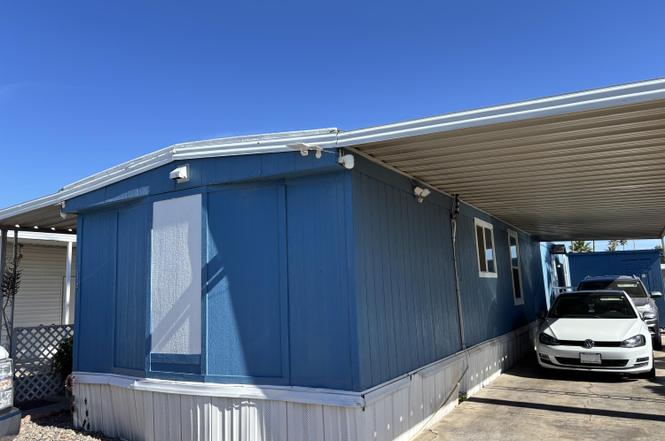
8401 N 67th Ave #141 · Glendale, AZ
Flood risk 1/10 · Minimal
- FEMA flood zone
- X (shaded)
- Chance of flooding over 30 yrs
- 0.0%
- Est. flood insurance / yr
- $507 – $1,088
Fire risk 1/10 · Minimal
- Est. fire insurance / yr
- $610 – $1,132
Heat risk 9/10 · Severe
- Hot days now (above 112°F)
- 5 days/yr
- Hot days in 30 yrs
- 14 days/yr
Wind risk 1/10 · Minimal
- Chance of severe wind over 30 yrs
- —
Air-quality risk 3/10 · Minor
- Unhealthy air days now
- 3 days/yr
- Unhealthy air days in 30 yrs
- 3 days/yr
Risk factors via First Street. Map © Google.
Why this score? — see what drove the B+ grade
The composite is a weighted blend of 9 inputs, each scored 0–100. Each bar is that input's sub-score; the figure is the points it added to the 100-point composite (weight × sub-score).
- Cash flow +30.0/30.0
- ARV discount +15.0/15.0
- 1% rule +10.0/10.0
- DSCR +10.0/10.0
- Livability +3.8/5.0
- Rent growth +2.9/5.0
- Condition / age +2.5/5.0
- Schools +2.3/10.0
- Appreciation +0.0/10.0
$55,000
🖨 Deal sheet 📄 Offer letter ✓ Due diligence
Listing remarks
FINANCING WITH LOW LOW LOW DOWNPAYMENT. ALL AGES COMMUNITY! Manufactured home with 2 completely remodeled bedrooms, amazing kitchen, spacious living room, 2 updated bathrooms. Move in ready!!!
Key facts
- 3 parking spots
- Community pool
- Built 1984
Property features AI
Finance
- Other: Community features: Near bus stop
- HOA & community: Land lease ($720 monthly); No association fees; Community pool; Playground; Biking/walking path; Fitness center
Exterior
- Parking: 3 covered parking spaces; 3 carport spaces
- Utilities: City water; Public sewer
- Home design: Manufactured/mobile home; Leasehold ownership; Asphalt road access
- Construction: Vinyl siding; Steel frame construction; Wood frame construction; Painted exterior; Metal roof
- Exterior features: Storage; Gravel/stone front yard; Gravel/stone backyard; Private maintained road
Interior
- Kitchen: Refrigerator
- Bedrooms: 2 bedrooms
- Flooring: Vinyl flooring
- Bathrooms: 2 full bathrooms
- Heating & cooling: Mini split heating; Central air conditioning; Mini split cooling
- Interior features: Granite counters; Eat-in kitchen; Full bath in master bedroom; Dual-pane windows
- Laundry & utility: Community laundry
Neighborhood map
What this means for you Summary
Snapshot
- This is a 2-bed/2.0-bath manufactured listed at $55k.
Deal economics
- At list price, monthly cash flow is $704 ($8k/yr) — positive.
- The deal already cash-flows at list — no discount required.
- Meets the 1% rule at list price ($1k rent vs $55k).
- Recommended offer: $48k (12.0% below list) — sets the bar for market timing.
- Cap rate 21.7% vs local median 3.5% in Glendale — top-decile yield for the area; either an underpriced asset or a hidden risk that comps aren't pricing in. Stress-test before assuming the spread holds.
Location & tenants
- Location reads 76/100 on livability (#12 in AZ, #3,235 nationally) — a middle-class / working-renter tenant base. Strengths: commute A+, housing A+, amenities B; Watch: health & safety D+, crime F.
- Glendale Union High School District (4285) (urban): math 23% / reading 31% proficiency, ranked #130 of 249 in AZ (top 52%) — low school quality limits family demand, transient renter base, plan for 1-2y turnover.
- Zoned schools: Glendale High School (math 13% / reading 22%, grade F, #245 of 381 statewide, top 65%, 1,816 students, 76% FRL).
- Market conditions: Rents rising (+1.7%/yr); 172 active listings in the ZIP; 40 comparable units currently listed for rent nearby; rentals leasing fast (median 1d on market — plan ~1-2 weeks tenant-placement turnaround); 36,011 units permitted in Maricopa County in 2024 (12,801 in 5+ unit buildings).
Forward outlook
- Local home prices are declining (-3.0%/yr); year-one equity from $380 of loan paydown is wiped out by about $2k of value loss. Plan a longer hold.
- Maricopa County population projected at +38% by 2050 — long-run rental-demand tailwind backs the buy-and-hold thesis.
- At projected returns (-3.0% appreciation + 1.7% rent growth), your $15k cash investment doubles in ~3 years — after that, you're playing with house money.
Negotiation context
- It's been on market 133 days — a 12% lower offer ($48k) is reasonable based on typical stale-listing flexibility.
Risks & watch-outs
- Climate carrying-cost: extreme-heat days projected 5→14/yr by 2055 (HVAC capex compounding) — expect insurance premiums to compound above CPI over the hold.
Questions for the listing agent
- It's been on market 133 days. Have you received any prior offers? Is the seller open to a 12% concession, seller financing, or rate buy-down credit?
- Why hasn't it sold? Are there any deal-killer items the seller is aware of (foundation, flood, title, zoning, code violations)?
- Is there a deadline driving the sale (1031 exchange, divorce, estate, relocation)? That informs how much negotiation room exists.
- Crime grade is F in this area — have there been break-ins, vandalism, or insurance claims at this property in the last 3 years? What carrier currently insures it and at what premium?
- What's the average days-on-market for RENTAL listings here right now (not sales)? A rising rental-DOM trend means longer vacancies and softer asking-rent achievability than the comps imply.
- What's the recent tenant-quality profile in this submarket — average credit score on applications, eviction rate, late-payment / NSF rate, and stable-employment percentage? A property-management company in the area should have these aggregated.
- How much new for-sale + rental construction is in the pipeline within 1–3 miles? Heavy new supply typically softens prices + rents 12–24 months out; constrained supply supports both.
Investment metrics
- 1% rule
- 2.50% ✓
- Cap rate
- 21.66%
- Cash-on-cash
- 54.89%
- DSCR
- 3.44
- GRM
- 3.3
CMA / ARV
- ARV (on-the-fly)
- $67,620
- Comps found
- 7
Show comp detail 7 sales within ~0.75 mi
| Address | Dist | Beds/Ba | Sqft | Sold | Price | $/sf | Match |
|---|---|---|---|---|---|---|---|
| 8401 N 67th Ave #69 | 0.09mi | 3/2.0 (+1) | 960 (-2%) | 14mo | $79,000 | $82 | 76 |
| 8401 N 67th Ave #164 | 0.09mi | 3/2.0 (+1) | 896 (-9%) | 11mo | $78,500 | $88 | 68 |
| 8401 N 67th Ave #114 | 0.09mi | 3/2.0 (+1) | 1,024 (+4%) | 24mo | $87,000 | $85 | 64 |
| 8401 N 67th Ave #199 | 0.09mi | 2/1.0 | 840 (-14%) | 12mo | $34,900 | $42 | 58 |
| 8401 N 67th Ave #216 | 0.09mi | 2/1.0 | 840 (-14%) | 14mo | $46,000 | $55 | 57 |
| 8401 N 67th Ave #210 | 0.09mi | 2/2.0 | 1,120 (+14%) | 19mo | $77,700 | $69 | 57 |
| 8601 N 71st Ave #140 | 0.64mi | 2/2.0 | 980 (0%) | 20mo | $65,000 | $66 | 53 |
Match score weights: distance 35% · size 25% · config 20% · recency 20%. Top-matched comps best support the ARV.
Projected returns pro-forma
-3.0% appreciation · 1.74% rent growth · sell at horizon
- IRR
- 51.7%
- Equity multiple
- 3.22×
- Total profit
- $34,257
- Equity at exit
- $8,201
- IRR
- 56.5%
- Equity multiple
- 6.25×
- Total profit
- $80,812
- Equity at exit
- $4,755
Cash invested: $15,400 (down + closing). Projections, not guarantees.
Landlord ↔ Tenant lean methodology
- Overall (STATE)
- 87 Strongly Landlord-Friendly
- State Arizona
- 87 Strongly Landlord-Friendly · R+3
- County
- — inherits STATE
- City
- — inherits STATE
ZIP-level market 85302
- Rents YoY
- 1.7%
- Active inventory
- 172
- Price-to-rent
- 3.3×
Monthly cashflow live
- Estimated rent
- $1,373 high interval (Pro) →
- Mortgage (P&I)
- −$288
- Tax est. 1.5%
- −$69 /mo · $825/yr
- Insurance
- −$23
- HOA
- −$0
- Vacancy / Maint / Mgmt
- −$288
- Net cashflow
- $704
Break-even live
UW: 25.0% down · 7.5% · 30yr · 1.5% tax · 5.0% vac · 8.0% maint · 8.0% mgmt
Financing live
Cash to close
- Down payment
- $13,750
- Closing costs
- $1,650
- Reserves months
- —
- Total cash needed
- —
Loan-product check · same deal, 3 products live
Conventional
25% down · 7.5% · 30yr
- Down + closing
- —
- Monthly P&I
- —
- Monthly cashflow
- —
- DSCR
- —
- Eligible?
- —
Personal DTI + credit; lowest rate.
DSCR
20% down · 8.5% · 30yr
- Down + closing
- —
- Monthly P&I
- —
- Monthly cashflow
- —
- DSCR
- —
- Eligible?
- —
No personal income docs; deal must DSCR.
Hard money
10% down · 12.0% · 12mo
- Down + closing
- —
- Monthly P&I
- —
- Monthly cashflow
- —
- DSCR
- —
- Eligible?
- —
Short-term bridge; refi at stabilization.
Rent comps 40 comps
| Address | Beds | Baths | Sqft | Rent | $/sqft | DOM | Units | Dist |
|---|---|---|---|---|---|---|---|---|
| 8401 N 67th Ave Glendale, AZ | 2.0 | 1.0 | 728 | $1,400 | $1.92 | 4d | 1 | 0.10mi |
| 8450 N 67th Ave Glendale, AZ | 1.0–2.0 | 1.0 | 615 | $1,350 | $2.20 | 1d | 4 | 0.22mi |
| 6767 W Butler Dr Glendale, AZ | 1.0–2.0 | 1.5–2.0 | 787 | $1,458 | $1.85 | 1d | 14 | 0.26mi |
| 8344 N 67th Ave Glendale, AZ | 1.0–2.0 | 1.0 | 615 | $1,315 | $2.14 | 1d | 10 | 0.28mi |
| 8772 N 67th Ave Glendale, AZ | 1.0–3.0 | 1.0–2.0 | 937 | $1,654 | $1.77 | 1d | 24 | 0.47mi |
| 6049 W Laurie Ln Unit 4 Glendale, AZ | 1.0 | 1.0 | 675 | $1,100 | $1.63 | 10d | 1 | 0.67mi |
| 6049 W Laurie Ln Unit 5 Glendale, AZ | 2.0 | 1.0 | 750 | $1,210 | $1.61 | 1d | 1 | 0.68mi |
| 6049 W Laurie Ln Unit 7 Glendale, AZ | 1.0 | 1.0 | 650 | $1,050 | $1.62 | 1d | 1 | 0.68mi |
| 6043 W Laurie Ln Apt 4 Glendale, AZ | 1.0 | 1.0 | 675 | $1,050 | $1.56 | 11d | 1 | 0.69mi |
| 8315 N 61st Ave Glendale, AZ | 2.0 | 1.0 | 900 | $1,004 | $1.12 | 1d | 1 | 0.69mi |
| 6060 W Royal Palm Rd Glendale, AZ | 1.0 | 1.0 | 543 | $1,146 | $2.11 | 1d | 4 | 0.73mi |
| 6201 W Olive Ave Glendale, AZ | 1.0 | 1.0 | 585 | $960 | $1.64 | 1d | 1 | 0.75mi |
| 6201 W Olive Ave Glendale, AZ | 2.0 | 1.0 | 759 | $1,445 | $1.90 | 22d | 1 | 0.75mi |
| 8319 N 60th Dr Glendale, AZ | 2.0 | 1.0 | 787 | $1,099 | $1.40 | 1d | 1 | 0.75mi |
| 6201 W Olive Ave Unit A3 Glendale, AZ | 1.0 | 1.0 | 554 | $820 | $1.48 | 1d | 1 | 0.81mi |
| 6201 W Olive Ave Unit A4 Glendale, AZ | 1.0 | 1.0 | 585 | $875 | $1.50 | 1d | 1 | 0.81mi |
| 6201 W Olive Ave Unit B1 Glendale, AZ | 2.0 | 1.0 | 759 | $1,225 | $1.61 | 1d | 1 | 0.81mi |
| 9160 N 67th Ave Unit 212 Peoria, AZ | 2.0 | 2.0 | 992 | $1,680 | $1.69 | 24d | 1 | 0.82mi |
| 9160 N 67th Ave Peoria, AZ | 2.0 | 2.0 | 1100 | $2,065 | $1.88 | 43d | 6 | 0.83mi |
| 8546 N 59th Ave Glendale, AZ | 2.0 | 1.0–2.0 | 700 | $1,235 | $1.76 | 1d | 9 | 0.83mi |
| 8546 N 59th Ave Glendale, AZ | 2.0 | 1.0–2.0 | 700 | $1,975 | $2.82 | 20d | 6 | 0.83mi |
| 8530 N 59th Ave Glendale, AZ | 1.0 | 0.5–1.0 | 690 | $1,057 | $1.53 | 1d | 3 | 0.84mi |
| 5902 W Royal Palm Rd Glendale, AZ | 1.0–2.0 | 1.0 | 630 | $1,600 | $2.54 | 1d | 20 | 0.84mi |
| 7040 W Olive Ave Peoria, AZ | 2.0 | 2.0 | 953 | $1,465 | $1.54 | 5d | 1 | 0.85mi |
| 8622 N 59th Ave Glendale, AZ | 2.0–3.0 | 2.0 | 1232 | $1,450 | $1.18 | 1d | 6 | 0.88mi |
| 8450 N 59th Ave Glendale, AZ | 1.0–3.0 | 1.0–2.0 | 919 | $1,824 | $1.99 | 5d | 1 | 0.89mi |
| 8546 N 59th Ave Apt 248 Glendale, AZ | 2.0 | 2.0 | 900 | $1,366 | $1.52 | 20d | 1 | 0.90mi |
| 7040 W Olive Ave #12 Peoria, AZ | 2.0 | 2.0 | 900 | $1,445 | $1.61 | 24d | 1 | 0.92mi |
| 9350 N 67th Ave Glendale, AZ | 2.0 | 2.0 | 970 | $1,429 | $1.47 | 43d | 1 | 0.93mi |
| 9350 N 67th Ave Glendale, AZ | 2.0 | 2.0 | 970 | $1,385 | $1.43 | 12d | 1 | 0.93mi |
| 9350 N 67th Ave Unit A1 Glendale, AZ | 1.0 | 1.0 | 600 | $990 | $1.65 | 24d | 1 | 0.94mi |
| 9350 N 67th Ave Unit B2 Glendale, AZ | 2.0 | 2.0 | 970 | $1,250 | $1.29 | 43d | 1 | 0.94mi |
| 9350 N 67th Ave Unit B1 Glendale, AZ | 2.0 | 1.0 | 842 | $1,070 | $1.27 | 24d | 1 | 0.94mi |
| 8546 N 59th Ave Apt 206 Glendale, AZ | 1.0 | 1.0 | 700 | $1,056 | $1.51 | 20d | 1 | 0.95mi |
| 6011 W Townley Ave Glendale, AZ | 2.0 | 1.5 | 1026 | $1,449 | $1.41 | 1d | 1 | 0.97mi |
| 6002 W Townley Ave Glendale, AZ | 3.0 | 1.5 | 1026 | $1,549 | $1.51 | 1d | 1 | 0.99mi |
| 6015 W Olive Ave Glendale, AZ | 2.0 | 1.0 | 800 | $1,500 | $1.88 | 1d | 16 | 0.99mi |
| 6737 W Myrtle Ave Unit 1 Glendale, AZ | 2.0 | 1.0 | 750 | $1,200 | $1.60 | 15d | 1 | 1.07mi |
| 6749 W Myrtle Ave Apt 1 Glendale, AZ | 2.0 | 1.0 | 625 | $1,200 | $1.92 | 1d | 1 | 1.07mi |
| 7143 N 66th Dr Apt 202 Glendale, AZ | 2.0 | 1.0 | 691 | $1,050 | $1.52 | 1d | 1 | 1.07mi |
Listing history 19 events
-
2026-06-18days on market $55,000 Active 133 DOM
-
2026-06-17days on market $55,000 Active 132 DOM
-
2026-06-16days on market $55,000 Active 131 DOM
-
2026-06-15days on market $55,000 Active 130 DOM
-
2026-06-13days on market $55,000 Active 128 DOM
-
2026-06-13days on market $55,000 Active 127 DOM
-
2026-06-09days on market $55,000 Active 124 DOM
-
2026-06-08days on market $55,000 Active 123 DOM
-
2026-06-07days on market $55,000 Active 122 DOM
-
2026-06-04days on market $55,000 Active 119 DOM
-
2026-06-03days on market $55,000 Active 118 DOM
-
2026-06-02days on market $55,000 Active 117 DOM
-
2026-06-01days on market $55,000 Active 116 DOM
-
2026-05-31days on market $55,000 Active 115 DOM
-
2026-05-09price $55,000
-
2026-03-24price $57,099
-
2026-03-13price $57,100
-
2026-02-11price $57,500
-
2026-02-05$67,500 Active
ⓘ Source: listings_history table (triggers on properties + properties_extension) + one-shot
backfill from property_details.listing_events for pre-trigger history.
Climate risk First Street
- Flood 1/10 Low FEMA zone X (shaded) · 0% chance over 30 yrs
- Wildfire 1/10 Low
- Heat 9/10 Extreme 5 d/yr ≥112°F today · 14 d/yr by 30 yrs out
- Wind 1/10 Low
- Air quality 3/10 Moderate 3 unhealthy d/yr today · 3 by 30 yrs out
Nearby sold comps map
Loading sold comps map…
Walkable amenities ~0.75 mi
Loading nearby amenities…
Taxation est. · year 1
- Rental income
- $16,474
- − Mortgage interest
- −$3,081
- − Property taxes
- −$825
- − Insurance
- −$275
- − Repairs & maintenance
- −$1,318
- − Management
- −$1,318
- − Depreciation
- −$1,600
- Taxable income
- $8,058
- Est. tax owed @ 24.0%
- −$1,934
- After-tax cash flow
- $6,520/yr
For passive investors: Depreciation is non-cash, so a rental often shows a tax loss while cash-flowing — sheltering income. Rental losses are passive: they offset passive income freely, and up to $25,000/yr can offset ordinary (W-2) income if you actively participate and your MAGI is under $100k (phasing out to $0 by $150k); unused losses carry forward. On sale, claimed depreciation is recaptured at up to 25%, and gains may owe capital-gains tax (a 1031 exchange can defer both). Figures are a year-1 estimate at your 24.0% rate — not tax advice; consult a CPA.
Schools (NCES district)
- District
- Glendale Union High School District (4285)
- NCES district ID
- 0403450
- Math proficiency
- 23% ▼ -38.00%
- Reading proficiency
- 31% ▼ -19.00%
- Median HH income
- $40,846
- Composite
- 22.81/100
- National rank
- #8020
- State rank
- #130 of 249 in AZ
Livability — Glendale
- Score
- 76/100
- State rank
- #12
- US rank
- #3235
Category grades
Schools grade is shown separately in the Schools card above.
Census & demographics
- Census place
- Glendale, AZ
- County
- Maricopa County · 4,537,380 people
- City population
- 294,586
- Metro
- Phoenix-Mesa-Chandler, AZ
- Population (ZIP)
- 40,612
- Household income
- $65,132
- Rent vs Own
- Severe rent burden
- 2090.0
Population outlook (Maricopa County) Hauer SSP2
- Today (2025)
- 4,979,203 people
- By 2030
- 5,378,229 · +8.0%
- By 2040
- 6,156,598 · +23.6%
- By 2050
- 6,872,376 · +38.0%
- By 2075
- 8,401,270 · +68.7%
- By 2100
- 9,247,439 · +85.7%
Race, ethnicity, and origin ACS 2023
- Neighborhood character
- Diverse neighborhood (Simpson 0.67)
- Race & ethnicity
- White 45% Hispanic / Latino 35% Two or more races 19% Black 9% Asian 5% Native American 2%
- Hispanic origin (detail)
- Mexican 26% Cuban 2%
- Common ancestry
- Lithuanian 2% Portuguese 2% Romanian 1%
- Foreign-born
- 15% · Canada, Vietnam, China
- Languages at home
- 71% English-only · Spanish 20% Arabic 2% Vietnamese 1%
Political lean MEDSL · Maricopa
- 2024 margin
- Toss-up / Even · D 47.7% · R 51.2% · Other 1.1%
- 2008→2024 swing
- +7.1pp toward D · 2008: -10.6pp · 2024: -3.5pp
- All cycles
- 2024: R+3.5 2020: D+2.2 2016: R+3.5 2012: R+12.0 2008: R+10.6
Not yet ingested
- Civics
- —
Market trends
- HPI YoY
- ▼ -342.03%
- Current HPI
- 335.9575
- Rent YoY
- ▲ 1.74%
- Metro
- Phoenix-Mesa-Chandler, AZ
- State GDP YoY
- ▲ 4.54%
- F500 in state
- 20
Industry mix (Fortune 500 HQ in AZ)
| Industry | F500 HQs | Revenue |
|---|---|---|
| Technology | 2 | $13B |
|
||
| Mining / Metals | 1 | $23B |
|
||
| Environmental Services | 1 | $16B |
|
||
| Metals / Steel | 1 | $14B |
|
||
| Technology Distribution | 1 | $9B |
|
||
| Homebuilding | 1 | $8B |
|
||
Price history
-18.5% since first listed5 events — show timeline
- 2026-05-09 Price Changed $55,000 ARMLS
- 2026-03-24 Price Changed $57,099 ARMLS
- 2026-03-13 Price Changed $57,100 ARMLS
- 2026-02-11 Price Changed $57,500 ARMLS
- 2026-02-05 Listed $67,500 ARMLS
Cash-flow waterfall
monthlySold comps — $/sqft
last 12 mo · ≤1 miLoading sold comps…