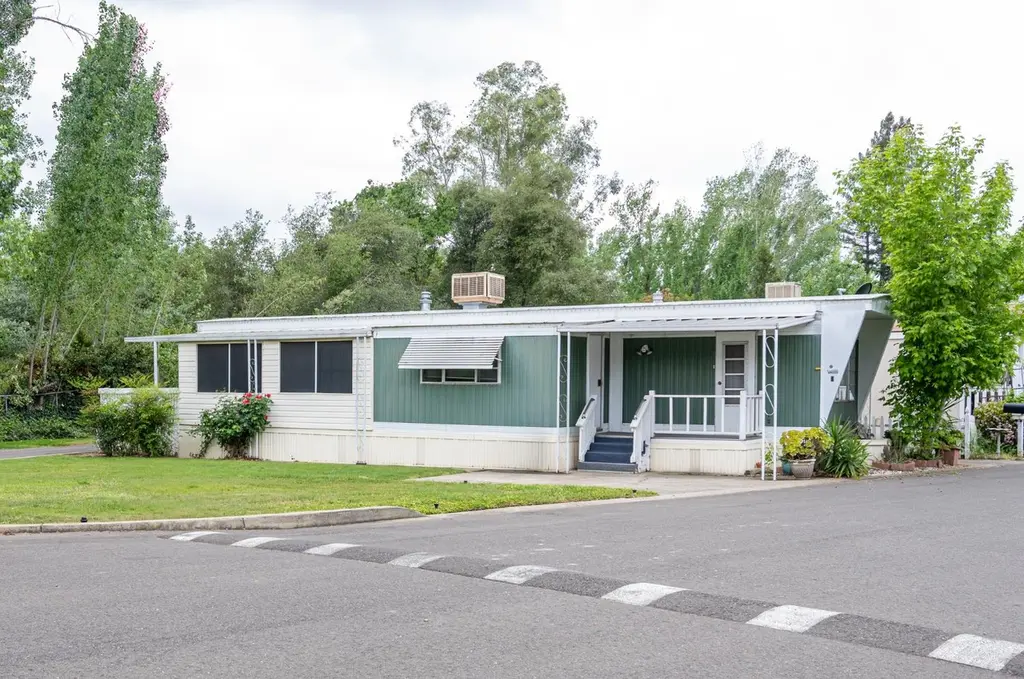
9060 Auburn Folsom Rd #1 · Granite Bay, CA
Flood risk 1/10 · Minimal
- FEMA flood zone
- X (unshaded)
- Chance of flooding over 30 yrs
- 0.0%
- Est. flood insurance / yr
- $507 – $1,088
Fire risk 7/10 · Major
- Est. fire insurance / yr
- $659 – $1,223
Heat risk 7/10 · Major
- Hot days now (above 103°F)
- 7 days/yr
- Hot days in 30 yrs
- 16 days/yr
Wind risk 1/10 · Minimal
- Chance of severe wind over 30 yrs
- —
Air-quality risk 10/10 · Severe
- Unhealthy air days now
- 30 days/yr
- Unhealthy air days in 30 yrs
- 38 days/yr
Risk factors via First Street. Map © Google.
Why this score? — see what drove the D+ grade
The composite is a weighted blend of 9 inputs, each scored 0–100. Each bar is that input's sub-score; the figure is the points it added to the 100-point composite (weight × sub-score).
- Cash flow +15.0/30.0
- ARV discount +7.5/15.0
- Schools +6.2/10.0
- 1% rule +5.0/10.0
- DSCR +5.0/10.0
- Livability +3.2/5.0
- Rent growth +2.5/5.0
- Condition / age +2.5/5.0
- Appreciation +0.0/10.0
$40,000
🖨 Deal sheet 📄 Offer letter ✓ Due diligence
Listing remarks
Bring us an offer! This mobile home is nestled in the heart of Granite Bay at 9060 Auburn Folsom Rd #1. It features an all-original layout providing a rare opportunity to create something truly special. Situated on what is arguably one of the best lots in the park, this corner location provides added privacy and space, with a neighboring common grassy area that feels like an extension of your own yard. Inside, the home retains its original character, offering a blank canvas for your vision. Warm wood accents throughout including distinctive wood walls and ceilings add a rustic charm that can be embraced or reimagined to suit your style. The living area provides a comfortable space to relax,
Key facts
- Corner location
- Original character
- Warm wood accents
Tags
Property features AI
Finance
- Other: Lot is not land-leased (listed land lease amount present but not included per instructions)
- HOA & community: No homeowners association; Located in a senior community; Community contains 58 units
Exterior
- Parking: Attached parking
- Utilities: Individual electric meter; Individual gas meter; Public water; Public sewer
- Home design: Manufactured in-park single wide; Original condition; Built in 1964
- Construction: Aluminum skirting; Other roof
- Exterior features: Corner lot with front yard and garden; Storage and shed(s)
Interior
- Kitchen: Free-standing refrigerator; Gas cooktop; Hood over range; Dishwasher; Double oven; Laminate counters; Breakfast nook and dining bar
- Bedrooms: 1 bedroom
- Flooring: Carpet
- Bathrooms: 1 full bathroom with double sinks and a shower stall
- Heating & cooling: Central heating; Central air conditioning; Ceiling fan(s); Wall and window air conditioning units
- Interior features: Great room living area; Covered and uncovered decks with rails; Porch; Storage area
- Laundry & utility: Indoor laundry room with hookups only
Neighborhood map
What this means for you Summary
Snapshot
- This is a 1-bed/1.0-bath manufactured listed at $40k.
Deal economics
- At list price, monthly cash flow is $2k ($21k/yr) — positive.
- The deal already cash-flows at list — no discount required.
- Meets the 1% rule at list price ($3k rent vs $40k).
- Recommended offer: $38k (6.0% below list) — sets the bar for market timing.
- Cap rate 57.8% vs local median 1.2% in Granite Bay — top-decile yield for the area; either an underpriced asset or a hidden risk that comps aren't pricing in. Stress-test before assuming the spread holds.
Location & tenants
- Location reads 65/100 on livability (#386 in CA) — a middle-class / working-renter tenant base. Strengths: schools A+, employment A+, housing A+; Watch: amenities F, commute F, cost of living F.
- Eureka Union (suburban): math 61% / reading 74% proficiency, ranked #48 of 517 in CA (top 9%) — acceptable for families but not a draw, mixed tenant base, ~2y average lease; only 8% free/reduced lunch — higher-income household profile.
- Market conditions: 164 active listings in the ZIP; high-income renter base; 3,535 units permitted in Placer County in 2024 (689 in 5+ unit buildings).
- This rent is only 17% of the median local income ($183k/yr) — well below the 30% rent-burden line; pricing power to push rent on renewal without tenant pushback.
Forward outlook
- Local home prices are declining (-3.0%/yr); year-one equity from $277 of loan paydown is wiped out by about $1k of value loss. Plan a longer hold.
- Placer County population projected at +20% by 2050 — long-run rental-demand tailwind backs the buy-and-hold thesis.
- At projected returns (-3.0% appreciation + 3.0% rent growth), your $11k cash investment doubles in ~1 year — after that, you're playing with house money.
Negotiation context
- It's been on market 77 days — a 6% lower offer ($38k) is reasonable based on typical stale-listing flexibility.
Risks & watch-outs
- Climate carrying-cost: major wildfire risk; extreme-heat days projected 7→16/yr by 2055 (HVAC capex compounding) — expect insurance premiums to compound above CPI over the hold.
Questions for the listing agent
- It's been on market 77 days. Have you received any prior offers? Is the seller open to a 6% concession, seller financing, or rate buy-down credit?
- Built in 1964 — when were the roof, HVAC, electrical panel, plumbing, and water heater last replaced?
- Why hasn't it sold? Are there any deal-killer items the seller is aware of (foundation, flood, title, zoning, code violations)?
- Is there a deadline driving the sale (1031 exchange, divorce, estate, relocation)? That informs how much negotiation room exists.
- Schools are A-rated — typically a magnet for longer-tenancy family renters. What's the average tenant stay here, and is there a school-zone premium baked into asking?
- The area grade is low — what's the realistic commute time and amenity access for the typical tenant pool here? Any planned neighborhood developments (good or bad) we should know about?
- What's the average days-on-market for RENTAL listings here right now (not sales)? A rising rental-DOM trend means longer vacancies and softer asking-rent achievability than the comps imply.
- What's the recent tenant-quality profile in this submarket — average credit score on applications, eviction rate, late-payment / NSF rate, and stable-employment percentage? A property-management company in the area should have these aggregated.
- How much new for-sale + rental construction is in the pipeline within 1–3 miles? Heavy new supply typically softens prices + rents 12–24 months out; constrained supply supports both.
Investment metrics
- 1% rule
- 6.31% ✓
- Cap rate
- 57.81%
- Cash-on-cash
- 184.00%
- DSCR
- 9.19
- GRM
- 1.3
CMA / ARV
- ARV (on-the-fly)
- $103,320
- Comps found
- 6
Show comp detail 6 sales within ~0.75 mi
| Address | Dist | Beds/Ba | Sqft | Sold | Price | $/sf | Match |
|---|---|---|---|---|---|---|---|
| 9060 Auburn Folsom Rd #7 | 0.00mi | 2/2.0 (+1) | 844 (+0%) | 2mo | $104,000 | $123 | 89 |
| 9060 Auburn Folsom Rd #13 | 0.00mi | 2/1.0 (+1) | 800 (-5%) | 11mo | $80,000 | $100 | 78 |
| 8880 Auburn Folsom Blvd #30 | 0.23mi | 2/1.0 (+1) | 800 (-5%) | 20mo | $58,000 | $73 | 60 |
| 9060 Auburn Folsom Rd #24 | 0.00mi | 2/1.0 (+1) | 720 (-14%) | 21mo | $18,000 | $25 | 54 |
| 6805 Douglas Blvd #37 | 0.68mi | 2/1.0 (+1) | 784 (-7%) | 17mo | $113,000 | $144 | 38 |
| 6805 Douglas Blvd #36 | 0.68mi | 2/1.0 (+1) | 720 (-14%) | 10mo | $115,000 | $160 | 31 |
Match score weights: distance 35% · size 25% · config 20% · recency 20%. Top-matched comps best support the ARV.
Projected returns pro-forma
-3.0% appreciation · 3.0% rent growth · sell at horizon
- IRR
- —
- Equity multiple
- 10.19×
- Total profit
- $102,934
- Equity at exit
- $5,964
- IRR
- —
- Equity multiple
- 21.59×
- Total profit
- $230,628
- Equity at exit
- $3,458
Cash invested: $11,200 (down + closing). Projections, not guarantees.
Landlord ↔ Tenant lean methodology
- Overall (STATE)
- 18 Strongly Tenant-Friendly
- State California
- 18 Strongly Tenant-Friendly · D+13
- County
- — inherits STATE
- City
- — inherits STATE
ZIP-level market 95746
- Active inventory
- 164
- Price-to-rent
- 1.3×
Monthly cashflow live
- Estimated rent
- $2,524 medium interval (Pro) →
- Mortgage (P&I)
- −$210
- Tax est. 1.5%
- −$50 /mo · $600/yr
- Insurance
- −$17
- HOA
- −$0
- Vacancy / Maint / Mgmt
- −$530
- Net cashflow
- $1,717
Break-even live
UW: 25.0% down · 7.5% · 30yr · 1.5% tax · 5.0% vac · 8.0% maint · 8.0% mgmt
Financing live
Cash to close
- Down payment
- $10,000
- Closing costs
- $1,200
- Reserves months
- —
- Total cash needed
- —
Loan-product check · same deal, 3 products live
Conventional
25% down · 7.5% · 30yr
- Down + closing
- —
- Monthly P&I
- —
- Monthly cashflow
- —
- DSCR
- —
- Eligible?
- —
Personal DTI + credit; lowest rate.
DSCR
20% down · 8.5% · 30yr
- Down + closing
- —
- Monthly P&I
- —
- Monthly cashflow
- —
- DSCR
- —
- Eligible?
- —
No personal income docs; deal must DSCR.
Hard money
10% down · 12.0% · 12mo
- Down + closing
- —
- Monthly P&I
- —
- Monthly cashflow
- —
- DSCR
- —
- Eligible?
- —
Short-term bridge; refi at stabilization.
Listing history 13 events
-
2026-06-18days on market $40,000 Active 77 DOM
-
2026-06-17days on market $40,000 Active 76 DOM
-
2026-06-16days on market $40,000 Active 75 DOM
-
2026-06-15days on market $40,000 Active 74 DOM
-
2026-06-13days on market $40,000 Active 72 DOM
-
2026-06-13days on market $40,000 Active 71 DOM
-
2026-06-09days on market $40,000 Active 68 DOM
-
2026-06-08days on market $40,000 Active 67 DOM
-
2026-06-07days on market $40,000 Active 66 DOM
-
2026-06-03days on market $40,000 Active 62 DOM
-
2026-06-02days on market $40,000 Active 61 DOM
-
2026-06-01days on market $40,000 Active 60 DOM
-
2026-05-31days on market $40,000 Active 59 DOM
ⓘ Source: listings_history table (triggers on properties + properties_extension) + one-shot
backfill from property_details.listing_events for pre-trigger history.
Climate risk First Street
- Flood 1/10 Low FEMA zone X (unshaded) · 0% chance over 30 yrs
- Wildfire 7/10 Severe
- Heat 7/10 Severe 7 d/yr ≥103°F today · 16 d/yr by 30 yrs out
- Wind 1/10 Low
- Air quality 10/10 Extreme 30 unhealthy d/yr today · 38 by 30 yrs out
Nearby sold comps map
Loading sold comps map…
Walkable amenities ~0.75 mi
Loading nearby amenities…
Taxation est. · year 1
- Rental income
- $30,285
- − Mortgage interest
- −$2,241
- − Property taxes
- −$600
- − Insurance
- −$200
- − Repairs & maintenance
- −$2,423
- − Management
- −$2,423
- − Depreciation
- −$1,164
- Taxable income
- $21,235
- Est. tax owed @ 24.0%
- −$5,096
- After-tax cash flow
- $15,511/yr
For passive investors: Depreciation is non-cash, so a rental often shows a tax loss while cash-flowing — sheltering income. Rental losses are passive: they offset passive income freely, and up to $25,000/yr can offset ordinary (W-2) income if you actively participate and your MAGI is under $100k (phasing out to $0 by $150k); unused losses carry forward. On sale, claimed depreciation is recaptured at up to 25%, and gains may owe capital-gains tax (a 1031 exchange can defer both). Figures are a year-1 estimate at your 24.0% rate — not tax advice; consult a CPA.
Schools (NCES district)
- District
- Eureka Union
- NCES district ID
- 0613080
- Math proficiency
- 61% ▼ -8.00%
- Reading proficiency
- 74% ▼ -5.00%
- Median HH income
- $103,282
- Composite
- 62.34/100
- National rank
- #695
- State rank
- #48 of 517 in CA
Livability — Granite Bay
- Score
- 65/100
- State rank
- #386
- US rank
- #13127
Category grades
Schools grade is shown separately in the Schools card above.
Census & demographics
- Census place
- Granite Bay, CA
- County
- Placer County · 390,510 people
- City population
- 22,985
- Metro
- Sacramento-Roseville-Folsom, CA
- Population (ZIP)
- 22,985
- Household income
- $183,305
- Rent vs Own
- Severe rent burden
- 176.0
Population outlook (Placer County) Hauer SSP2
- Today (2025)
- 422,709 people
- By 2030
- 444,249 · +5.1%
- By 2040
- 480,192 · +13.6%
- By 2050
- 506,390 · +19.8%
- By 2075
- 550,219 · +30.2%
- By 2100
- 547,760 · +29.6%
Race, ethnicity, and origin ACS 2023
- Neighborhood character
- Predominantly White (72%)
- Race & ethnicity
- White 72% Asian 10% Hispanic / Latino 10% Two or more races 8% Black 3%
- Hispanic origin (detail)
- Mexican 6%
- Common ancestry
- Lithuanian 3% Slovak 3% Romanian 3%
- Foreign-born
- 11% · Canada, China, Vietnam
- Languages at home
- 85% English-only · Spanish 4% Other Indo-European 4% Chinese 1%
Political lean MEDSL · Placer
- 2024 margin
- Lean R (+8.5) · D 44.3% · R 52.8% · Other 2.9%
- 2008→2024 swing
- +2.8pp toward D · 2008: -11.3pp · 2024: -8.5pp
- All cycles
- 2024: R+8.5 2020: R+6.7 2016: R+11.3 2012: R+20.1 2008: R+11.3
Not yet ingested
- Civics
- —
Market trends
- HPI YoY
- ▼ -664.09%
- Current HPI
- 264.5367
- Rent YoY
- —
- Metro
- Sacramento-Roseville-Folsom, CA
- State GDP YoY
- ▲ 3.21%
- F500 in state
- 116
Industry mix (Fortune 500 HQ in CA)
| Industry | F500 HQs | Revenue |
|---|---|---|
| Technology | 27 | $1,492B |
|
||
| Financial Services | 3 | $174B |
|
||
| Retail | 3 | $44B |
|
||
| Insurance | 3 | $26B |
|
||
| Media / Entertainment | 2 | $115B |
|
||
| Pharmaceuticals / Biotech | 2 | $62B |
|
||
Cash-flow waterfall
monthlySold comps — $/sqft
last 12 mo · ≤1 miLoading sold comps…