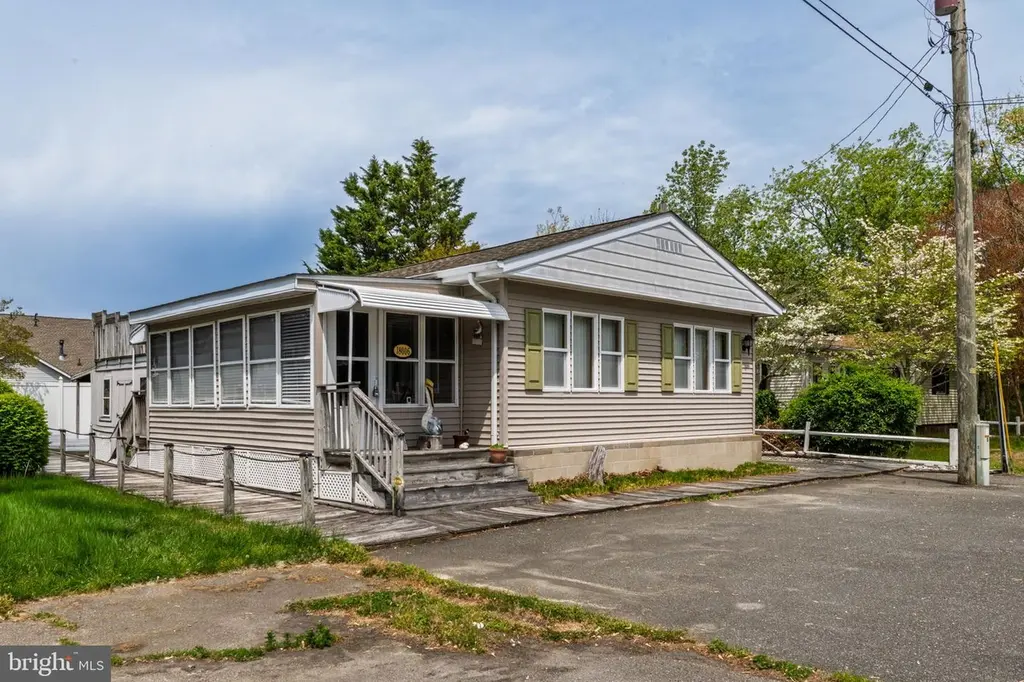
18006 Howard Dr · Lewes, DE
Flood risk 1/10 · Minimal
- FEMA flood zone
- X (unshaded)
- Chance of flooding over 30 yrs
- 0.0%
- Est. flood insurance / yr
- $473 – $860
Fire risk 1/10 · Minimal
- Est. fire insurance / yr
- $476 – $884
Heat risk 8/10 · Major
- Hot days now (above 101°F)
- 7 days/yr
- Hot days in 30 yrs
- 18 days/yr
Wind risk 8/10 · Major
- Chance of severe wind over 30 yrs
- 80.0%
Air-quality risk 2/10 · Minimal
- Unhealthy air days now
- 1 days/yr
- Unhealthy air days in 30 yrs
- 1 days/yr
Risk factors via First Street. Map © Google.
Why this score? — see what drove the C grade
The composite is a weighted blend of 9 inputs, each scored 0–100. Each bar is that input's sub-score; the figure is the points it added to the 100-point composite (weight × sub-score).
- Cash flow +23.9/30.0
- DSCR +7.7/10.0
- ARV discount +7.5/15.0
- 1% rule +5.0/10.0
- Schools +4.2/10.0
- Livability +3.4/5.0
- Rent growth +2.5/5.0
- Condition / age +2.5/5.0
- Appreciation +0.0/10.0
$225,000
🖨 Deal sheet (PDF) 📄 Offer letter ✓ Due diligence
Listing remarks
BRING OFFERS. .. CASH ONLY. .. PRE HUD HOME. Rehoboth Beach getaway with no lot rent and comes mostly furnished. This fee simple 2 bedroom, 3 bath home is close to area restaurants, shopping, movie theater, water park, and public transportation that will take you to downtown Rehoboth Beach. The home is very well maintained. This 960 square feet, sun room, patio, shed, low HOA fees ($60 per year). Property is being sold mostly furnished and in "as is" condition. There are no rental restrictions in the community. Great opportunity in a fabulous location.
Key facts
- 5,227 sq ft lot
- Built 1980
- Listed 31 days
Property features AI
Finance
- Other: Assessor used as source for year built and area measurements; Located outside city limits, east of Route 1
- HOA & community: Annual HOA fee of $60
Exterior
- Parking: Driveway parking
- Utilities: Public sewer; Well required for water; Electric power
- Home design: Manufactured home; Above-grade finished living space reported
- Construction: Aluminum siding; Above-grade and below-grade structures noted; Finished above-grade area reported
- Exterior features: Lot dimensions approximately 50 x 110; Not in a federal flood zone; Ownership is fee simple; 2+ access exits
Interior
- Bedrooms: Two bedrooms on the main level
- Bathrooms: Three full bathrooms (all on the main level)
- Heating & cooling: 90% forced air heating; Forced air heating; Heat pump(s); Electric heating fuel; Central air conditioning (electric); Electric hot water
- Interior features: No basement; Assessor-reported living area
Neighborhood map
What this means for you Summary
Snapshot
- This is a 2-bed/3.0-bath manufactured listed at $225k.
Deal economics
- At list price, monthly cash flow is $435 ($5k/yr) — positive.
- The deal already cash-flows at list — no discount required.
- To meet the 1% rule (rent ≥ 1% of price), the offer needs to be $225k (0.2% below list).
- Recommended offer: $218k (3.0% below list) — sets the bar for market timing.
- Cap rate 8.6% vs local median 1.7% in Lewes — top-decile yield for the area; either an underpriced asset or a hidden risk that comps aren't pricing in. Stress-test before assuming the spread holds.
Location & tenants
- Location reads 67/100 on livability (#40 in DE) — a middle-class / working-renter tenant base. Strengths: crime A+, employment A+, health & safety A+; Watch: commute F, cost of living F.
- Cape Henlopen School District (town): math 42% / reading 55% proficiency, ranked #5 of 26 in DE (top 19%) — families likely to look elsewhere, expect single-tenant / working-renter base with shorter leases.
- Market conditions: 331 active listings in the ZIP; 9 comparable units currently listed for rent nearby; rentals at typical pace (median 22d on market — plan ~3-4 weeks tenant-placement turnaround); 44% of comp listings sitting > 30 days — soft ceiling on asking rent; solid renter incomes; 4,354 units permitted in Sussex County in 2024 (344 in 5+ unit buildings).
Forward outlook
- Local home prices are declining (-3.0%/yr); year-one equity from $2k of loan paydown is wiped out by about $7k of value loss. Plan a longer hold.
- Sussex County population projected at +25% by 2050 — long-run rental-demand tailwind backs the buy-and-hold thesis.
Negotiation context
- It's been on market 31 days — a 3% lower offer ($218k) is reasonable based on typical stale-listing flexibility.
- Current owner paid $43k; list at $225k implies a 423% gain — meaningful room to come down on a strong offer.
Risks & watch-outs
- Climate carrying-cost: severe wind risk, 80% chance of damaging wind over 30y; extreme-heat days projected 7→18/yr by 2055 (HVAC capex compounding) — expect insurance premiums to compound above CPI over the hold.
Questions for the listing agent
- It's been on market 31 days. Have you received any prior offers? Is the seller open to a 3% concession, seller financing, or rate buy-down credit?
- What does the HOA fee cover, when was the last increase, and are there any pending special assessments or reserve-fund shortfalls?
- Is there a deadline driving the sale (1031 exchange, divorce, estate, relocation)? That informs how much negotiation room exists.
- Schools are B-rated — typically a magnet for longer-tenancy family renters. What's the average tenant stay here, and is there a school-zone premium baked into asking?
- What's the average days-on-market for RENTAL listings here right now (not sales)? A rising rental-DOM trend means longer vacancies and softer asking-rent achievability than the comps imply.
- What's the recent tenant-quality profile in this submarket — average credit score on applications, eviction rate, late-payment / NSF rate, and stable-employment percentage? A property-management company in the area should have these aggregated.
- How much new for-sale + rental construction is in the pipeline within 1–3 miles? Heavy new supply typically softens prices + rents 12–24 months out; constrained supply supports both.
Investment metrics
- 1% rule
- 1.00% ✗
- Cap rate
- 8.61%
- Cash-on-cash
- 8.29%
- DSCR
- 1.37
- GRM
- 8.3
CMA / ARV
- ARV (on-the-fly)
- $99,840
- Comps found
- 1
Show comp detail 1 sale within ~0.75 mi
| Address | Dist | Beds/Ba | Sqft | Sold | Price | $/sf | Match |
|---|---|---|---|---|---|---|---|
| 1 Candlelight Ln #2542 | 0.68mi | 2/1.0 | 1,100 (+15%) | 6mo | $114,000 | $104 | 31 |
Match score weights: distance 35% · size 25% · config 20% · recency 20%. Top-matched comps best support the ARV.
Projected returns pro-forma
-3.0% appreciation · 3.0% rent growth · sell at horizon
- IRR
- -3.7%
- Equity multiple
- 0.86×
- Total profit
- $-8,830
- Equity at exit
- $33,548
- IRR
- 5.9%
- Equity multiple
- 1.44×
- Total profit
- $27,614
- Equity at exit
- $19,454
Cash invested: $63,000 (down + closing). Projections, not guarantees.
Landlord ↔ Tenant lean methodology
- Overall (STATE)
- 70 Landlord-Friendly
- State Delaware
- 70 Landlord-Friendly · D+7
- County
- — inherits STATE
- City
- — inherits STATE
ZIP-level market 19971
- Active inventory
- 331
- Price-to-rent
- 8.3×
Monthly cashflow live
- Estimated rent
- $2,246 high interval (Pro) →
- Mortgage (P&I)
- −$1,180
- Tax from tax record
- −$60 /mo · $724/yr
- Insurance
- −$94
- HOA
- −$5
- Vacancy / Maint / Mgmt
- −$472
- Net cashflow
- $435
Break-even live
Sensitivity live
| Price | -10% $563 | -5% $499 | +0% $435 | +5% $372 | +10% $308 |
|---|---|---|---|---|---|
| Rent | -10% $258 | -5% $347 | +0% $435 | +5% $524 | +10% $613 |
| Rate | -1.0pp $549 | -0.5pp $493 | base $435 | +0.5pp $377 | +1.0pp $318 |
UW: 25.0% down · 7.5% · 30yr · 1.5% tax · 5.0% vac · 8.0% maint · 8.0% mgmt
Financing live
Cash to close
- Down payment
- $56,250
- Closing costs
- $6,750
- Reserves months
- —
- Total cash needed
- —
Loan-product check · same deal, 3 products live
Conventional
25% down · 7.5% · 30yr
- Down + closing
- —
- Monthly P&I
- —
- Monthly cashflow
- —
- DSCR
- —
- Eligible?
- —
Personal DTI + credit; lowest rate.
DSCR
20% down · 8.5% · 30yr
- Down + closing
- —
- Monthly P&I
- —
- Monthly cashflow
- —
- DSCR
- —
- Eligible?
- —
No personal income docs; deal must DSCR.
Hard money
10% down · 12.0% · 12mo
- Down + closing
- —
- Monthly P&I
- —
- Monthly cashflow
- —
- DSCR
- —
- Eligible?
- —
Short-term bridge; refi at stabilization.
Rent comps 9 comps
| Address | Beds | Baths | Sqft | Rent | $/sqft | DOM | Units | Dist |
|---|---|---|---|---|---|---|---|---|
| 17829 Callaway Dr #37 Lewes, DE | 3.0 | 2.0 | 1000 | $2,000 | $2.00 | 45d | 1 | 0.34mi |
| 36916 Crooked Hammock Way Lewes, DE | 2.0–3.0 | 2.0 | 1172 | $1,990 | $1.70 | 45d | 1 | 0.50mi |
| 15 Colgate Dr Rehoboth Beach, DE | 3.0 | 2.0 | 1120 | $2,275 | $2.03 | 22d | 1 | 0.80mi |
| 10150 Rockland St Lewes, DE | 1.0–3.0 | 1.5–2.5 | 1217 | $3,375 | $2.77 | 45d | 1 | 0.87mi |
| 32015 Azure Ave Rehoboth Beach, DE | 1.0–3.0 | 1.0–2.0 | 1054 | $2,095 | $1.99 | 45d | 1 | 1.00mi |
| 18482 Evelynton Rd Lewes, DE | 2.0 | 2.0 | 1100 | $1,650 | $1.50 | 14d | 1 | 1.08mi |
| 300 Pebble Dr #318 Rehoboth Beach, DE | 2.0 | 2.0 | 940 | $1,800 | $1.91 | 22d | 1 | 1.33mi |
| 33451 Mackenzie Way Lewes, DE | 1.0 | 1.0 | 784 | $1,679 | $2.14 | 14d | 1 | 1.34mi |
| 35948 Haven Dr #201 Rehoboth Beach, DE | 2.0 | 2.0 | 858 | $1,800 | $2.10 | 22d | 1 | 1.40mi |
HOA detail
- Monthly dues
- $5 · $60/yr
- Likely covers
- water
Listing history 21 events
-
2026-06-18days on market $225,000 Active 31 DOM
-
2026-06-17days on market $225,000 Active 30 DOM
-
2026-06-16days on market $225,000 Active 29 DOM
-
2026-06-15days on market $225,000 Active 28 DOM
-
2026-06-14days on market $225,000 Active 26 DOM
-
2026-06-13remarks 558-char remark
-
2026-06-13days on market $225,000 Active 25 DOM
-
2026-06-10days on market $225,000 Active 23 DOM
-
2026-06-09days on market $225,000 Active 22 DOM
-
2026-06-08days on market $225,000 Active 21 DOM
-
2026-06-07days on market $225,000 Active 20 DOM
-
2026-06-05days on market $225,000 Active 17 DOM
-
2026-06-03days on market $225,000 Active 16 DOM
-
2026-06-02days on market $225,000 Active 15 DOM
-
2026-06-01days on market $225,000 Active 14 DOM
-
2026-05-31days on market $225,000 Active 13 DOM
-
2026-05-30days on market $225,000 Active 12 DOM
-
2026-04-30historical Active Under Contract
-
2026-04-22$249,000 Active
-
2026-04-20historical $249,000
-
1994-06-15soldstatus $43,000
ⓘ Source: listings_history table (triggers on properties + properties_extension) + one-shot
backfill from property_details.listing_events for pre-trigger history.
Tax reassessment forecast DE · Partial reset (capped growth)
- Current annual tax
- $724 · $60/mo
- Projected year-2 tax
- $1,014 · $85/mo
- Expected delta
- +$291/yr (+$24/mo · 40.2%)
ⓘ Screening estimate from a state-policy table — verify with the county assessor before closing.
Climate risk First Street
- Flood 1/10 Low FEMA zone X (unshaded) · 0% chance over 30 yrs
- Wildfire 1/10 Low
- Heat 8/10 Severe 7 d/yr ≥101°F today · 18 d/yr by 30 yrs out
- Wind 8/10 Severe 80% chance of damaging wind over 30 yrs
- Air quality 2/10 Low 1 unhealthy d/yr today · 1 by 30 yrs out
Nearby sold comps map
Loading sold comps map…
Walkable amenities ~0.75 mi
Loading nearby amenities…
Taxation est. · year 1
- Rental income
- $26,952
- − Mortgage interest
- −$12,603
- − Property taxes
- −$724
- − Insurance
- −$1,125
- − Repairs & maintenance
- −$2,156
- − Management
- −$2,156
- − HOA
- −$60
- − Depreciation
- −$6,545
- Taxable income
- $1,582
- Est. tax owed @ 24.0%
- −$380
- After-tax cash flow
- $4,845/yr
For passive investors: Depreciation is non-cash, so a rental often shows a tax loss while cash-flowing — sheltering income. Rental losses are passive: they offset passive income freely, and up to $25,000/yr can offset ordinary (W-2) income if you actively participate and your MAGI is under $100k (phasing out to $0 by $150k); unused losses carry forward. On sale, claimed depreciation is recaptured at up to 25%, and gains may owe capital-gains tax (a 1031 exchange can defer both). Figures are a year-1 estimate at your 24.0% rate — not tax advice; consult a CPA.
Schools (NCES district)
- District
- Cape Henlopen School District
- NCES district ID
- 1000170
- Math proficiency
- 42% ▼ -14.00%
- Reading proficiency
- 55% ▼ -10.00%
- Median HH income
- $60,196
- Composite
- 42.47/100
- National rank
- #3214
- State rank
- #5 of 26 in DE
Livability — Lewes
- Score
- 67/100
- State rank
- #40
- US rank
- #11077
Category grades
Schools grade is shown separately in the Schools card above.
Census & demographics
- County
- Sussex County · 82,708 people
- City population
- 31,938
- Metro
- Salisbury, MD-DE
- Population (ZIP)
- 14,886
- Household income
- $102,146
- Rent vs Own
- Severe rent burden
- 317.0
Population outlook (Sussex County) Hauer SSP2
- Today (2025)
- 248,853 people
- By 2030
- 264,464 · +6.3%
- By 2040
- 290,980 · +16.9%
- By 2050
- 311,259 · +25.1%
- By 2075
- 352,488 · +41.6%
- By 2100
- 367,406 · +47.6%
Race, ethnicity, and origin ACS 2023
- Neighborhood character
- Predominantly White (88%)
- Race & ethnicity
- White 88% Black 4% Two or more races 4% Hispanic / Latino 3% Asian 2%
- Common ancestry
- Romanian 5% Slovak 3% Italian 3%
- Foreign-born
- 6% · Canada, China
- Languages at home
- 95% English-only · Spanish 2% Russian/Polish/Slavic 1% French/Haitian/Cajun 1%
Political lean MEDSL · Sussex
- 2024 margin
- R (+11.0) · D 43.9% · R 54.9% · Other 1.2%
- 2008→2024 swing
- -2.4pp toward R · 2008: -8.6pp · 2024: -11.0pp
- All cycles
- 2024: R+11.0 2020: R+11.2 2016: R+22.0 2012: R+13.0 2008: R+8.6
Not yet ingested
- Civics
- —
Market trends
- HPI YoY
- ▼ -220.39%
- Current HPI
- 353.3977
- Rent YoY
- —
- Metro
- Salisbury, MD-DE
- State GDP YoY
- —
- F500 in state
- 0
Price history
+479.1% since first listed4 events — show timeline
- 2026-04-30 Contingent — BRIGHT MLS
- 2026-04-22 Listed $249,000 BRIGHT MLS
- 2026-04-20 Coming Soon $249,000 BRIGHT MLS
- 1994-06-15 Sold (Public Records) $43,000 Public Records
Property tax history
+5.8%/yrLatest (2025): $724 · +42.5% YoY. Source: county tax records.
Cash-flow waterfall
monthlySold comps — $/sqft
last 12 mo · ≤1 miLoading sold comps…