 Duplex
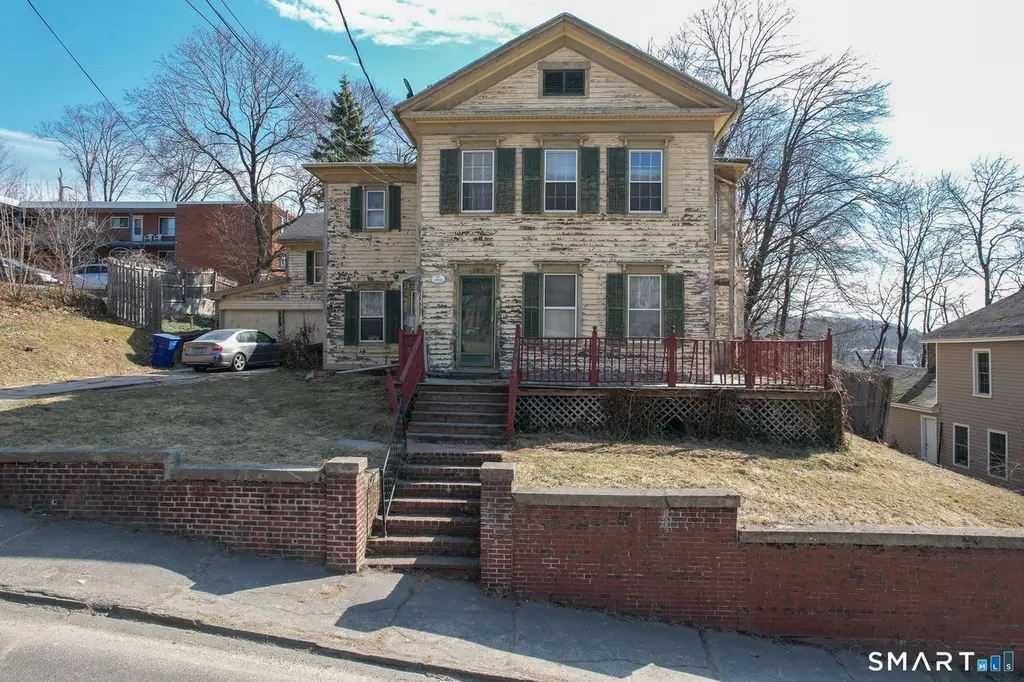
180 Prospect St · Waterbury, CT
Flood risk 1/10 · Minimal
- FEMA flood zone
- X (unshaded)
- Chance of flooding over 30 yrs
- 0.0%
- Est. flood insurance / yr
- $473 – $860
Fire risk 1/10 · Minimal
- Est. fire insurance / yr
- $829 – $1,539
Heat risk 5/10 · Moderate
- Hot days now (above 96°F)
- 7 days/yr
- Hot days in 30 yrs
- 16 days/yr
Wind risk 6/10 · Moderate
- Chance of severe wind over 30 yrs
- 27.0%
Air-quality risk 3/10 · Minor
- Unhealthy air days now
- 2 days/yr
- Unhealthy air days in 30 yrs
- 3 days/yr
Risk factors via First Street. Map © Google.
Why this score? — see what drove the C- grade
The composite is a weighted blend of 9 inputs, each scored 0–100. Each bar is that input's sub-score; the figure is the points it added to the 100-point composite (weight × sub-score).
- Cash flow +23.8/30.0
- DSCR +7.7/10.0
- 1% rule +7.0/10.0
- Livability +4.0/5.0
- ARV discount +2.6/15.0
- Condition / age +2.5/5.0
- Rent growth +2.4/5.0
- Schools +1.5/10.0
- Appreciation +0.0/10.0
$279,900
🖨 Deal sheet 📄 Offer letter ✓ Due diligence
Multi-family units
County records classify this as Multi-Family (2-4 Unit). Listing-text estimate: 2 units. confirmed
Listing remarks
Opportunity awaits at 180 Prospect St in Waterbury, a spacious two-family property offering over 3,500 square feet of potential. This large Multi-family home features two units with generous room sizes, classic hardwood floors, and a flexible layout ideal for investors, owner-occupants, or anyone looking to renovate and build equity. With 3,503 square feet of living space, the property offers ample room to reimagine and update while preserving its original character. A 2-car garage provides additional convenience and storage, while the size and layout of the home present strong possibilities for rental income or multi-generational living. This property does require renovation and is priced
Key facts
- Ample room
- Flexible layout
- Two family property
Tags
Neighborhood map
What this means for you Summary
Snapshot
- This is a 2 × 2-bed/1.2-bath units multifamily listed at $280k.
Deal economics
- At list price, monthly cash flow is $538 ($6k/yr) — positive. Per door: $269/mo.
- The deal already cash-flows at list — no discount required.
- Meets the 1% rule at list price ($3k rent vs $280k).
- Cap rate 8.6% vs local median 3.6% in Waterbury — top-decile yield for the area; either an underpriced asset or a hidden risk that comps aren't pricing in. Stress-test before assuming the spread holds.
Location & tenants
- Location reads 79/100 on livability (#32 in CT, #2,205 nationally) — a middle-class / working-renter tenant base. Strengths: commute A+, cost of living A+, housing A+; Watch: schools D+, crime D, employment D.
- Waterbury School District (suburban): math 12% / reading 23% proficiency, ranked #148 of 153 in CT (top 97%) — low school quality limits family demand, transient renter base, plan for 1-2y turnover; 73% free/reduced lunch — lower-income household profile, screen leases tightly.
- Market conditions: Rents soft (-0.4%/yr); 32 active listings in the ZIP; 24 comparable units currently listed for rent nearby; rentals at typical pace (median 23d on market — plan ~3-4 weeks tenant-placement turnaround); 42% of comp listings sitting > 30 days — soft ceiling on asking rent; lower-income renter base — watch delinquency; 502 units permitted in Naugatuck Valley Planning Region in 2024 (171 in 5+ unit buildings).
- At $3,371/mo this rent would consume 109% of the median local household income ($37k/yr) (locally 856% of renters already pay >50% of income on rent) — very limited rent-growth headroom before tenants either downsize or default.
Forward outlook
- Local home prices are declining (-3.0%/yr); year-one equity from $2k of loan paydown is wiped out by about $8k of value loss. Plan a longer hold.
Negotiation context
- Only 7 days on market — expect competitive offers; lowballing is unlikely to land.
Risks & watch-outs
- Watch-outs: built in 1850 — expect roof / HVAC / electrical / plumbing capex.
- Climate carrying-cost: major wind risk, 27% chance of damaging wind over 30y; extreme-heat days projected 7→16/yr by 2055 (HVAC capex compounding) — expect insurance premiums to compound above CPI over the hold.
Questions for the listing agent
- Can we see the unit-by-unit rent roll, current vacancy, and any below-market leases? What's the average tenancy length?
- What capital expenditures (roof, boiler, parking lot, exteriors) have been made in the last 5 years, and what's planned in the next 2?
- Built in 1850 — when were the roof, HVAC, electrical panel, plumbing, and water heater last replaced?
- Is there a deadline driving the sale (1031 exchange, divorce, estate, relocation)? That informs how much negotiation room exists.
- Schools are D-rated, which usually means shorter tenancies and higher turnover. Who's the typical renter profile here, and what's been the actual vacancy rate?
- Crime grade is D in this area — have there been break-ins, vandalism, or insurance claims at this property in the last 3 years? What carrier currently insures it and at what premium?
- What's the average days-on-market for RENTAL listings here right now (not sales)? A rising rental-DOM trend means longer vacancies and softer asking-rent achievability than the comps imply.
- What's the recent tenant-quality profile in this submarket — average credit score on applications, eviction rate, late-payment / NSF rate, and stable-employment percentage? A property-management company in the area should have these aggregated.
- How much new apartment / multifamily construction is in the pipeline within 1–3 miles? Heavy new supply (>2% of stock underway) typically softens rents 12–24 months out; light construction supports rent growth.
Investment metrics
- 1% rule
- 1.20% ✓
- Cap rate
- 8.60%
- Cash-on-cash
- 8.24%
- DSCR
- 1.37
- GRM
- 6.9
CMA / ARV
- ARV (on-the-fly)
- $252,216
- Comps found
- 1
Show comp detail 1 sale within ~0.75 mi
| Address | Dist | Beds/Ba | Sqft | Sold | Price | $/sf | Match |
|---|---|---|---|---|---|---|---|
| 50 Chestnut Ave | 0.43mi | 5/3.0 (+1) | 3,485 (-0%) | 16mo | $250,000 | $72 | 54 |
Match score weights: distance 35% · size 25% · config 20% · recency 20%. Top-matched comps best support the ARV.
Projected returns pro-forma
-3.0% appreciation · 0.0% rent growth · sell at horizon
- IRR
- -7.4%
- Equity multiple
- 0.73×
- Total profit
- $-20,777
- Equity at exit
- $41,734
- IRR
- -2.5%
- Equity multiple
- 0.85×
- Total profit
- $-11,435
- Equity at exit
- $24,201
Cash invested: $78,372 (down + closing). Projections, not guarantees.
Landlord ↔ Tenant lean methodology
- Overall (STATE)
- 27 Tenant-Leaning
- State Connecticut
- 27 Tenant-Leaning · D+7
- County
- — inherits STATE
- City
- — inherits STATE
ZIP-level market 06710
- Home prices YoY
- -8.1%
- Rents YoY
- -0.4%
- Active inventory
- 32
- Price-to-rent
- 13.8×
Monthly cashflow live
- Estimated rent
- $3,371 high interval (Pro) →
- Mortgage (P&I)
- −$1,468
- Tax from tax record
- −$540 /mo · $6,483/yr
- Insurance
- −$117
- HOA
- −$0
- Vacancy / Maint / Mgmt
- −$708
- Net cashflow
- $538
Break-even live
2-unit breakdown (identical units grouped — click to expand)
| Units | Beds | Baths | Est. rent |
|---|---|---|---|
| 2× units | 2 | 1.2 | $3,370 |
| #1 | 2 | 1.2 | $1,685 |
| #2 | 2 | 1.2 | $1,685 |
| Total (2 units) | $3,371 | ||
UW: 25.0% down · 7.5% · 30yr · 1.5% tax · 5.0% vac · 8.0% maint · 8.0% mgmt
Financing live
Cash to close
- Down payment
- $69,975
- Closing costs
- $8,397
- Reserves months
- —
- Total cash needed
- —
Loan-product check · same deal, 3 products live
Conventional
25% down · 7.5% · 30yr
- Down + closing
- —
- Monthly P&I
- —
- Monthly cashflow
- —
- DSCR
- —
- Eligible?
- —
Personal DTI + credit; lowest rate.
DSCR
20% down · 8.5% · 30yr
- Down + closing
- —
- Monthly P&I
- —
- Monthly cashflow
- —
- DSCR
- —
- Eligible?
- —
No personal income docs; deal must DSCR.
Hard money
10% down · 12.0% · 12mo
- Down + closing
- —
- Monthly P&I
- —
- Monthly cashflow
- —
- DSCR
- —
- Eligible?
- —
Short-term bridge; refi at stabilization.
Rent comps 24 comps
| Address | Beds | Baths | Sqft | Rent | $/sqft | DOM | Units | Dist |
|---|---|---|---|---|---|---|---|---|
| 205 Cooke St Unit 1 Waterbury, CT | 3.0 | 1.0 | 3439 | $1,900 | $0.55 | 3d | 1 | 0.11mi |
| 124 Central Ave Unit 3 Waterbury, CT | 4.0 | 1.0 | 3718 | $1,750 | $0.47 | 14d | 1 | 0.18mi |
| 260 Pine St Unit 3 Waterbury, CT | 3.0 | 1.0 | 3361 | $1,550 | $0.46 | 43d | 1 | 0.23mi |
| 176 Pearl St Unit 3rd Floor Waterbury, CT | 4.0 | 1.0 | 3393 | $2,000 | $0.59 | 3d | 1 | 0.26mi |
| 72 Burton St Waterbury, CT | 3.0 | 1.0 | 2600 | $1,650 | $0.63 | 14d | 1 | 0.27mi |
| 15 Ridgewood St Unit 2 Waterbury, CT | 3.0 | 1.0 | 3229 | $1,600 | $0.50 | 44d | 1 | 0.39mi |
| 15 Ridgewood St Unit 2 Waterbury, CT | 3.0 | 1.0 | 3229 | $1,600 | $0.50 | 23d | 1 | 0.39mi |
| 180 Willow St Unit 1st FL Waterbury, CT | 3.0 | 1.0 | 4160 | $1,600 | $0.38 | 14d | 1 | 0.40mi |
| 16 Arch St Unit 3 Waterbury, CT | 3.0 | 1.0 | 3282 | $2,200 | $0.67 | 21d | 1 | 0.45mi |
| 27 Waterville St Unit 3 Waterbury, CT | 3.0 | 1.0 | 3195 | $1,500 | $0.47 | 3d | 1 | 0.51mi |
| 103 Walnut St Unit 3rd Floor Waterbury, CT | 3.0 | 1.0 | 3157 | $1,650 | $0.52 | 43d | 1 | 0.63mi |
| 1105 N Main St Unit 1 Waterbury, CT | 4.0 | 3.0 | 3948 | $2,300 | $0.58 | 43d | 1 | 0.72mi |
| 1105 N Main St Unit 3 Waterbury, CT | 4.0 | 1.0 | 3948 | $2,000 | $0.51 | 21d | 1 | 0.72mi |
| 36 Vermont St Unit 3 Floor Waterbury, CT | 3.0 | 1.0 | 2892 | $2,000 | $0.69 | 43d | 1 | 0.73mi |
| 36 Vermont St Unit 2 Floor Waterbury, CT | 3.0 | 1.0 | 2892 | $1,800 | $0.62 | 23d | 1 | 0.73mi |
| 249 Lincoln St Waterbury, CT | 3.0 | 1.0 | 4458 | $1,800 | $0.40 | 3d | 1 | 0.80mi |
| 69 W Liberty St Waterbury, CT | 3.0 | 1.0 | 2822 | $1,800 | $0.64 | 43d | 1 | 1.00mi |
| 69 W Liberty St Unit 2 Waterbury, CT | 3.0 | 1.0 | 2822 | $1,750 | $0.62 | 43d | 1 | 1.00mi |
| 137 Clinton St Unit 2 Waterbury, CT | 3.0 | 1.0 | 2694 | $1,850 | $0.69 | 43d | 1 | 1.02mi |
| 79 Robbins St Fl 2 Waterbury, CT | 3.0 | 1.0 | 3960 | $1,800 | $0.45 | 43d | 1 | 1.04mi |
| 155 Congress Ave Unit 2 Waterbury, CT | 3.0 | 1.0 | 3228 | $1,750 | $0.54 | 23d | 1 | 1.12mi |
| 29 Silver St Unit 2 Waterbury, CT | 3.0 | 1.0 | 3625 | $1,750 | $0.48 | 23d | 1 | 1.43mi |
| 73 Lounsbury St Unit 3 Waterbury, CT | 3.0 | 1.0 | 3096 | $1,600 | $0.52 | 19d | 1 | 1.48mi |
| 73 Lounsbury St Unit 3 Waterbury, CT | 3.0 | 1.0 | 3096 | $1,600 | $0.52 | 43d | 1 | 1.48mi |
Listing history 2 events
-
2026-03-19status Under Contract
-
2026-03-12$279,900 Active
ⓘ Source: listings_history table (triggers on properties + properties_extension) + one-shot
backfill from property_details.listing_events for pre-trigger history.
Tax reassessment forecast CT · Partial reset (capped growth)
- Current annual tax
- $6,483 · $540/mo
- Projected year-2 tax
- $6,483 · $540/mo
- Expected delta
- $0/yr ($0/mo · 0.0%)
ⓘ Screening estimate from a state-policy table — verify with the county assessor before closing.
Climate risk First Street
- Flood 1/10 Low FEMA zone X (unshaded) · 0% chance over 30 yrs
- Wildfire 1/10 Low
- Heat 5/10 Major 7 d/yr ≥96°F today · 16 d/yr by 30 yrs out
- Wind 6/10 Major 27% chance of damaging wind over 30 yrs
- Air quality 3/10 Moderate 2 unhealthy d/yr today · 3 by 30 yrs out
Nearby sold comps map
Loading sold comps map…
Walkable amenities ~0.75 mi
Loading nearby amenities…
Taxation est. · year 1
- Rental income
- $40,452
- − Mortgage interest
- −$15,679
- − Property taxes
- −$6,483
- − Insurance
- −$1,400
- − Repairs & maintenance
- −$3,236
- − Management
- −$3,236
- − Depreciation
- −$8,143
- Taxable income
- $2,276
- Est. tax owed @ 24.0%
- −$546
- After-tax cash flow
- $5,914/yr
For passive investors: Depreciation is non-cash, so a rental often shows a tax loss while cash-flowing — sheltering income. Rental losses are passive: they offset passive income freely, and up to $25,000/yr can offset ordinary (W-2) income if you actively participate and your MAGI is under $100k (phasing out to $0 by $150k); unused losses carry forward. On sale, claimed depreciation is recaptured at up to 25%, and gains may owe capital-gains tax (a 1031 exchange can defer both). Figures are a year-1 estimate at your 24.0% rate — not tax advice; consult a CPA.
Schools (NCES district)
- District
- Waterbury School District
- NCES district ID
- 0904830
- Math proficiency
- 12% ▼ -7.00%
- Reading proficiency
- 23% ▼ -8.00%
- Median HH income
- $40,040
- Composite
- 14.85/100
- National rank
- #9380
- State rank
- #148 of 153 in CT
Livability — Waterbury
- Score
- 79/100
- State rank
- #32
- US rank
- #2205
Category grades
Schools grade is shown separately in the Schools card above.
Census & demographics
- Census place
- Waterbury, CT
- County
- New Haven County · 688,236 people
- City population
- 115,012
- Metro
- New Haven-Milford, CT
- Population (ZIP)
- 9,942
- Household income
- $37,191
- Rent vs Own
- Severe rent burden
- 856.0
Population outlook (Naugatuck Valley County) Hauer SSP2
- By 2040
- 496,846
Race, ethnicity, and origin ACS 2023
- Neighborhood character
- Highly diverse neighborhood (Simpson 0.74)
- Race & ethnicity
- Hispanic / Latino 33% Black 29% White 26% Two or more races 16% Asian 2%
- Hispanic origin (detail)
- Mexican 2% Puerto Rican 17% Cuban 2% Dominican 9%
- Common ancestry
- Romanian 2% Italian 2% Estonian 2%
- Foreign-born
- 16% · Canada, Mexico
- Languages at home
- 67% English-only · Spanish 27% Other Indo-European 3% Russian/Polish/Slavic 1%
Political lean MEDSL · Naugatuck Valley
- 2024 margin
- Lean R (+7.4) · D 45.6% · R 53.0% · Other 1.4%
- All cycles
- 2024: R+7.4
Not yet ingested
- Civics
- —
Market trends
- HPI YoY
- ▼ -26.17%
- Current HPI
- 296.1252
- Rent YoY
- ▼ -0.39%
- Metro
- New Haven-Milford, CT
- State GDP YoY
- ▲ 1.06%
- F500 in state
- 38
Industry mix (Fortune 500 HQ in CT)
| Industry | F500 HQs | Revenue |
|---|---|---|
| Industrial Machinery | 4 | $38B |
|
||
| Insurance | 3 | $71B |
|
||
| Financial Services | 2 | $25B |
|
||
| Transportation / Logistics | 2 | $18B |
|
||
| Healthcare | 1 | $247B |
|
||
| Telecommunications | 1 | $55B |
|
||
Price history
2 events — show timeline
- 2026-03-19 Pending — Smart MLS
- 2026-03-12 Listed $279,900 Smart MLS
Property tax history
+8.4%/yrLatest (2023): $6,483 · +152.4% YoY. Source: county tax records.
Cash-flow waterfall
monthlySold comps — $/sqft
last 12 mo · ≤1 miLoading sold comps…