2445 Columbus-lancaster Rd NW #409 · Lancaster, OH
Flood risk No data
- FEMA flood zone
- —
- Chance of flooding over 30 yrs
- —
- Est. flood insurance / yr
- —
Fire risk No data
- Est. fire insurance / yr
- —
Heat risk No data
- Hot days now (above threshold)
- —
- Hot days in 30 yrs
- —
Wind risk No data
- Chance of severe wind over 30 yrs
- —
Air-quality risk No data
- Unhealthy air days now
- —
- Unhealthy air days in 30 yrs
- —
Risk factors via First Street. Map © Google.
Why this score? — see what drove the B grade
The composite is a weighted blend of 9 inputs, each scored 0–100. Each bar is that input's sub-score; the figure is the points it added to the 100-point composite (weight × sub-score).
- Cash flow +30.0/30.0
- 1% rule +10.0/10.0
- DSCR +10.0/10.0
- Livability +4.3/5.0
- ARV discount +4.2/15.0
- Condition / age +4.0/5.0
- Rent growth +3.8/5.0
- Schools +3.7/10.0
- Appreciation +0.0/10.0
$67,977
🖨 Deal sheet 📄 Offer letter ✓ Due diligence
Listing remarks MLS
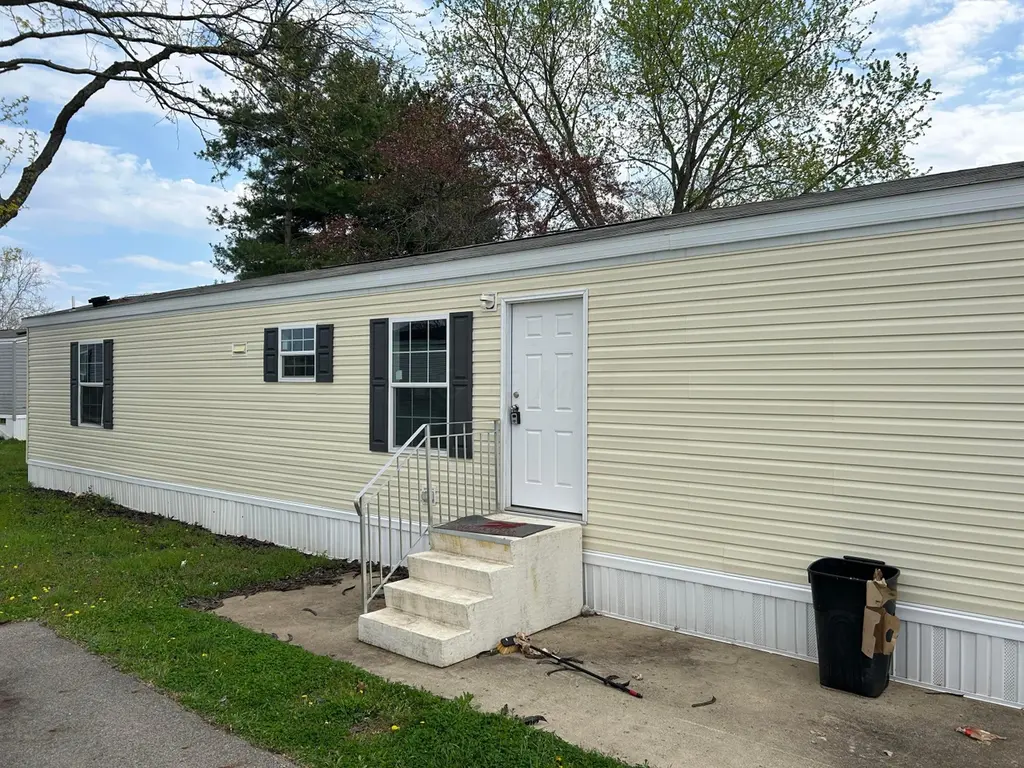
This move-in ready 3-bedroom, 2-bathroom mobile home is a rare find in a community designed for fun and relaxation. Picture yourself enjoying sunny afternoons by the sparkling swimming pool or enjoying time at one of the playgrounds or ball courts. This inviting home features a spacious, light-filled open floor plan perfect for family living and entertaining. The modern kitchen offers ample storage and is ready for your culinary touch. Great location, close to highways, food and shopping.
Key facts
- Open floor plan
- Playgrounds
- Great location
Tags
Neighborhood map
What this means for you Summary
Snapshot
- This is a 3-bed/2.0-bath single-family listed at $68k. Condition is rated good.
Deal economics
- At list price, monthly cash flow is $703 ($8k/yr) — positive.
- The deal already cash-flows at list — no discount required.
- Meets the 1% rule at list price ($1k rent vs $68k).
- Recommended offer: $64k (6.0% below list) — sets the bar for market timing.
- Cap rate 18.7% vs local median 4.0% in Lancaster — top-decile yield for the area; either an underpriced asset or a hidden risk that comps aren't pricing in. Stress-test before assuming the spread holds.
Location & tenants
- Location reads 86/100 on livability (#41 in OH, #423 nationally) — a professional / high-income tenant draw. Strengths: amenities A+, cost of living A+, housing A+; Watch: crime D, employment D.
- Lancaster City (town): math 38% / reading 51% proficiency, ranked #504 of 656 in OH (top 77%) — families likely to look elsewhere, expect single-tenant / working-renter base with shorter leases.
- Market conditions: Rents rising fast (+5.2%/yr); 204 active listings in the ZIP; 475 units permitted in Fairfield County in 2024 (0 in 5+ unit buildings).
Forward outlook
- Local home prices are declining (-3.0%/yr); year-one equity from $470 of loan paydown is wiped out by about $2k of value loss. Plan a longer hold.
- Fairfield County population projected at +8% by 2050 — modest demand growth; plan on rents tracking national, not racing it.
- At projected returns (-3.0% appreciation + 5.2% rent growth), your $19k cash investment doubles in ~3 years — after that, you're playing with house money.
Negotiation context
- It's been on market 66 days — a 6% lower offer ($64k) is reasonable based on typical stale-listing flexibility.
- 2 sale attempts with the ask held roughly flat each time — persistent listings suggest the price (not the market) is what's stuck; bring a comps-based counter.
Questions for the listing agent
- It's been on market 66 days. Have you received any prior offers? Is the seller open to a 6% concession, seller financing, or rate buy-down credit?
- Why hasn't it sold? Are there any deal-killer items the seller is aware of (foundation, flood, title, zoning, code violations)?
- Is there a deadline driving the sale (1031 exchange, divorce, estate, relocation)? That informs how much negotiation room exists.
- Crime grade is D in this area — have there been break-ins, vandalism, or insurance claims at this property in the last 3 years? What carrier currently insures it and at what premium?
- What's the average days-on-market for RENTAL listings here right now (not sales)? A rising rental-DOM trend means longer vacancies and softer asking-rent achievability than the comps imply.
- What's the recent tenant-quality profile in this submarket — average credit score on applications, eviction rate, late-payment / NSF rate, and stable-employment percentage? A property-management company in the area should have these aggregated.
- How much new for-sale + rental construction is in the pipeline within 1–3 miles? Heavy new supply typically softens prices + rents 12–24 months out; constrained supply supports both.
Investment metrics
- 1% rule
- 2.18% ✓
- Cap rate
- 18.71%
- Cash-on-cash
- 44.34%
- DSCR
- 2.97
- GRM
- 3.8
CMA / ARV
- ARV (median comp)
- $63,283
- List price
- $67,977
- Delta
- 7.42%
- Verdict
- FAIR
- Comps
- 20 within 1.0 mi
Show comp detail 9 sales within ~0.75 mi
| Address | Dist | Beds/Ba | Sqft | Sold | Price | $/sf | Match |
|---|---|---|---|---|---|---|---|
| 2445 Columbus Lancaster Rd NW Unit 383 Hemlock | 0.00mi | 2/1.0 (-1) | 924 (+5%) | 3mo | $30,000 | $32 | 80 |
| 2445 Columbus Lancaster Rd NW Lot 408 Walnut St | 0.12mi | 2/1.0 (-1) | 980 (+11%) | 5mo | $5,000 | $5 | 63 |
| 2445 Columbus Lancaster Rd NW Lot 7 | 0.14mi | 3/2.0 | 960 (+9%) | 22mo | $65,600 | $68 | 60 |
| 2445 Columbus Lancaster Rd NW Lot 32 | 0.14mi | 3/2.0 | 980 (+11%) | 19mo | $66,500 | $68 | 58 |
| 2445 Columbus Lancaster Rd NW Lot 210 | 0.14mi | 3/2.0 | 980 (+11%) | 21mo | $60,000 | $61 | 57 |
| 2445 Columbus Lancaster Rd NW Lot 27 | 0.14mi | 3/2.0 | 980 (+11%) | 22mo | $60,000 | $61 | 56 |
| 2445 Columbus Lancaster Rd NW Lot 163 | 0.14mi | 3/2.0 | 980 (+11%) | 23mo | $69,900 | $71 | 55 |
| 2445 Columbus Lancaster Rd NW #126 | 0.14mi | 2/1.5 (-1) | 952 (+8%) | 23mo | $16,000 | $17 | 53 |
| 2445 Columbus-lancaster Rd NW Lot 340 | 0.14mi | 2/1.0 (-1) | 980 (+11%) | 18mo | $38,250 | $39 | 50 |
Match score weights: distance 35% · size 25% · config 20% · recency 20%. Top-matched comps best support the ARV.
Projected returns pro-forma
-3.0% appreciation · 5.22% rent growth · sell at horizon
- IRR
- 43.8%
- Equity multiple
- 2.95×
- Total profit
- $37,191
- Equity at exit
- $10,136
- IRR
- 50.8%
- Equity multiple
- 6.50×
- Total profit
- $104,714
- Equity at exit
- $5,877
Cash invested: $19,034 (down + closing). Projections, not guarantees.
Landlord ↔ Tenant lean methodology
- Overall (STATE)
- 73 Landlord-Friendly
- State Ohio
- 73 Landlord-Friendly · R+6
- County
- — inherits STATE
- City
- — inherits STATE
ZIP-level market 43130
- Rents YoY
- 5.2%
- Active inventory
- 204
- Price-to-rent
- 3.8×
Monthly cashflow live
- Estimated rent
- $1,485 medium interval (Pro) →
- Mortgage (P&I)
- −$356
- Tax est. 1.5%
- −$85 /mo · $1,020/yr
- Insurance
- −$28
- HOA
- −$0
- Vacancy / Maint / Mgmt
- −$312
- Net cashflow
- $703
Break-even live
UW: 25.0% down · 7.5% · 30yr · 1.5% tax · 5.0% vac · 8.0% maint · 8.0% mgmt
Financing live
Cash to close
- Down payment
- $16,994
- Closing costs
- $2,039
- Reserves months
- —
- Total cash needed
- —
Loan-product check · same deal, 3 products live
Conventional
25% down · 7.5% · 30yr
- Down + closing
- —
- Monthly P&I
- —
- Monthly cashflow
- —
- DSCR
- —
- Eligible?
- —
Personal DTI + credit; lowest rate.
DSCR
20% down · 8.5% · 30yr
- Down + closing
- —
- Monthly P&I
- —
- Monthly cashflow
- —
- DSCR
- —
- Eligible?
- —
No personal income docs; deal must DSCR.
Hard money
10% down · 12.0% · 12mo
- Down + closing
- —
- Monthly P&I
- —
- Monthly cashflow
- —
- DSCR
- —
- Eligible?
- —
Short-term bridge; refi at stabilization.
Listing history 16 events
-
2026-06-18days on market $67,977 Active 66 DOM
-
2026-06-17days on market $67,977 Active 65 DOM
-
2026-06-16days on market $67,977 Active 64 DOM
-
2026-06-15days on market $67,977 Active 63 DOM
-
2026-06-13days on market $67,977 Active 61 DOM
-
2026-06-09days on market $67,977 Active 57 DOM
-
2026-06-08days on market $67,977 Active 56 DOM
-
2026-06-07days on market $67,977 Active 55 DOM
-
2026-06-03days on market $67,977 Active 51 DOM
-
2026-06-02days on market $67,977 Active 50 DOM
-
2026-06-01days on market $67,977 Active 49 DOM
-
2026-05-31days on market $67,977 Active 48 DOM
-
2026-05-13price $67,977 493-char remark
Show marketing remark (493 chars)
This move-in ready 3-bedroom, 2-bathroom mobile home is a rare find in a community designed for fun and relaxation. Picture yourself enjoying sunny afternoons by the sparkling swimming pool or enjoying time at one of the playgrounds or ball courts. This inviting home features a spacious, light-filled open floor plan perfect for family living and entertaining. The modern kitchen offers ample storage and is ready for your culinary touch. Great location, close to highways, food and shopping.
-
2026-04-13$69,977 Active 493-char remark
Show marketing remark (493 chars)
This move-in ready 3-bedroom, 2-bathroom mobile home is a rare find in a community designed for fun and relaxation. Picture yourself enjoying sunny afternoons by the sparkling swimming pool or enjoying time at one of the playgrounds or ball courts. This inviting home features a spacious, light-filled open floor plan perfect for family living and entertaining. The modern kitchen offers ample storage and is ready for your culinary touch. Great location, close to highways, food and shopping.
-
2026-04-01historical
-
2026-01-14$78,000 Active
ⓘ Source: listings_history table (triggers on properties + properties_extension) + one-shot
backfill from property_details.listing_events for pre-trigger history.
Nearby sold comps map
Loading sold comps map…
Walkable amenities ~0.75 mi
Loading nearby amenities…
Taxation est. · year 1
- Rental income
- $17,819
- − Mortgage interest
- −$3,808
- − Property taxes
- −$1,020
- − Insurance
- −$340
- − Repairs & maintenance
- −$1,426
- − Management
- −$1,426
- − Depreciation
- −$1,978
- Taxable income
- $7,823
- Est. tax owed @ 24.0%
- −$1,878
- After-tax cash flow
- $6,562/yr
For passive investors: Depreciation is non-cash, so a rental often shows a tax loss while cash-flowing — sheltering income. Rental losses are passive: they offset passive income freely, and up to $25,000/yr can offset ordinary (W-2) income if you actively participate and your MAGI is under $100k (phasing out to $0 by $150k); unused losses carry forward. On sale, claimed depreciation is recaptured at up to 25%, and gains may owe capital-gains tax (a 1031 exchange can defer both). Figures are a year-1 estimate at your 24.0% rate — not tax advice; consult a CPA.
Condition & rehab AI · 12 photos
This move-in ready 3-bedroom, 2-bathroom mobile home is in excellent condition with modern updates and a great location.
Value-add opportunities
- Both Paint exterior siding — Enhances curb appeal and value
- Both Replace window screens — Improves energy efficiency and aesthetics
- Both Install smart home devices — Enhances convenience and marketability
Renovation cost estimate screening
Value-add ROI direction
- Both Paint exterior siding — Enhances curb appeal and value ↑
- Both Replace window screens — Improves energy efficiency and aesthetics ↑
- Both Install smart home devices — Enhances convenience and marketability ↑
ⓘ Cost ranges are severity-bucket heuristics (US national rule-of-thumb). Get contractor quotes + a written scope before underwriting a rehab budget.
Schools (NCES district)
- District
- Lancaster City
- NCES district ID
- 3904420
- Math proficiency
- 38% ▼ -21.00%
- Reading proficiency
- 51% ▼ -11.00%
- Median HH income
- $41,696
- Composite
- 37.39/100
- National rank
- #4427
- State rank
- #504 of 656 in OH
Livability — Lancaster
- Score
- 86/100
- State rank
- #41
- US rank
- #423
Category grades
Schools grade is shown separately in the Schools card above.
Census & demographics
- County
- Fairfield County · 109,896 people
- City population
- 62,933
- Metro
- Columbus, OH
- Population (ZIP)
- 62,933
- Household income
- $72,153
- Rent vs Own
- Severe rent burden
- 1400.0
Population outlook (Fairfield County) Hauer SSP2
- Today (2025)
- 162,442 people
- By 2030
- 166,796 · +2.7%
- By 2040
- 172,835 · +6.4%
- By 2050
- 174,822 · +7.6%
- By 2075
- 174,938 · +7.7%
- By 2100
- 160,988 · -0.9%
Race, ethnicity, and origin ACS 2023
- Neighborhood character
- Predominantly White (91%)
- Race & ethnicity
- White 91% Two or more races 4% Hispanic / Latino 2% Black 2%
- Common ancestry
- Slovak 2% Italian 1% Iranian 1%
- Foreign-born
- 1% · Canada
- Languages at home
- 98% English-only · Spanish 1%
Political lean MEDSL · Fairfield
- 2024 margin
- Strong R (+24.1) · D 37.5% · R 61.6%
- 2008→2024 swing
- -6.9pp toward R · 2008: -17.1pp · 2024: -24.1pp
- All cycles
- 2024: R+24.1 2020: R+23.5 2016: R+27.0 2012: R+16.1 2008: R+17.1
Not yet ingested
- Civics
- —
Market trends
- HPI YoY
- ▼ -298.81%
- Current HPI
- 239.6352
- Rent YoY
- ▲ 5.22%
- Metro
- Columbus, OH
- State GDP YoY
- ▲ 1.98%
- F500 in state
- 48
Industry mix (Fortune 500 HQ in OH)
| Industry | F500 HQs | Revenue |
|---|---|---|
| Insurance | 3 | $145B |
|
||
| Industrial Machinery | 3 | $49B |
|
||
| Financial Services | 3 | $24B |
|
||
| Consumer Goods | 2 | $93B |
|
||
| Aerospace / Defense | 2 | $47B |
|
||
| Utilities | 2 | $33B |
|
||
Price history
-12.8% since first listed4 events — show timeline
- 2026-05-13 Price Changed $67,977 CBRMLS
- 2026-04-13 Listed $69,977 CBRMLS
- 2026-04-01 Listing Removed — CBRMLS
- 2026-01-14 Listed $78,000 CBRMLS
Cash-flow waterfall
monthlySold comps — $/sqft
last 12 mo · ≤1 miLoading sold comps…