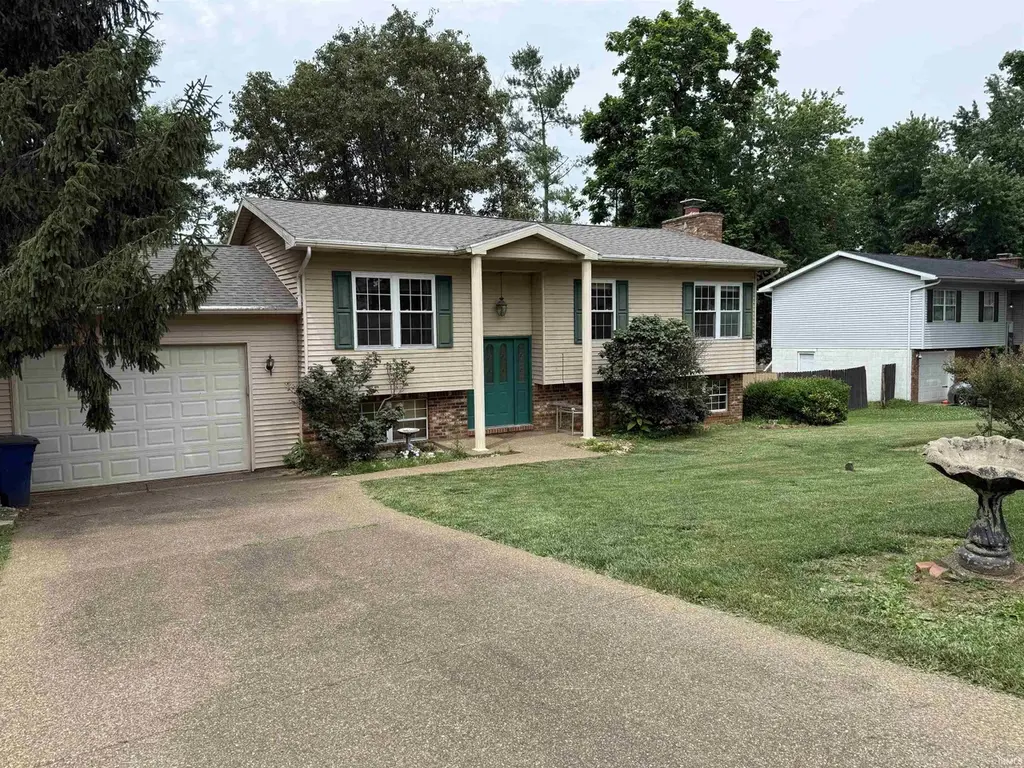
7344 Oakpark Dr · Newburgh, IN
Flood risk 1/10 · Minimal
- FEMA flood zone
- X (unshaded)
- Chance of flooding over 30 yrs
- 0.0%
- Est. flood insurance / yr
- $473 – $860
Fire risk 1/10 · Minimal
- Est. fire insurance / yr
- $717 – $1,331
Heat risk 5/10 · Moderate
- Hot days now (above 106°F)
- 7 days/yr
- Hot days in 30 yrs
- 19 days/yr
Wind risk 2/10 · Minimal
- Chance of severe wind over 30 yrs
- 3.0%
Air-quality risk 4/10 · Minor
- Unhealthy air days now
- 4 days/yr
- Unhealthy air days in 30 yrs
- 6 days/yr
Risk factors via First Street. Map © Google.
Why this score? — see what drove the C- grade
The composite is a weighted blend of 9 inputs, each scored 0–100. Each bar is that input's sub-score; the figure is the points it added to the 100-point composite (weight × sub-score).
- Cash flow +15.8/30.0
- ARV discount +13.3/15.0
- DSCR +4.9/10.0
- Schools +4.9/10.0
- Rent growth +4.7/5.0
- Livability +4.0/5.0
- 1% rule +3.1/10.0
- Condition / age +2.5/5.0
- Appreciation +0.0/10.0
$229,900
🖨 Deal sheet 📄 Offer letter ✓ Due diligence
Listing remarks
Opportunity knocks with this spacious, well-built 4-bed, 2-bath bi-level home featuring over 1,840 sq ft of versatile living space! Nestled in a desirable, established neighborhood, this property is competitively priced to account for cosmetic updates, allowing you to invest directly in your own preferred finishes and build equity. This home has wooden 6 panel doors, crown molding in the living room/dining room area. A pre-inspected home report is ready for review, and major structural elements are already taken care of—including a roof and gutter guards, approx. 7 years ago, a newer water heater, and a newer central air unit. The home has a water softener as well. The interior floor
Key facts
- Bi-level home
- Floored attic system
- Roof replaced
Tags
Property features AI
Finance
- Other: Zoning: R-1 One Family Dwelling
Exterior
- Parking: Attached garage (1.5 spaces)
- Utilities: Public water; Public sewer; Cable available and connected
- Home design: Single-family site-built home; Residential property; Located in the Twin Oaks subdivision; Facing direction: not specified
- Construction: Aluminum siding, brick, and vinyl siding exterior; Block foundation; Shingle roof; Above-grade finished area: 920; Below-grade finished area: 920
- Exterior features: Deck; Chain-link fencing; Sloped lot
Interior
- Kitchen: Laminate counters
- Bedrooms: Total rooms: 8
- Bathrooms: 2 full bathrooms; 1 main level bathroom
- Heating & cooling: Natural gas forced-air heating; Central air conditioning; Ceiling fans
- Interior features: Ceiling fans; Laminate countertops; Wood-burning fireplace in family room (basement)
- Laundry & utility: Laundry in basement
Neighborhood map
What this means for you Summary
Snapshot
- This is a 3-bed/2.0-bath single-family listed at $230k.
Deal economics
- At list price, monthly cash flow is $107 ($1k/yr) — positive.
- The deal already cash-flows at list — no discount required.
- To meet the 1% rule (rent ≥ 1% of price), the offer needs to be $186k (19.3% below list).
- Recommended offer: $186k (19.3% below list) — sets the bar for 1% rule.
- Cap rate 6.8% vs local median 3.9% in Newburgh — top-decile yield for the area; either an underpriced asset or a hidden risk that comps aren't pricing in. Stress-test before assuming the spread holds.
Location & tenants
- Location reads 80/100 on livability (#21 in IN, #1,922 nationally) — a professional / high-income tenant draw. Strengths: crime A+, cost of living A+, housing A+; Watch: amenities F, commute F.
- Warrick County School Corporation (suburban): math 54% / reading 59% proficiency, ranked #24 of 301 in IN (top 8%) — acceptable for families but not a draw, mixed tenant base, ~2y average lease.
- Zoned schools: Sharon Elementary School (math 65% / reading 62%, grade B, #95 of 994 statewide, top 10%, 686 students, 45% FRL); Castle South Middle School (math 43% / reading 57%, grade C, #48 of 330 statewide, top 15%, 712 students, 34% FRL); Castle High School (math 56% / reading 80%, grade B, #22 of 369 statewide, top 6%, 1,961 students, 26% FRL).
- Market conditions: Rents rising fast (+8.7%/yr); 383 active listings in the ZIP; 10 comparable units currently listed for rent nearby; rentals at typical pace (median 21d on market — plan ~3-4 weeks tenant-placement turnaround); solid renter incomes; 249 units permitted in Warrick County in 2024 (0 in 5+ unit buildings).
Forward outlook
- Local home prices are declining (-3.0%/yr); year-one equity from $2k of loan paydown is wiped out by about $7k of value loss. Plan a longer hold.
- Warrick County population projected at +9% by 2050 — modest demand growth; plan on rents tracking national, not racing it.
Negotiation context
- Only 5 days on market — expect competitive offers; lowballing is unlikely to land.
Risks & watch-outs
- Climate carrying-cost: extreme-heat days projected 7→19/yr by 2055 (HVAC capex compounding) — expect insurance premiums to compound above CPI over the hold.
Questions for the listing agent
- Built in 1977 — when were the roof, HVAC, electrical panel, plumbing, and water heater last replaced?
- Is there a deadline driving the sale (1031 exchange, divorce, estate, relocation)? That informs how much negotiation room exists.
- Schools are A-rated — typically a magnet for longer-tenancy family renters. What's the average tenant stay here, and is there a school-zone premium baked into asking?
- What's the average days-on-market for RENTAL listings here right now (not sales)? A rising rental-DOM trend means longer vacancies and softer asking-rent achievability than the comps imply.
- What's the recent tenant-quality profile in this submarket — average credit score on applications, eviction rate, late-payment / NSF rate, and stable-employment percentage? A property-management company in the area should have these aggregated.
- How much new for-sale + rental construction is in the pipeline within 1–3 miles? Heavy new supply typically softens prices + rents 12–24 months out; constrained supply supports both.
Investment metrics
- 1% rule
- 0.81% ✗
- Cap rate
- 6.85%
- Cash-on-cash
- 1.99%
- DSCR
- 1.09
- GRM
- 10.3
CMA / ARV
- ARV (on-the-fly)
- $263,670
- Comps found
- 12
Show comp detail 12 sales within ~0.75 mi
| Address | Dist | Beds/Ba | Sqft | Sold | Price | $/sf | Match |
|---|---|---|---|---|---|---|---|
| 7455 Oakpark Dr | 0.10mi | 3/2.0 | 1,820 (-3%) | 0mo | $282,500 | $155 | 91 |
| 5422 Park Dr | 0.52mi | 3/2.0 | 1,794 (-4%) | 2mo | $253,600 | $141 | 67 |
| 7017 Barlow Ct | 0.69mi | 3/2.0 | 1,877 (+0%) | 1mo | $349,800 | $186 | 66 |
| 6697 Concord Dr | 0.69mi | 4/2.0 (+1) | 1,856 (-1%) | 1mo | $242,000 | $130 | 60 |
| 6986 Ironwood Cir | 0.65mi | 3/2.0 | 1,956 (+5%) | 3mo | $396,900 | $203 | 60 |
| 7833 Marywood Dr | 0.58mi | 3/2.0 | 1,702 (-9%) | 3mo | $231,000 | $136 | 56 |
| 7711 Woodland Dr | 0.64mi | 3/2.0 | 2,035 (+9%) | 1mo | $287,500 | $141 | 54 |
| 6699 Heritage Dr | 0.65mi | 4/2.0 (+1) | 1,972 (+6%) | 2mo | $210,000 | $106 | 54 |
| 7877 Camp Brosend Rd | 0.51mi | 3/2.0 | 1,629 (-13%) | 3mo | $259,900 | $160 | 52 |
| 6644 Concord Dr | 0.74mi | 4/2.0 (+1) | 1,984 (+6%) | 3mo | $230,000 | $116 | 48 |
| 4799 Elizabeth Ln | 0.65mi | 4/2.0 (+1) | 1,656 (-11%) | 1mo | $230,000 | $139 | 45 |
| 5497 E Sherwood Dr | 0.73mi | 4/2.0 (+1) | 2,115 (+13%) | 1mo | $305,000 | $144 | 39 |
Match score weights: distance 35% · size 25% · config 20% · recency 20%. Top-matched comps best support the ARV.
Projected returns pro-forma
-3.0% appreciation · 8.0% rent growth · sell at horizon
- IRR
- -8.4%
- Equity multiple
- 0.68×
- Total profit
- $-20,762
- Equity at exit
- $34,279
- IRR
- 6.1%
- Equity multiple
- 1.54×
- Total profit
- $34,860
- Equity at exit
- $19,878
Cash invested: $64,372 (down + closing). Projections, not guarantees.
Landlord ↔ Tenant lean methodology
- Overall (STATE)
- 90 Strongly Landlord-Friendly
- State Indiana
- 90 Strongly Landlord-Friendly · R+11
- County
- — inherits STATE
- City
- — inherits STATE
ZIP-level market 47630
- Rents YoY
- 8.7%
- Active inventory
- 383
- Price-to-rent
- 10.3×
Monthly cashflow live
- Estimated rent
- $1,856 high interval (Pro) →
- Mortgage (P&I)
- −$1,206
- Tax from tax record
- −$58 /mo · $699/yr
- Insurance
- −$96
- HOA
- −$0
- Vacancy / Maint / Mgmt
- −$390
- Net cashflow
- $107
Break-even live
UW: 25.0% down · 7.5% · 30yr · 1.5% tax · 5.0% vac · 8.0% maint · 8.0% mgmt
Financing live
Cash to close
- Down payment
- $57,475
- Closing costs
- $6,897
- Reserves months
- —
- Total cash needed
- —
Loan-product check · same deal, 3 products live
Conventional
25% down · 7.5% · 30yr
- Down + closing
- —
- Monthly P&I
- —
- Monthly cashflow
- —
- DSCR
- —
- Eligible?
- —
Personal DTI + credit; lowest rate.
DSCR
20% down · 8.5% · 30yr
- Down + closing
- —
- Monthly P&I
- —
- Monthly cashflow
- —
- DSCR
- —
- Eligible?
- —
No personal income docs; deal must DSCR.
Hard money
10% down · 12.0% · 12mo
- Down + closing
- —
- Monthly P&I
- —
- Monthly cashflow
- —
- DSCR
- —
- Eligible?
- —
Short-term bridge; refi at stabilization.
Rent comps 10 comps
| Address | Beds | Baths | Sqft | Rent | $/sqft | DOM | Units | Dist |
|---|---|---|---|---|---|---|---|---|
| 5033 IN-66 Newburgh, IN | 3.0 | 2.5 | 1487 | $2,100 | $1.41 | 21d | 1 | 0.27mi |
| 5200 E Timberwood Dr Newburgh, IN | 4.0 | 3.0 | 1643 | $2,200 | $1.34 | 13d | 1 | 0.42mi |
| 6888 Lexington Dr Newburgh, IN | 3.0 | 2.0 | 1500 | $1,450 | $0.97 | 43d | 1 | 0.47mi |
| 5041 E Sherwood Dr Newburgh, IN | 3.0 | 2.5 | 2077 | $2,350 | $1.13 | 13d | 1 | 0.53mi |
| 8001 Alexandra Ln Newburgh, IN | 3.0 | 1.5 | 1528 | $1,395 | $0.91 | 21d | 1 | 0.66mi |
| 114 Olde Newburgh Dr Newburgh, IN | 3.0 | 2.5 | 1526 | $1,500 | $0.98 | 21d | 1 | 0.94mi |
| 107 Olde Newburgh Dr Newburgh, IN | 2.0 | 2.5 | 1380 | $1,375 | $1.00 | 43d | 1 | 0.96mi |
| 4911 Shenandoah Ave Newburgh, IN | 3.0 | 2.0 | 1274 | $1,695 | $1.33 | 21d | 1 | 1.16mi |
| 4333 Bell Rd Newburgh, IN | 2.0–3.0 | 2.0 | 1170 | $1,549 | $1.32 | 13d | 3 | 1.33mi |
| 8584 Lincoln Ave Newburgh, IN | 3.0 | 2.0 | 1330 | $1,549 | $1.16 | 43d | 1 | 1.33mi |
Listing history 6 events
-
2026-06-18days on market $229,900 Active 5 DOM
-
2026-06-17days on market $229,900 Active 4 DOM
-
2026-06-16days on market $229,900 Active 3 DOM
-
2026-06-15days on market $229,900 Active 2 DOM
-
2026-06-14remarks 693-char remark
-
2026-06-14$229,900 Active 1 DOM
ⓘ Source: listings_history table (triggers on properties + properties_extension) + one-shot
backfill from property_details.listing_events for pre-trigger history.
Tax reassessment forecast IN · Partial reset (capped growth)
- Current annual tax
- $699 · $58/mo
- Projected year-2 tax
- $1,327 · $111/mo
- Expected delta
- +$627/yr (+$52/mo · 89.7%)
ⓘ Screening estimate from a state-policy table — verify with the county assessor before closing.
Climate risk First Street
- Flood 1/10 Low FEMA zone X (unshaded) · 0% chance over 30 yrs
- Wildfire 1/10 Low
- Heat 5/10 Major 7 d/yr ≥106°F today · 19 d/yr by 30 yrs out
- Wind 2/10 Low 3% chance of damaging wind over 30 yrs
- Air quality 4/10 Moderate 4 unhealthy d/yr today · 6 by 30 yrs out
Nearby sold comps map
Loading sold comps map…
Walkable amenities ~0.75 mi
Loading nearby amenities…
Taxation est. · year 1
- Rental income
- $22,274
- − Mortgage interest
- −$12,878
- − Property taxes
- −$699
- − Insurance
- −$1,150
- − Repairs & maintenance
- −$1,782
- − Management
- −$1,782
- − Depreciation
- −$6,688
- Taxable loss
- −$2,704
- Est. tax savings @ 24.0%
- +$649
- After-tax cash flow
- $1,929/yr
For passive investors: Depreciation is non-cash, so a rental often shows a tax loss while cash-flowing — sheltering income. Rental losses are passive: they offset passive income freely, and up to $25,000/yr can offset ordinary (W-2) income if you actively participate and your MAGI is under $100k (phasing out to $0 by $150k); unused losses carry forward. On sale, claimed depreciation is recaptured at up to 25%, and gains may owe capital-gains tax (a 1031 exchange can defer both). Figures are a year-1 estimate at your 24.0% rate — not tax advice; consult a CPA.
Schools (NCES district)
- District
- Warrick County School Corporation
- NCES district ID
- 1812390
- Math proficiency
- 54% ▼ -8.00%
- Reading proficiency
- 59% ▼ -6.00%
- Median HH income
- $62,801
- Composite
- 49.38/100
- National rank
- #2014
- State rank
- #24 of 301 in IN
Livability — Newburgh
- Score
- 80/100
- State rank
- #21
- US rank
- #1922
Category grades
Schools grade is shown separately in the Schools card above.
Census & demographics
- County
- Warrick County · 39,818 people
- City population
- 39,818
- Metro
- Evansville, IN-KY
- Population (ZIP)
- 39,818
- Household income
- $94,162
- Rent vs Own
- Severe rent burden
- 770.0
Population outlook (Warrick County) Hauer SSP2
- Today (2025)
- 66,569 people
- By 2030
- 68,404 · +2.8%
- By 2040
- 71,131 · +6.9%
- By 2050
- 72,743 · +9.3%
- By 2075
- 76,088 · +14.3%
- By 2100
- 72,261 · +8.6%
Race, ethnicity, and origin ACS 2023
- Neighborhood character
- Predominantly White (88%)
- Race & ethnicity
- White 88% Two or more races 5% Black 3% Hispanic / Latino 3% Asian 3%
- Common ancestry
- Italian 3% Lithuanian 2% Romanian 2%
- Foreign-born
- 5% · Canada, China
- Languages at home
- 96% English-only · Spanish 2% Other Indo-European 1%
Political lean MEDSL · Warrick
- 2024 margin
- Solid R (+30.2) · D 34.1% · R 64.3% · Other 1.5%
- 2008→2024 swing
- -17.4pp toward R · 2008: -12.8pp · 2024: -30.2pp
- All cycles
- 2024: R+30.2 2020: R+27.8 2016: R+33.9 2012: R+26.6 2008: R+12.8
Not yet ingested
- Civics
- —
Market trends
- HPI YoY
- ▼ -187.44%
- Current HPI
- 185.7643
- Rent YoY
- ▲ 8.69%
- Metro
- Evansville, IN-KY
- State GDP YoY
- ▲ 2.90%
- F500 in state
- 18
Industry mix (Fortune 500 HQ in IN)
| Industry | F500 HQs | Revenue |
|---|---|---|
| Industrial Machinery | 2 | $37B |
|
||
| Healthcare | 1 | $177B |
|
||
| Pharmaceuticals | 1 | $45B |
|
||
| Metals / Steel | 1 | $18B |
|
||
| Agriculture | 1 | $17B |
|
||
| Packaging | 1 | $12B |
|
||
Price history
1 event — show timeline
- 2026-06-13 Listed $229,900 IRMLS
Property tax history
+5.7%/yrLatest (2024): $699 · +2.0% YoY. Source: county tax records.
Cash-flow waterfall
monthlySold comps — $/sqft
last 12 mo · ≤1 miLoading sold comps…