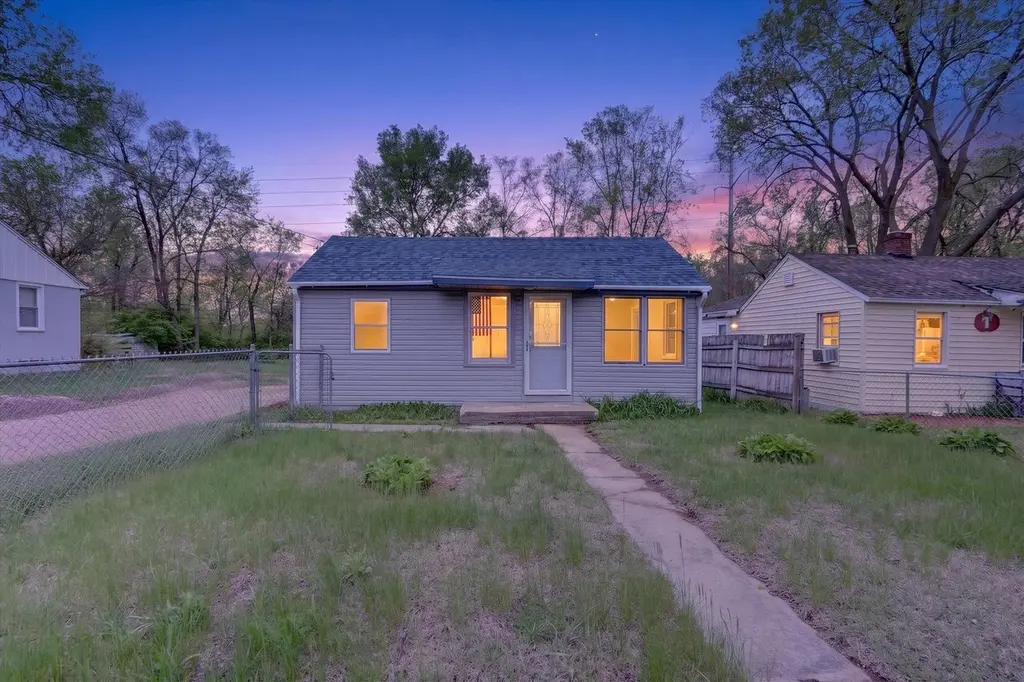
3211 7th St · Rockford, IL
Flood risk 1/10 · Minimal
- FEMA flood zone
- X (unshaded)
- Chance of flooding over 30 yrs
- 0.0%
- Est. flood insurance / yr
- $507 – $1,088
Fire risk 1/10 · Minimal
- Est. fire insurance / yr
- $804 – $1,492
Heat risk 2/10 · Minimal
- Hot days now (above 101°F)
- 7 days/yr
- Hot days in 30 yrs
- 15 days/yr
Wind risk 2/10 · Minimal
- Chance of severe wind over 30 yrs
- —
Air-quality risk 2/10 · Minimal
- Unhealthy air days now
- 1 days/yr
- Unhealthy air days in 30 yrs
- 2 days/yr
Risk factors via First Street. Map © Google.
Why this score? — see what drove the D+ grade
The composite is a weighted blend of 9 inputs, each scored 0–100. Each bar is that input's sub-score; the figure is the points it added to the 100-point composite (weight × sub-score).
- Cash flow +20.5/30.0
- ARV discount +7.5/15.0
- DSCR +6.5/10.0
- 1% rule +5.0/10.0
- Livability +3.1/5.0
- Rent growth +2.5/5.0
- Condition / age +2.5/5.0
- Schools +1.2/10.0
- Appreciation +0.0/10.0
$110,000
🖨 Deal sheet 📄 Offer letter ✓ Due diligence
Listing remarks MLS
Fully updated 2-bedroom, 1-bath ranch offering 920 sq ft of move-in ready living space-perfect for a first-time homebuyer or rental investment opportunity! This home features fresh paint throughout, all new laminate flooring, and a completely updated kitchen. Major improvements completed in 2026 include new windows, siding, A/C, and garage door opener, providing low-maintenance living and peace of mind for years to come. Enjoy the fenced-in yard, ideal for pets, play, or outdoor entertaining. Turnkey and ready for immediate occupancy-don't miss this opportunity to own an affordable, fully refreshed home!
Key facts
- 6,098 sq ft lot
- 2 garage spots
- Built 1940
Property features AI
Finance
- Other: Annual property tax: $1,248
Exterior
- Parking: Detached 2-car garage
- Utilities: Public water; Public sewer
- Home design: Single family residence; Residential property
- Exterior features: Shingle roof; 0.14-acre lot
Interior
- Kitchen: Gas cooktop; Refrigerator
- Bathrooms: 1 full bathroom (main level)
- Heating & cooling: Forced air heating; Central air conditioning
- Interior features: Gas cooktop; Refrigerator; Gas water heater; Crawl space basement
Neighborhood map
What this means for you Summary
Snapshot
- This is a 2-bed/1.0-bath single-family listed at $110k.
Deal economics
- At list price, monthly cash flow is $145 ($2k/yr) — positive.
- The deal already cash-flows at list — no discount required.
- Meets the 1% rule at list price ($1k rent vs $110k).
- Cap rate 7.9% vs local median 6.1% in Rockford — meaningfully above typical; check what's discounted (condition, days-on-market, listing class) to confirm the premium yield is real.
Location & tenants
- Location reads 62/100 on livability (#876 in IL) — a middle-class / working-renter tenant base. Strengths: cost of living A+, housing A+, health & safety A+; Watch: crime F, amenities F, commute F.
- Rockford SD 205 (urban): math 12% / reading 16% proficiency, ranked #533 of 620 in IL (top 86%) — low school quality limits family demand, transient renter base, plan for 1-2y turnover; 73% free/reduced lunch — lower-income household profile, screen leases tightly.
- Zoned schools: Riverdahl Elem School (math 2% / reading 2%, grade F, #1,927 of 2,056 statewide, top 100%, 561 students, 0% FRL); Rockford Envrnmntl Science Acad (math 0% / reading 7%, grade F, #652 of 665 statewide, top 98%, 1,051 students, 0% FRL); Jefferson High School (math 3% / reading 9%, grade F, #608 of 693 statewide, top 88%, 2,114 students, 0% FRL) — zoned schools average 0% FRL vs 73% district-wide (73 pts lower); this property's tenant base skews higher-income than the district average.
- Market conditions: 84 active listings in the ZIP; 9 comparable units currently listed for rent nearby; rentals lingering (median 44d on market — plan ~5-8 weeks vacancy on turnover, expect pricing pressure); 78% of comp listings sitting > 30 days — soft ceiling on asking rent; 285 units permitted in Winnebago County in 2024 (0 in 5+ unit buildings).
Forward outlook
- Local home prices are declining (-3.0%/yr); year-one equity from $761 of loan paydown is wiped out by about $3k of value loss. Plan a longer hold.
- Winnebago County population projected at -20% by 2050 — secular population decline; favor cash flow + early exit over multi-decade hold.
Negotiation context
- Only 7 days on market — expect competitive offers; lowballing is unlikely to land.
- 2 sale attempts with the ask held roughly flat each time — persistent listings suggest the price (not the market) is what's stuck; bring a comps-based counter.
Risks & watch-outs
- Watch-outs: built in 1940 — expect roof / HVAC / electrical / plumbing capex.
Questions for the listing agent
- Built in 1940 — when were the roof, HVAC, electrical panel, plumbing, and water heater last replaced?
- Is there a deadline driving the sale (1031 exchange, divorce, estate, relocation)? That informs how much negotiation room exists.
- Schools are F-rated, which usually means shorter tenancies and higher turnover. Who's the typical renter profile here, and what's been the actual vacancy rate?
- Crime grade is F in this area — have there been break-ins, vandalism, or insurance claims at this property in the last 3 years? What carrier currently insures it and at what premium?
- The area grade is low — what's the realistic commute time and amenity access for the typical tenant pool here? Any planned neighborhood developments (good or bad) we should know about?
- What's the average days-on-market for RENTAL listings here right now (not sales)? A rising rental-DOM trend means longer vacancies and softer asking-rent achievability than the comps imply.
- What's the recent tenant-quality profile in this submarket — average credit score on applications, eviction rate, late-payment / NSF rate, and stable-employment percentage? A property-management company in the area should have these aggregated.
- How much new for-sale + rental construction is in the pipeline within 1–3 miles? Heavy new supply typically softens prices + rents 12–24 months out; constrained supply supports both.
Investment metrics
- 1% rule
- 1.00% ✓
- Cap rate
- 7.88%
- Cash-on-cash
- 5.66%
- DSCR
- 1.25
- GRM
- 8.3
CMA / ARV
- ARV (median comp)
- $70,263
- List price
- $110,000
- Delta
- 56.55%
- Verdict
- OVERPRICED
- Comps
- 20 within 1.0 mi
Show comp detail 12 sales within ~0.75 mi
| Address | Dist | Beds/Ba | Sqft | Sold | Price | $/sf | Match |
|---|---|---|---|---|---|---|---|
| 3211 7th St | 0.00mi | 2/1.0 | 920 (0%) | 0mo | $114,000 | $124 | 100 |
| 614 Kennon Rd | 0.34mi | 2/1.0 | 960 (+4%) | 9mo | $115,000 | $120 | 69 |
| 3016 7th St | 0.19mi | 3/1.0 (+1) | 836 (-9%) | 4mo | $128,000 | $153 | 68 |
| 826 Barnum Rd | 0.18mi | 3/1.0 (+1) | 989 (+8%) | 8mo | $185,000 | $187 | 67 |
| 827 Sawyer Rd | 0.12mi | 2/1.0 | 786 (-15%) | 5mo | $73,000 | $93 | 66 |
| 3126 8th St | 0.13mi | 3/1.0 (+1) | 1,000 (+9%) | 10mo | $95,000 | $95 | 66 |
| 820 Brooke Rd | 0.32mi | 3/2.0 (+1) | 950 (+3%) | 11mo | $60,000 | $63 | 62 |
| 2817 9th St | 0.53mi | 3/2.0 (+1) | 874 (-5%) | 1mo | $149,900 | $172 | 57 |
| 2930 11th St | 0.58mi | 2/1.0 | 832 (-10%) | 1mo | $120,000 | $144 | 56 |
| 1729 Johnson Ave | 0.69mi | 2/1.0 | 887 (-4%) | 9mo | $118,000 | $133 | 54 |
| 412 Brooke Rd | 0.63mi | 2/1.0 | 973 (+6%) | 11mo | $95,000 | $98 | 52 |
| 2837 10th St | 0.55mi | 2/1.0 | 816 (-11%) | 5mo | $30,000 | $37 | 51 |
Match score weights: distance 35% · size 25% · config 20% · recency 20%. Top-matched comps best support the ARV.
Projected returns pro-forma
-3.0% appreciation · 3.0% rent growth · sell at horizon
- IRR
- -7.5%
- Equity multiple
- 0.72×
- Total profit
- $-8,575
- Equity at exit
- $16,401
- IRR
- 2.0%
- Equity multiple
- 1.14×
- Total profit
- $4,433
- Equity at exit
- $9,511
Cash invested: $30,800 (down + closing). Projections, not guarantees.
Landlord ↔ Tenant lean methodology
- Overall (STATE)
- 43 Moderately Tenant-Leaning
- State Illinois
- 43 Moderately Tenant-Leaning · D+7
- County
- — inherits STATE
- City
- — inherits STATE
ZIP-level market 61109
- Home prices YoY
- -19.7%
- Active inventory
- 84
- Price-to-rent
- 8.3×
Monthly cashflow live
- Estimated rent
- $1,104 high interval (Pro) →
- Mortgage (P&I)
- −$577
- Tax from tax record
- −$104 /mo · $1,248/yr
- Insurance
- −$46
- HOA
- −$0
- Vacancy / Maint / Mgmt
- −$232
- Net cashflow
- $145
Break-even live
UW: 25.0% down · 7.5% · 30yr · 1.5% tax · 5.0% vac · 8.0% maint · 8.0% mgmt
Financing live
Cash to close
- Down payment
- $27,500
- Closing costs
- $3,300
- Reserves months
- —
- Total cash needed
- —
Loan-product check · same deal, 3 products live
Conventional
25% down · 7.5% · 30yr
- Down + closing
- —
- Monthly P&I
- —
- Monthly cashflow
- —
- DSCR
- —
- Eligible?
- —
Personal DTI + credit; lowest rate.
DSCR
20% down · 8.5% · 30yr
- Down + closing
- —
- Monthly P&I
- —
- Monthly cashflow
- —
- DSCR
- —
- Eligible?
- —
No personal income docs; deal must DSCR.
Hard money
10% down · 12.0% · 12mo
- Down + closing
- —
- Monthly P&I
- —
- Monthly cashflow
- —
- DSCR
- —
- Eligible?
- —
Short-term bridge; refi at stabilization.
Rent comps 9 comps
| Address | Beds | Baths | Sqft | Rent | $/sqft | DOM | Units | Dist |
|---|---|---|---|---|---|---|---|---|
| 2846 Lapey St Rockford, IL | 1.0 | 1.0 | 700 | $800 | $1.14 | 44d | 1 | 0.56mi |
| 1213 39th Ave Rockford, IL | 1.0 | 1.0 | 800 | $900 | $1.12 | 21d | 1 | 1.06mi |
| 1418 22nd Ave Rockford, IL | 2.0 | 1.0 | 950 | $1,200 | $1.26 | 44d | 1 | 1.14mi |
| 1209 21st Pl Rockford, IL | 2.0 | 1.0 | 1040 | $1,350 | $1.30 | 44d | 1 | 1.14mi |
| 1420 22nd Ave Rockford, IL | 2.0 | 1.0 | 950 | $1,200 | $1.26 | 44d | 1 | 1.14mi |
| 1211 21st Pl Rockford, IL | 2.0 | 1.0 | 1040 | $1,350 | $1.30 | 44d | 1 | 1.14mi |
| 2010 Kishwaukee St Unit 20102-N Rockford, IL | 1.0 | 1.0 | 1000 | $875 | $0.88 | 44d | 1 | 1.37mi |
| 2208 Christina St Rockford, IL | 2.0 | 1.0 | 700 | $1,300 | $1.86 | 21d | 1 | 1.44mi |
| 914 18th Ave Rockford, IL | 2.0 | 1.0 | 1123 | $900 | $0.80 | 44d | 1 | 1.45mi |
Listing history 4 events
-
2026-05-07status Pending 611-char remark
Show marketing remark (611 chars)
Fully updated 2-bedroom, 1-bath ranch offering 920 sq ft of move-in ready living space-perfect for a first-time homebuyer or rental investment opportunity! This home features fresh paint throughout, all new laminate flooring, and a completely updated kitchen. Major improvements completed in 2026 include new windows, siding, A/C, and garage door opener, providing low-maintenance living and peace of mind for years to come. Enjoy the fenced-in yard, ideal for pets, play, or outdoor entertaining. Turnkey and ready for immediate occupancy-don't miss this opportunity to own an affordable, fully refreshed home!
-
2026-05-07status Pending 629-char remark
Show marketing remark (611 chars)
Fully updated 2-bedroom, 1-bath ranch offering 920 sq ft of move-in ready living space-perfect for a first-time homebuyer or rental investment opportunity! This home features fresh paint throughout, all new laminate flooring, and a completely updated kitchen. Major improvements completed in 2026 include new windows, siding, A/C, and garage door opener, providing low-maintenance living and peace of mind for years to come. Enjoy the fenced-in yard, ideal for pets, play, or outdoor entertaining. Turnkey and ready for immediate occupancy-don't miss this opportunity to own an affordable, fully refreshed home!
-
2026-04-30$110,000 Active 611-char remark
Show marketing remark (611 chars)
Fully updated 2-bedroom, 1-bath ranch offering 920 sq ft of move-in ready living space-perfect for a first-time homebuyer or rental investment opportunity! This home features fresh paint throughout, all new laminate flooring, and a completely updated kitchen. Major improvements completed in 2026 include new windows, siding, A/C, and garage door opener, providing low-maintenance living and peace of mind for years to come. Enjoy the fenced-in yard, ideal for pets, play, or outdoor entertaining. Turnkey and ready for immediate occupancy-don't miss this opportunity to own an affordable, fully refreshed home!
-
2026-04-30$110,000 Active 629-char remark
Show marketing remark (611 chars)
Fully updated 2-bedroom, 1-bath ranch offering 920 sq ft of move-in ready living space-perfect for a first-time homebuyer or rental investment opportunity! This home features fresh paint throughout, all new laminate flooring, and a completely updated kitchen. Major improvements completed in 2026 include new windows, siding, A/C, and garage door opener, providing low-maintenance living and peace of mind for years to come. Enjoy the fenced-in yard, ideal for pets, play, or outdoor entertaining. Turnkey and ready for immediate occupancy-don't miss this opportunity to own an affordable, fully refreshed home!
ⓘ Source: listings_history table (triggers on properties + properties_extension) + one-shot
backfill from property_details.listing_events for pre-trigger history.
Tax reassessment forecast IL · Partial reset (capped growth)
- Current annual tax
- $1,248 · $104/mo
- Projected year-2 tax
- $1,873 · $156/mo
- Expected delta
- +$624/yr (+$52/mo · 50.0%)
ⓘ Screening estimate from a state-policy table — verify with the county assessor before closing.
Climate risk First Street
- Flood 1/10 Low FEMA zone X (unshaded) · 0% chance over 30 yrs
- Wildfire 1/10 Low
- Heat 2/10 Low 7 d/yr ≥101°F today · 15 d/yr by 30 yrs out
- Wind 2/10 Low
- Air quality 2/10 Low 1 unhealthy d/yr today · 2 by 30 yrs out
Nearby sold comps map
Loading sold comps map…
Walkable amenities ~0.75 mi
Loading nearby amenities…
Taxation est. · year 1
- Rental income
- $13,246
- − Mortgage interest
- −$6,162
- − Property taxes
- −$1,248
- − Insurance
- −$550
- − Repairs & maintenance
- −$1,060
- − Management
- −$1,060
- − Depreciation
- −$3,200
- Taxable loss
- −$34
- Est. tax savings @ 24.0%
- +$8
- After-tax cash flow
- $1,752/yr
For passive investors: Depreciation is non-cash, so a rental often shows a tax loss while cash-flowing — sheltering income. Rental losses are passive: they offset passive income freely, and up to $25,000/yr can offset ordinary (W-2) income if you actively participate and your MAGI is under $100k (phasing out to $0 by $150k); unused losses carry forward. On sale, claimed depreciation is recaptured at up to 25%, and gains may owe capital-gains tax (a 1031 exchange can defer both). Figures are a year-1 estimate at your 24.0% rate — not tax advice; consult a CPA.
Schools (NCES district)
- District
- Rockford SD 205
- NCES district ID
- 1734510
- Math proficiency
- 12% ▼ -2.00%
- Reading proficiency
- 16% ▼ -3.00%
- Median HH income
- $42,533
- Composite
- 12.21/100
- National rank
- #9649
- State rank
- #533 of 620 in IL
Livability — Rockford
- Score
- 62/100
- State rank
- #876
- US rank
- #17035
Category grades
Schools grade is shown separately in the Schools card above.
Census & demographics
- Census place
- Rockford, IL
- County
- Winnebago County · 147,297 people
- City population
- 147,297
- Metro
- Rockford, IL
- Population (ZIP)
- 26,768
- Household income
- $62,973
- Rent vs Own
- Severe rent burden
- 941.0
Population outlook (Winnebago County) Hauer SSP2
- Today (2025)
- 271,080 people
- By 2030
- 260,684 · -3.8%
- By 2040
- 238,405 · -12.1%
- By 2050
- 216,129 · -20.3%
- By 2075
- 172,882 · -36.2%
- By 2100
- 135,336 · -50.1%
Race, ethnicity, and origin ACS 2023
- Neighborhood character
- Diverse neighborhood (Simpson 0.62)
- Race & ethnicity
- White 57% Hispanic / Latino 21% Black 13% Two or more races 11% Asian 5%
- Hispanic origin (detail)
- Mexican 17% Puerto Rican 1%
- Common ancestry
- Romanian 3% Slovak 2% Portuguese 2%
- Foreign-born
- 13% · Canada, Philippines, China
- Languages at home
- 79% English-only · Spanish 16% Other Asian/Pacific 2% Russian/Polish/Slavic 1%
Political lean MEDSL · Winnebago
- 2024 margin
- Toss-up / Even · D 49.5% · R 49.0% · Other 1.5%
- 2008→2024 swing
- -12.2pp toward R · 2008: 12.8pp · 2024: 0.6pp
- All cycles
- 2024: D+0.6 2020: D+2.5 2016: R+1.2 2012: D+5.7 2008: D+12.8
Not yet ingested
- Civics
- —
Market trends
- HPI YoY
- ▼ -72.42%
- Current HPI
- 296.0019
- Rent YoY
- —
- Metro
- Rockford, IL
- State GDP YoY
- ▲ 1.59%
- F500 in state
- 60
Industry mix (Fortune 500 HQ in IL)
| Industry | F500 HQs | Revenue |
|---|---|---|
| Insurance | 4 | $201B |
|
||
| Consumer Goods | 4 | $87B |
|
||
| Industrial Machinery | 3 | $64B |
|
||
| Healthcare | 2 | $55B |
|
||
| Retail / Pharmacy | 1 | $148B |
|
||
| Agriculture / Food | 1 | $86B |
|
||
Price history
+3.6% since first listed6 events — show timeline
- 2026-06-09 Sold (MLS) $114,000 NWIAR
- 2026-06-09 Sold (MLS) $114,000 MRED as Distributed by MLS Grid
- 2026-05-07 Pending — MRED as Distributed by MLS Grid
- 2026-05-07 Pending — NWIAR
- 2026-04-30 Listed $110,000 NWIAR
- 2026-04-30 Listed $110,000 MRED as Distributed by MLS Grid
Property tax history
+1.0%/yrLatest (2025): $1,248 · +12.6% YoY. Source: county tax records.
Cash-flow waterfall
monthlySold comps — $/sqft
last 12 mo · ≤1 miLoading sold comps…