2201 NE 66th St #1306 · Fort Lauderdale, FL
Flood risk No data
- FEMA flood zone
- —
- Chance of flooding over 30 yrs
- —
- Est. flood insurance / yr
- —
Fire risk No data
- Est. fire insurance / yr
- —
Heat risk No data
- Hot days now (above threshold)
- —
- Hot days in 30 yrs
- —
Wind risk No data
- Chance of severe wind over 30 yrs
- —
Air-quality risk No data
- Unhealthy air days now
- —
- Unhealthy air days in 30 yrs
- —
Risk factors via First Street. Map © Google.
Why this score? — see what drove the B grade
The composite is a weighted blend of 9 inputs, each scored 0–100. Each bar is that input's sub-score; the figure is the points it added to the 100-point composite (weight × sub-score).
- Cash flow +30.0/30.0
- 1% rule +10.0/10.0
- DSCR +10.0/10.0
- ARV discount +7.5/15.0
- Schools +4.1/10.0
- Livability +4.1/5.0
- Rent growth +3.4/5.0
- Condition / age +2.5/5.0
- Appreciation +0.0/10.0
$145,000
🖨 Deal sheet (PDF) 📄 Offer letter ✓ Due diligence
Listing remarks
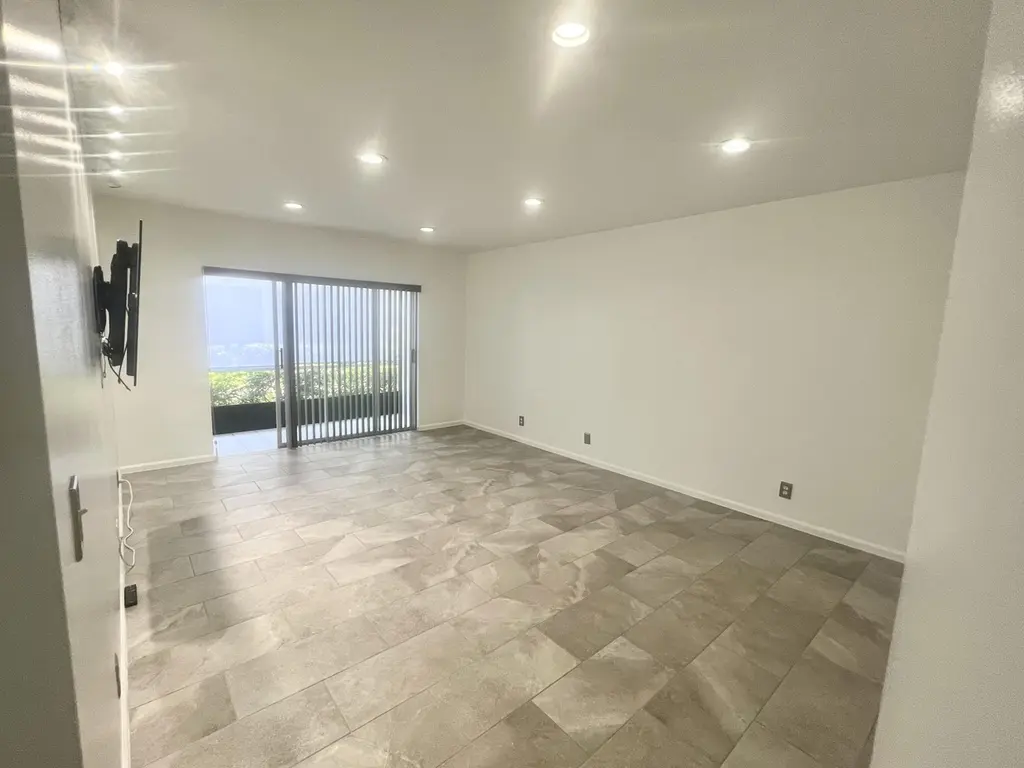
HOME IS WHERE THE HEART IS!!! This unit has been amazingly cared for by the owner. Freshly painted and professionally cleaned. Beautiful tile floors throughout the space. Washer/Dryer inside the unit for your convenience. Water, Cable TV and Internet are included in the quarterly maintenance. Great ceiling lighting throughout. Newer appliances, AC, Water Heater, Range Hood, W/ D. Additional storage space inside the building. Updated main bedroom bathroom. A spacious screened porch for those coffee mornings or evening drinks! Close and walking distance to: Publix, CVS, Chase Bank, Area Schools, Local Restaurants, Dottie Mancini Park, Imperial Point Hospital & More. One assigned parking
Key facts
- Tile floors
- Washer dryer
- Screened porch
Tags
Property features AI
Finance
- Other: Pets are not allowed
- HOA & community: Community amenities include heated pool, fitness center, game room, billiard room, sauna, shuffleboard court, cabana, picnic area, community room, bike storage, storage, manager on site, car wash area, laundry facilities, parking, recreation facilities, maintained community, internet included, security, and management; HOA fees collected quarterly; HOA covers cable TV, insurance, internet, grounds and structure maintenance, security, sewer, trash, water, common areas, legal/accounting, reserve funds, roof repairs, recreation facility and pool service
Exterior
- Parking: Assigned deeded parking (1 space); 1 open parking space
- Security: Security patrol
- Utilities: Public water; Public sewer; Cable available; Sewer connected; Water connected
- Home design: Condominium; One level; Faces north; 2-story building
- Construction: Concrete/CBS construction; Concrete roof; Appraiser-sourced living area
- Exterior features: Screened porch; Porch; Not waterfront
Interior
- Kitchen: Dishwasher; Electric range; Refrigerator; Disposal; Electric water heater
- Bedrooms: 1 bedroom on the main level
- Flooring: Ceramic tile
- Bathrooms: 1 full bathroom; 1 half bathroom
- Heating & cooling: Central electric heating; Central air conditioning; Ceiling fan(s)
- Interior features: Walk-in closet(s); Unfurnished
- Laundry & utility: In-unit laundry located inside
Neighborhood map
What this means for you Summary
Snapshot
- This is a 1-bed/2.0-bath condo listed at $145k.
Deal economics
- At list price, monthly cash flow is $609 ($7k/yr) — positive.
- The deal already cash-flows at list — no discount required.
- Meets the 1% rule at list price ($3k rent vs $145k).
- Cap rate 11.3% vs local median 2.2% in Fort Lauderdale — top-decile yield for the area; either an underpriced asset or a hidden risk that comps aren't pricing in. Stress-test before assuming the spread holds.
Location & tenants
- Location reads 82/100 on livability (#78 in FL, #1,293 nationally) — a professional / high-income tenant draw. Strengths: crime A+, amenities A+, health & safety A+; Watch: cost of living D-.
- Broward (suburban): math 42% / reading 53% proficiency, ranked #46 of 73 in FL (top 63%) — families likely to look elsewhere, expect single-tenant / working-renter base with shorter leases.
- Zoned schools: Mcnab Elementary School (math 51% / reading 63%, grade C+, #781 of 2,144 statewide, top 38%, 614 students, 56% FRL); Pompano Beach Middle School (math 29% / reading 40%, grade F, #421 of 571 statewide, top 74%, 1,040 students, 73% FRL); Northeast High School (math 12% / reading 37%, grade F, #505 of 667 statewide, top 79%, 1,552 students, 69% FRL).
- Market conditions: Rents rising (+3.6%/yr); 746 active listings in the ZIP; 40 comparable units currently listed for rent nearby; rentals at typical pace (median 24d on market — plan ~3-4 weeks tenant-placement turnaround); solid renter incomes; 2,111 units permitted in Broward County in 2024 (1,265 in 5+ unit buildings).
- This rent runs 36% of the median local income ($94k/yr) — at the standard rent-burdened threshold; future hikes will face affordability resistance.
Forward outlook
- Local home prices are declining (-3.0%/yr); year-one equity from $1k of loan paydown is wiped out by about $4k of value loss. Plan a longer hold.
- Broward County population projected at +34% by 2050 — long-run rental-demand tailwind backs the buy-and-hold thesis.
- At projected returns (-3.0% appreciation + 3.6% rent growth), your $41k cash investment doubles in ~7 years — after that, you're playing with house money.
Negotiation context
- Only 10 days on market — expect competitive offers; lowballing is unlikely to land.
- Current owner paid $76k; list at $145k implies a 92% gain — meaningful room to come down on a strong offer.
Questions for the listing agent
- Built in 1970 — when were the roof, HVAC, electrical panel, plumbing, and water heater last replaced?
- What does the HOA fee cover, when was the last increase, and are there any pending special assessments or reserve-fund shortfalls?
- Any open or pending special assessments — roof, HVAC, plumbing, elevator, façade? What's the per-unit balance and payoff schedule, and is the seller paying it off at close or rolling it to the buyer?
- Is there a deadline driving the sale (1031 exchange, divorce, estate, relocation)? That informs how much negotiation room exists.
- Schools are B-rated — typically a magnet for longer-tenancy family renters. What's the average tenant stay here, and is there a school-zone premium baked into asking?
- What's the average days-on-market for RENTAL listings here right now (not sales)? A rising rental-DOM trend means longer vacancies and softer asking-rent achievability than the comps imply.
- What's the recent tenant-quality profile in this submarket — average credit score on applications, eviction rate, late-payment / NSF rate, and stable-employment percentage? A property-management company in the area should have these aggregated.
- How much new apartment / multifamily construction is in the pipeline within 1–3 miles? Heavy new supply (>2% of stock underway) typically softens rents 12–24 months out; light construction supports rent growth.
Investment metrics
- 1% rule
- 1.94% ✓
- Cap rate
- 11.33%
- Cash-on-cash
- 18.01%
- DSCR
- 1.80
- GRM
- 4.3
CMA / ARV
No comps found within radius.
Projected returns pro-forma
-3.0% appreciation · 3.63% rent growth · sell at horizon
- IRR
- 10.8%
- Equity multiple
- 1.43×
- Total profit
- $17,515
- Equity at exit
- $21,620
- IRR
- 20.7%
- Equity multiple
- 2.83×
- Total profit
- $74,364
- Equity at exit
- $12,537
Cash invested: $40,600 (down + closing). Projections, not guarantees.
Landlord ↔ Tenant lean methodology
- Overall (STATE)
- 87 Strongly Landlord-Friendly
- State Florida
- 87 Strongly Landlord-Friendly · R+3
- County
- — inherits STATE
- City
- — inherits STATE
ZIP-level market 33308
- Rents YoY
- 3.6%
- Active inventory
- 746
- Price-to-rent
- 4.3×
Monthly cashflow live
- Estimated rent
- $2,812 high interval (Pro) →
- Mortgage (P&I)
- −$760
- Tax from tax record
- −$275 /mo · $3,303/yr
- Insurance
- −$60
- HOA
- −$516
- Vacancy / Maint / Mgmt
- −$590
- Net cashflow
- $609
Break-even live
Sensitivity live
| Price | -10% $691 | -5% $650 | +0% $609 | +5% $568 | +10% $527 |
|---|---|---|---|---|---|
| Rent | -10% $387 | -5% $498 | +0% $609 | +5% $720 | +10% $831 |
| Rate | -1.0pp $682 | -0.5pp $646 | base $609 | +0.5pp $572 | +1.0pp $533 |
UW: 25.0% down · 7.5% · 30yr · 1.5% tax · 5.0% vac · 8.0% maint · 8.0% mgmt
Financing live
Cash to close
- Down payment
- $36,250
- Closing costs
- $4,350
- Reserves months
- —
- Total cash needed
- —
Loan-product check · same deal, 3 products live
Conventional
25% down · 7.5% · 30yr
- Down + closing
- —
- Monthly P&I
- —
- Monthly cashflow
- —
- DSCR
- —
- Eligible?
- —
Personal DTI + credit; lowest rate.
DSCR
20% down · 8.5% · 30yr
- Down + closing
- —
- Monthly P&I
- —
- Monthly cashflow
- —
- DSCR
- —
- Eligible?
- —
No personal income docs; deal must DSCR.
Hard money
10% down · 12.0% · 12mo
- Down + closing
- —
- Monthly P&I
- —
- Monthly cashflow
- —
- DSCR
- —
- Eligible?
- —
Short-term bridge; refi at stabilization.
Rent comps 40 comps
| Address | Beds | Baths | Sqft | Rent | $/sqft | DOM | Units | Dist |
|---|---|---|---|---|---|---|---|---|
| 2400 NE 65th St Fort Lauderdale, FL | 1.0–3.0 | 1.0–2.0 | 1103 | $2,282 | $2.07 | 1d | 15 | 0.15mi |
| 1631 S Federal Hwy Pompano Beach, FL | 1.0–3.0 | 1.0–2.0 | 1092 | $2,268 | $2.08 | 1d | 16 | 0.27mi |
| 160 SE 12th St Pompano Beach, FL | 2.0 | 2.0 | 950 | $5,390 | $5.67 | 26d | 1 | 0.68mi |
| 3333 Port Royale Dr S Fort Lauderdale, FL | 3.0 | 1.0–2.0 | 857 | $2,775 | $3.24 | 0d | 43 | 0.78mi |
| 801 S Federal Hwy #21 Pompano Beach, FL | 2.0 | 2.0 | 1070 | $3,100 | $2.90 | 5d | 1 | 0.89mi |
| 777 S Federal Hwy Pompano Beach, FL | 2.0 | 2.0 | 1166 | $2,825 | $2.42 | 5d | 3 | 1.06mi |
| 777 S Federal Hwy Pompano Beach, FL | 1.0–2.0 | 1.0–2.0 | 947 | $1,700 | $1.79 | 26d | 6 | 1.06mi |
| 777 S Federal Hwy Pompano Beach, FL | 1.0–2.0 | 1.0–2.0 | 947 | $1,690 | $1.78 | 17d | 6 | 1.06mi |
| 1156 SW 4th Ave Pompano Beach, FL | 2.0 | 1.0 | 945 | $3,300 | $3.49 | 7d | 1 | 1.08mi |
| 1541 S Ocean Blvd Pompano Beach, FL | 1.0 | 1.5 | 850 | $3,575 | $4.21 | 26d | 2 | 1.11mi |
| 1501 S Ocean Blvd #307 Pompano Beach, FL | 2.0 | 2.0 | 1000 | $3,750 | $3.75 | 26d | 1 | 1.13mi |
| 1850 SE 7th St Unit B Pompano Beach, FL | 2.0 | 2.0 | 900 | $4,000 | $4.44 | 26d | 1 | 1.15mi |
| 1900 S Ocean Blvd Pompano Beach, FL | 2.0 | 2.0 | 1165 | $3,800 | $3.26 | 10d | 2 | 1.15mi |
| 1900 S Ocean Blvd Pompano Beach, FL | 2.0 | 2.0 | 1165 | $3,750 | $3.22 | 23d | 3 | 1.15mi |
| 2000 S Ocean Blvd Pompano Beach, FL | 1.0–2.0 | 1.5–2.0 | 1000 | $3,200 | $3.20 | 5d | 3 | 1.17mi |
| 2000 S Ocean Blvd Pompano Beach, FL | 1.0–2.0 | 1.5–2.0 | 1070 | $3,200 | $2.99 | 19d | 4 | 1.17mi |
| 2000 S Ocean Blvd Pompano Beach, FL | 1.0–2.0 | 1.5–2.0 | 1070 | $3,400 | $3.18 | 23d | 3 | 1.17mi |
| 1461 S Ocean Blvd Pompano Beach, FL | 2.0 | 2.0 | 920 | $3,525 | $3.83 | 7d | 2 | 1.17mi |
| 6000 N Ocean Blvd Unit 1D Lauderdale by the Sea, FL | 2.0 | 2.0 | 904 | $3,200 | $3.54 | 24d | 1 | 1.17mi |
| 1750 S Ocean Blvd Unit 509E Pompano Beach, FL | 2.0 | 2.0 | 945 | $4,200 | $4.44 | 26d | 1 | 1.18mi |
| 1620 S Ocean Blvd Unit 5M Pompano Beach, FL | 1.0 | 2.0 | 1116 | $5,000 | $4.48 | 26d | 1 | 1.19mi |
| 6000 N Ocean Blvd Lauderdale by the Sea, FL | 2.0 | 2.0 | 904 | $3,350 | $3.71 | 1d | 2 | 1.19mi |
| 1100 Pine Dr #102 Pompano Beach, FL | 2.0 | 2.0 | 950 | $2,100 | $2.21 | 26d | 1 | 1.22mi |
| 1500 S Ocean Blvd #508 Pompano Beach, FL | 2.0 | 2.0 | 1070 | $3,200 | $2.99 | 5d | 1 | 1.23mi |
| 5100 N Ocean Blvd #502 Lauderdale by the Sea, FL | 1.0 | 1.5 | 1080 | $3,400 | $3.15 | 26d | 1 | 1.23mi |
| 1421 S Ocean Blvd #503 Pompano Beach, FL | 2.0 | 2.0 | 1100 | $3,750 | $3.41 | 26d | 1 | 1.24mi |
| 1500 S Ocean Blvd Pompano Beach, FL | 2.0 | 1.5–2.0 | 985 | $4,000 | $4.06 | 17d | 2 | 1.26mi |
| 344 SE 11th Ave #8 Pompano Beach, FL | 1.0 | 1.0 | 600 | $1,500 | $2.50 | 26d | 1 | 1.27mi |
| 5000 N Ocean Blvd #506 Lauderdale by the Sea, FL | 1.0 | 1.5 | 1080 | $3,900 | $3.61 | 26d | 1 | 1.27mi |
| 912 Pine Dr #211 Pompano Beach, FL | 2.0 | 2.0 | 949 | $1,900 | $2.00 | 26d | 1 | 1.29mi |
| 4900 N Ocean Blvd #1209 Lauderdale by the Sea, FL | 1.0 | 2.0 | 960 | $4,100 | $4.27 | 17d | 1 | 1.30mi |
| 4900 N Ocean Blvd #1601 Lauderdale by the Sea, FL | 1.0 | 1.5 | 1000 | $4,000 | $4.00 | 26d | 1 | 1.30mi |
| 840 Pine Dr #103 Pompano Beach, FL | 2.0 | 2.0 | 904 | $2,800 | $3.10 | 26d | 1 | 1.32mi |
| 690 SE 23rd Ave #1 Pompano Beach, FL | 2.0 | 2.5 | 1055 | $2,995 | $2.84 | 17d | 1 | 1.33mi |
| 320 SE 10th Ave Unit D Pompano Beach, FL | 2.0 | 2.0 | 1000 | $2,300 | $2.30 | 26d | 1 | 1.33mi |
| 1891 SE 5th Ct Pompano Beach, FL | 2.0 | 2.0 | 1102 | $3,000 | $2.72 | 19d | 1 | 1.34mi |
| 490 SE 19th Ave #107 Pompano Beach, FL | 2.0 | 2.0 | 960 | $1,650 | $1.72 | 17d | 1 | 1.35mi |
| 431 SE 19th Ave Unit 2 Pompano Beach, FL | 1.0 | 1.0 | 700 | $1,600 | $2.29 | 26d | 1 | 1.37mi |
| 1971 SE 5th Ct Unit 303E Pompano Beach, FL | 2.0 | 2.0 | 960 | $2,400 | $2.50 | 24d | 1 | 1.37mi |
| 1971 SE 5th Ct Pompano Beach, FL | 2.0 | 2.0 | 960 | $2,050 | $2.14 | 26d | 2 | 1.38mi |
HOA detail condo
- Monthly dues
- $516 · $6,192/yr
- Likely covers
- waterinternetcableparking
- Assessments
- None detected in remarks — confirm with the listing agent.
Listing history 7 events
-
2026-06-21days on market $145,000 Active 10 DOM
-
2026-06-18days on market $145,000 Active 7 DOM
-
2026-06-17days on market $145,000 Active 6 DOM
-
2026-06-16days on market $145,000 Active 5 DOM
-
2026-06-15days on market $145,000 Active 4 DOM
-
2026-06-13remarks 695-char remark
-
2026-06-13$145,000 Active 2 DOM
ⓘ Source: listings_history table (triggers on properties + properties_extension) + one-shot
backfill from property_details.listing_events for pre-trigger history.
Tax reassessment forecast FL · Resets to sale price
- Current annual tax
- $3,303 · $275/mo
- Projected year-2 tax
- $3,303 · $275/mo
- Expected delta
- $0/yr ($0/mo · 0.0%)
ⓘ Screening estimate from a state-policy table — verify with the county assessor before closing.
Nearby sold comps map
Loading sold comps map…
Walkable amenities ~0.75 mi
Loading nearby amenities…
Taxation est. · year 1
- Rental income
- $33,741
- − Mortgage interest
- −$8,122
- − Property taxes
- −$3,303
- − Insurance
- −$725
- − Repairs & maintenance
- −$2,699
- − Management
- −$2,699
- − HOA
- −$6,192
- − Depreciation
- −$4,218
- Taxable income
- $5,782
- Est. tax owed @ 24.0%
- −$1,388
- After-tax cash flow
- $5,923/yr
For passive investors: Depreciation is non-cash, so a rental often shows a tax loss while cash-flowing — sheltering income. Rental losses are passive: they offset passive income freely, and up to $25,000/yr can offset ordinary (W-2) income if you actively participate and your MAGI is under $100k (phasing out to $0 by $150k); unused losses carry forward. On sale, claimed depreciation is recaptured at up to 25%, and gains may owe capital-gains tax (a 1031 exchange can defer both). Figures are a year-1 estimate at your 24.0% rate — not tax advice; consult a CPA.
Schools (NCES district)
- District
- Broward
- NCES district ID
- 1200180
- Math proficiency
- 42% ▼ -18.00%
- Reading proficiency
- 53% ▼ -5.00%
- Median HH income
- $52,139
- Composite
- 40.88/100
- National rank
- #3621
- State rank
- #46 of 73 in FL
Livability — Fort Lauderdale
- Score
- 82/100
- State rank
- #78
- US rank
- #1293
Category grades
Schools grade is shown separately in the Schools card above.
Census & demographics
- Census place
- Fort Lauderdale, FL
- County
- Broward County · 1,963,430 people
- City population
- 235,769
- Metro
- Miami-Fort Lauderdale-Pompano Beach, FL
- Population (ZIP)
- 27,935
- Household income
- $93,879
- Rent vs Own
- Severe rent burden
- 912.0
Population outlook (Broward County) Hauer SSP2
- Today (2025)
- 2,207,033 people
- By 2030
- 2,360,704 · +7.0%
- By 2040
- 2,661,208 · +20.6%
- By 2050
- 2,946,698 · +33.5%
- By 2075
- 3,602,273 · +63.2%
- By 2100
- 3,970,984 · +79.9%
Race, ethnicity, and origin ACS 2023
- Neighborhood character
- Predominantly White (75%)
- Race & ethnicity
- White 75% Hispanic / Latino 16% Two or more races 14% Asian 3% Black 2%
- Hispanic origin (detail)
- Puerto Rican 2% Cuban 3%
- Common ancestry
- Romanian 4% Lithuanian 3% Scotch-Irish 3%
- Foreign-born
- 24% · Canada, Jamaica, Dominican Republic
- Languages at home
- 75% English-only · Spanish 14% Other Indo-European 5% Russian/Polish/Slavic 2%
Political lean MEDSL · Broward
- 2024 margin
- D (+17.0) · D 58.0% · R 41.0%
- 2008→2024 swing
- -17.8pp toward R · 2008: 34.7pp · 2024: 17.0pp
- All cycles
- 2024: D+17.0 2020: D+29.8 2016: D+35.0 2012: D+34.9 2008: D+34.7
Not yet ingested
- Civics
- —
Market trends
- HPI YoY
- ▼ -417.95%
- Current HPI
- 325.3902
- Rent YoY
- ▲ 3.63%
- Metro
- Miami-Fort Lauderdale-Pompano Beach, FL
- State GDP YoY
- ▲ 3.28%
- F500 in state
- 36
Industry mix (Fortune 500 HQ in FL)
| Industry | F500 HQs | Revenue |
|---|---|---|
| Industrial Technology | 2 | $29B |
|
||
| Insurance | 2 | $17B |
|
||
| Retail | 1 | $60B |
|
||
| Technology Distribution | 1 | $58B |
|
||
| Homebuilding | 1 | $35B |
|
||
| Technology Manufacturing | 1 | $35B |
|
||
Price history
+211.8% since first listed3 events — show timeline
- 2026-06-11 Listed $145,000 Beaches MLS
- 2003-03-06 Sold (Public Records) $75,500 Public Records
- 1997-06-13 Sold (Public Records) $46,500 Public Records
Property tax history
+7.6%/yrLatest (2025): $3,303 · +5.4% YoY. Source: county tax records.
Cash-flow waterfall
monthlySold comps — $/sqft
last 12 mo · ≤1 miLoading sold comps…