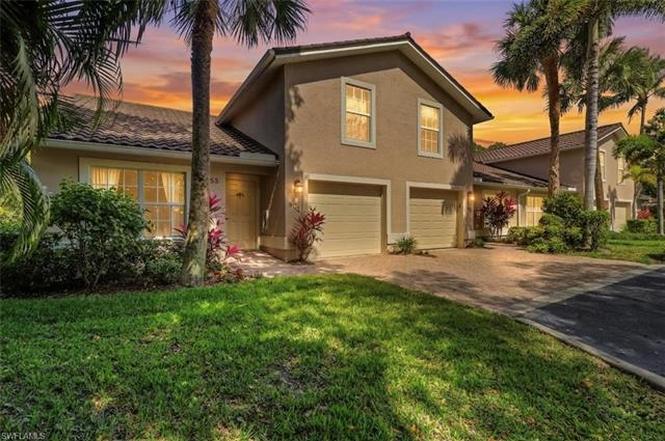
3555 Avion Woods Ct #501 · Naples, FL
Flood risk 9/10 · Severe
- FEMA flood zone
- AE
- Chance of flooding over 30 yrs
- 0.99%
- Est. flood insurance / yr
- $1,737 – $8,500
Fire risk 4/10 · Minor
- Est. fire insurance / yr
- $947 – $1,759
Heat risk 10/10 · Severe
- Hot days now (above 107°F)
- 6 days/yr
- Hot days in 30 yrs
- 24 days/yr
Wind risk 10/10 · Severe
- Chance of severe wind over 30 yrs
- 99.0%
Air-quality risk 3/10 · Minor
- Unhealthy air days now
- 3 days/yr
- Unhealthy air days in 30 yrs
- 3 days/yr
Risk factors via First Street. Map © Google.
Why this score? — see what drove the D+ grade
The composite is a weighted blend of 9 inputs, each scored 0–100. Each bar is that input's sub-score; the figure is the points it added to the 100-point composite (weight × sub-score).
- Cash flow +16.7/30.0
- ARV discount +7.5/15.0
- 1% rule +5.7/10.0
- DSCR +5.2/10.0
- Schools +5.0/10.0
- Livability +4.0/5.0
- Condition / age +2.5/5.0
- Rent growth +2.2/5.0
- Appreciation +0.0/10.0
$347,900
🖨 Deal sheet 📄 Offer letter ✓ Due diligence
Listing remarks
Tucked within the greenery of Avion Woods, 3555 Avion Woods Court #501 offers a rare sense of privacy, calm, and ease in the heart of Naples. This end-unit residence lives more like a private villa than a townhome, with 2 bedrooms, 2.5 baths, and 1,407 square feet of beautifully refreshed living space. Vaulted ceilings, expansive windows, and serene preserve views fill the home with natural light and create an inviting connection to the outdoors. The interior has been updated with large-format tile flooring, fresh paint, and thoughtful improvements throughout, giving the home a clean, modern feel. A new 2024 hot water heater adds an important layer of comfort and confidence. The main-level
Key facts
- End-unit residence
- New hot water heater
- $667 HOA
Tags
Property features AI
Finance
- Financial info: Total annual recurring HOA fees noted as $8,000; Total one-time fees noted as $150
- HOA & community: Quarterly condo fee (listed as $2,000); Professional management; Community pool; Extra storage; Internet access; Sidewalks and streetlights; Maintenance covers insurance, irrigation water, lawn/land maintenance, manager, exterior pest control, reserves, sewer and water; Non-gated community
Exterior
- Parking: Attached 1-car garage
- Security: Security system; Impact resistant doors and windows
- Utilities: Central water; Central sewer; Cable available
- Home design: Townhouse, end-unit; 2 stories; Rear exposure to the northwest; Part of AVION WOODS development
- Construction: Concrete block construction; Stucco exterior finish; Metal roof; Built in 2005
- Exterior features: Patio; Storage; Zero lot line; Preserve and wooded area view; Central irrigation
Interior
- Kitchen: Dishwasher; Disposal; Microwave; Range; Refrigerator/ice maker; Self-cleaning oven; Breakfast bar; Formal dining area
- Bedrooms: 2 bedrooms (2-story floor plan)
- Flooring: Carpet; Tile
- Bathrooms: 2 full bathrooms; 1 half bathroom; Master bath with dual sinks and shower
- Heating & cooling: Central electric heat; Central electric air conditioning; Ceiling fans
- Interior features: Cable prewire; High-speed internet available; Foyer; Pantry; Smoke detectors; Vaulted/volume ceilings; Walk-in closet; Screened lanai/porch; Laundry in residence; Unfurnished
- Laundry & utility: Washer; Dryer
Neighborhood map
What this means for you Summary
Snapshot
- This is a 2-bed/2.5-bath condo listed at $348k.
Deal economics
- At list price, monthly cash flow is $-212 ($-3k/yr) — negative.
- To cash-flow at today's rent, offer at most $310k (10.8% below list).
- Meets the 1% rule at list price ($4k rent vs $348k).
- Recommended offer: $310k (10.8% below list) — sets the bar for cash-flow.
Location & tenants
- Location reads 80/100 on livability (#126 in FL, #1,903 nationally) — a professional / high-income tenant draw. Strengths: crime A+, amenities A+, employment A+; Watch: commute D+, cost of living F.
- Collier (suburban): math 60% / reading 56% proficiency, ranked #16 of 73 in FL (top 22%) — acceptable for families but not a draw, mixed tenant base, ~2y average lease.
- Market conditions: Rents soft (-1.1%/yr); 436 active listings in the ZIP; 40 comparable units currently listed for rent nearby; rentals at typical pace (median 14d on market — plan ~3-4 weeks tenant-placement turnaround); 3,520 units permitted in Collier County in 2024 (959 in 5+ unit buildings).
- At $3,715/mo this rent would consume 62% of the median local household income ($72k/yr) (locally 1423% of renters already pay >50% of income on rent) — very limited rent-growth headroom before tenants either downsize or default.
Forward outlook
- Local home prices are declining (-3.0%/yr); year-one equity from $2k of loan paydown is wiped out by about $10k of value loss. Plan a longer hold.
- Collier County population projected at +30% by 2050 — long-run rental-demand tailwind backs the buy-and-hold thesis.
Negotiation context
- It's been on market 97 days — a 9% lower offer ($317k) is reasonable based on typical stale-listing flexibility.
- 7 sale attempts since 22y ago; this cycle's ask has dropped $27k (7%) from the opening price — seller is motivated, your offer sets the floor, not the list.
Risks & watch-outs
- Watch-outs: flood insurance adds $427/mo.
- Climate carrying-cost: in FEMA flood zone AE (mandatory federal flood insurance); severe wind risk, 99% chance of damaging wind over 30y; extreme-heat days projected 6→24/yr by 2055 (HVAC capex compounding) — expect insurance premiums to compound above CPI over the hold.
Questions for the listing agent
- What do current leases actually rent for vs. the listed asking? Can we see a recent rent roll and the last 12 months of T-12 income?
- It's been on market 97 days. Have you received any prior offers? Is the seller open to a 11% concession, seller financing, or rate buy-down credit?
- What's the actual annual flood-insurance premium (NFIP or private), and is the property in a SFHA with mandatory coverage?
- What does the HOA fee cover, when was the last increase, and are there any pending special assessments or reserve-fund shortfalls?
- Any open or pending special assessments — roof, HVAC, plumbing, elevator, façade? What's the per-unit balance and payoff schedule, and is the seller paying it off at close or rolling it to the buyer?
- Why hasn't it sold? Are there any deal-killer items the seller is aware of (foundation, flood, title, zoning, code violations)?
- Is there a deadline driving the sale (1031 exchange, divorce, estate, relocation)? That informs how much negotiation room exists.
- Schools are B-rated — typically a magnet for longer-tenancy family renters. What's the average tenant stay here, and is there a school-zone premium baked into asking?
- The area grade is low — what's the realistic commute time and amenity access for the typical tenant pool here? Any planned neighborhood developments (good or bad) we should know about?
- What's the average days-on-market for RENTAL listings here right now (not sales)? A rising rental-DOM trend means longer vacancies and softer asking-rent achievability than the comps imply.
- What's the recent tenant-quality profile in this submarket — average credit score on applications, eviction rate, late-payment / NSF rate, and stable-employment percentage? A property-management company in the area should have these aggregated.
- How much new apartment / multifamily construction is in the pipeline within 1–3 miles? Heavy new supply (>2% of stock underway) typically softens rents 12–24 months out; light construction supports rent growth.
Investment metrics
- 1% rule
- 1.07% ✓
- Cap rate
- 7.03%
- Cash-on-cash
- 2.64%
- DSCR
- 1.12
- GRM
- 7.8
CMA / ARV
No comps found within radius.
Projected returns pro-forma
-3.0% appreciation · 0.0% rent growth · sell at horizon
- IRR
- -25.1%
- Equity multiple
- 0.18×
- Total profit
- $-80,259
- Equity at exit
- $51,873
- IRR
- -41.0%
- Equity multiple
- -0.31×
- Total profit
- $-127,274
- Equity at exit
- $30,080
Cash invested: $97,412 (down + closing). Projections, not guarantees.
Landlord ↔ Tenant lean methodology
- Overall (STATE)
- 87 Strongly Landlord-Friendly
- State Florida
- 87 Strongly Landlord-Friendly · R+3
- County
- — inherits STATE
- City
- — inherits STATE
ZIP-level market 34104
- Rents YoY
- -1.1%
- Active inventory
- 436
- Price-to-rent
- 7.8×
Monthly cashflow live
- Estimated rent
- $3,715 high interval (Pro) →
- Mortgage (P&I)
- −$1,824
- Tax from tax record
- −$84 /mo · $1,005/yr
- Insurance
- −$145
- Flood insurance flood zone
- −$427 /mo · $5,118/yr
- HOA
- −$667
- Vacancy / Maint / Mgmt
- −$780
- Net cashflow
- $-212
Break-even live
UW: 25.0% down · 7.5% · 30yr · 1.5% tax · 5.0% vac · 8.0% maint · 8.0% mgmt
Financing live
Cash to close
- Down payment
- $86,975
- Closing costs
- $10,437
- Reserves months
- —
- Total cash needed
- —
Loan-product check · same deal, 3 products live
Conventional
25% down · 7.5% · 30yr
- Down + closing
- —
- Monthly P&I
- —
- Monthly cashflow
- —
- DSCR
- —
- Eligible?
- —
Personal DTI + credit; lowest rate.
DSCR
20% down · 8.5% · 30yr
- Down + closing
- —
- Monthly P&I
- —
- Monthly cashflow
- —
- DSCR
- —
- Eligible?
- —
No personal income docs; deal must DSCR.
Hard money
10% down · 12.0% · 12mo
- Down + closing
- —
- Monthly P&I
- —
- Monthly cashflow
- —
- DSCR
- —
- Eligible?
- —
Short-term bridge; refi at stabilization.
Rent comps 40 comps
| Address | Beds | Baths | Sqft | Rent | $/sqft | DOM | Units | Dist |
|---|---|---|---|---|---|---|---|---|
| 1111 Central Dr Unit 417A Naples, FL | 2.0 | 2.0 | 1265 | $6,500 | $5.14 | 23d | 1 | 0.21mi |
| 3400 Frosty Way #5 Naples, FL | 2.0 | 2.0 | 1284 | $3,500 | $2.73 | 14d | 1 | 0.56mi |
| 3563 Antarctic Cir #2102 Naples, FL | 2.0 | 2.0 | 1200 | $3,800 | $3.17 | 23d | 1 | 0.59mi |
| 3510 Antarctic Cir Unit 1 Naples, FL | 2.0 | 2.0 | 1200 | $2,350 | $1.96 | 23d | 1 | 0.63mi |
| 3504 Antarctic Cir Naples, FL | 2.0 | 2.0 | 1246 | $3,000 | $2.41 | 23d | 1 | 0.63mi |
| 3618 Arctic Cir #3618 Naples, FL | 2.0 | 2.0 | 1200 | $3,450 | $2.88 | 23d | 1 | 0.65mi |
| 3676 Arctic Cir #112 Naples, FL | 2.0 | 2.0 | 1246 | $2,700 | $2.17 | 21d | 1 | 0.67mi |
| 4069 Northlight Dr #1805 Naples, FL | 2.0 | 2.0 | 1234 | $3,000 | $2.43 | 21d | 1 | 0.67mi |
| 3608 Arctic Cir #514 Naples, FL | 2.0 | 2.0 | 1250 | $4,200 | $3.36 | 23d | 1 | 0.70mi |
| 4502 Parrot Ave Naples, FL | 3.0 | 2.0 | 1200 | $2,950 | $2.46 | 23d | 1 | 0.70mi |
| 83 Glades Blvd #3 Naples, FL | 2.0 | 2.0 | 1204 | $5,200 | $4.32 | 14d | 1 | 0.72mi |
| 1320 Embassy Ln Naples, FL | 3.0 | 2.0 | 1251 | $3,300 | $2.64 | 14d | 1 | 0.76mi |
| 4021 Ice Castle Way #4 Naples, FL | 2.0 | 2.0 | 1246 | $2,600 | $2.09 | 14d | 1 | 0.76mi |
| 4010 Ice Castle Way #7 Naples, FL | 2.0 | 2.0 | 1314 | $3,200 | $2.44 | 23d | 1 | 0.76mi |
| 4060 Ice Castle Way #10 Naples, FL | 2.0 | 2.0 | 1246 | $3,600 | $2.89 | 14d | 1 | 0.81mi |
| 96 Glades Blvd Unit 513 Naples, FL | 2.0 | 2.0 | 1370 | $4,500 | $3.28 | 14d | 1 | 0.81mi |
| 882 Bluebird St Naples, FL | 3.0 | 2.0 | 1308 | $6,000 | $4.59 | 23d | 1 | 0.82mi |
| 4040 Ice Castle Way Unit 2 Naples, FL | 2.0 | 2.0 | 1246 | $2,800 | $2.25 | 23d | 1 | 0.82mi |
| 364 Tern Dr #4 Naples, FL | 2.0 | 2.0 | 1264 | $1,800 | $1.42 | 14d | 1 | 0.88mi |
| 319 Reynolds Ct Unit M12 Naples, FL | 2.0 | 2.0 | 1596 | $2,400 | $1.50 | 21d | 1 | 0.89mi |
| 3140 Caledonia Ave Naples, FL | 3.0 | 2.0 | 1637 | $2,695 | $1.65 | 14d | 1 | 0.90mi |
| 348 Tern Dr Unit 4 Naples, FL | 2.0 | 2.0 | 1270 | $5,000 | $3.94 | 23d | 1 | 0.92mi |
| 348 Tern Dr #2 Naples, FL | 2.0 | 2.0 | 1270 | $1,800 | $1.42 | 14d | 1 | 0.92mi |
| 2155 Great Blue Dr Naples, FL | 1.0–3.0 | 1.0–2.0 | 895 | $1,910 | $2.13 | 14d | 43 | 0.92mi |
| 4180 Looking Glass Ln Unit 4104 Naples, FL | 2.0 | 2.0 | 1246 | $4,000 | $3.21 | 14d | 1 | 0.95mi |
| 2047 Harbor Ln Naples, FL | 3.0 | 2.0 | 1382 | $7,500 | $5.43 | 21d | 1 | 0.96mi |
| 4210 Looking Glass Ln Unit 4210 Naples, FL | 2.0 | 2.0 | 1300 | $3,000 | $2.31 | 14d | 1 | 0.96mi |
| 1075 Foxfire Ln Naples, FL | 2.0 | 2.0 | 1092 | $3,300 | $3.02 | 23d | 3 | 0.97mi |
| 105 Penny Ln #5 Naples, FL | 2.0 | 2.0 | 1564 | $2,500 | $1.60 | 14d | 1 | 0.99mi |
| 193 Fox Glen Dr Naples, FL | 3.0 | 2.0 | 1345 | $6,500 | $4.83 | 23d | 1 | 1.03mi |
| 306 Palm Dr #2 Naples, FL | 2.0 | 2.0 | 1270 | $5,200 | $4.09 | 23d | 1 | 1.04mi |
| 124 Penny Ln Unit 778 Naples, FL | 2.0 | 2.0 | 1532 | $5,000 | $3.26 | 14d | 1 | 1.08mi |
| 1950 Mayfair St Naples, FL | 3.0 | 1.0–3.5 | 1514 | $8,752 | $5.78 | 14d | 109 | 1.09mi |
| 265 Palm Dr Unit 265-2 Naples, FL | 2.0 | 2.0 | 1215 | $1,499 | $1.23 | 14d | 1 | 1.10mi |
| 256 Palm Dr #6 Naples, FL | 2.0 | 2.0 | 1010 | $4,500 | $4.46 | 14d | 1 | 1.13mi |
| 1950 Mayfair ST Unit 901 Naples, FL | 2.0 | 2.0 | 1025 | $4,560 | $4.45 | 14d | 1 | 1.14mi |
| 1950 Mayfair ST Unit 1027 Naples, FL | 1.0 | 1.0 | 888 | $3,525 | $3.97 | 14d | 1 | 1.14mi |
| 1950 Mayfair ST Unit 923 Naples, FL | 2.0 | 2.0 | 1142 | $4,490 | $3.93 | 14d | 1 | 1.14mi |
| 1950 Mayfair ST Unit 818 Naples, FL | 2.0 | 2.0 | 1142 | $4,415 | $3.87 | 14d | 1 | 1.14mi |
| 159 Quails Nest Rd Unit 1084 Naples, FL | 2.0 | 2.0 | 1677 | $2,100 | $1.25 | 14d | 1 | 1.15mi |
HOA detail condo
- Monthly dues
- $667 · $8,004/yr
- Likely covers
- water
- Assessments
- None detected in remarks — confirm with the listing agent.
Listing history 35 events
-
2026-06-18days on market $347,900 Active 97 DOM
-
2026-06-17days on market $347,900 Active 96 DOM
-
2026-06-16days on market $347,900 Active 95 DOM
-
2026-06-15days on market $347,900 Active 94 DOM
-
2026-06-14days on market $347,900 Active 92 DOM
-
2026-06-10days on market $347,900 Active 89 DOM
-
2026-06-09days on market $347,900 Active 88 DOM
-
2026-06-08days on market $347,900 Active 87 DOM
-
2026-06-07days on market $347,900 Active 86 DOM
-
2026-06-03days on market $347,900 Active 82 DOM
-
2026-06-02days on market $347,900 Active 81 DOM
-
2026-06-01days on market $347,900 Active 80 DOM
-
2026-05-31days on market $347,900 Active 79 DOM
-
2026-05-30days on market $347,900 Active 78 DOM
-
2026-04-05price $347,900
-
2026-03-28price $359,000
-
2026-03-13$374,900 Active
-
2026-03-06historical
-
2026-01-16price $377,000
-
2026-01-16price $377,000
-
2025-10-10$395,000 Active
-
2025-10-10$395,000 Active
-
2025-10-09historical
-
2025-06-05price $395,000
-
2025-06-05price $395,000
-
2025-04-29price $402,000
-
2025-04-28price $403,000
-
2025-04-28price $402,000
-
2024-10-19$425,000 Active
-
2024-10-18$425,000 Active
-
2005-06-08soldstatus $315,000
-
2005-02-10soldstatus $281,640
-
2005-01-25soldstatus $281,640
-
2004-11-11$240,200
-
2004-11-04$240,200
ⓘ Source: listings_history table (triggers on properties + properties_extension) + one-shot
backfill from property_details.listing_events for pre-trigger history.
Tax reassessment forecast FL · Resets to sale price
- Current annual tax
- $1,005 · $84/mo
- Projected year-2 tax
- $2,888 · $241/mo
- Expected delta
- +$1,882/yr (+$157/mo · 187.3%)
ⓘ Screening estimate from a state-policy table — verify with the county assessor before closing.
Climate risk First Street
- Flood 9/10 Extreme FEMA zone AE · 99% chance over 30 yrs
- Wildfire 4/10 Moderate
- Heat 10/10 Extreme 6 d/yr ≥107°F today · 24 d/yr by 30 yrs out
- Wind 10/10 Extreme 99% chance of damaging wind over 30 yrs
- Air quality 3/10 Moderate 3 unhealthy d/yr today · 3 by 30 yrs out
Nearby sold comps map
Loading sold comps map…
Walkable amenities ~0.75 mi
Loading nearby amenities…
Taxation est. · year 1
- Rental income
- $44,576
- − Mortgage interest
- −$19,488
- − Property taxes
- −$1,005
- − Insurance
- −$6,858
- − Repairs & maintenance
- −$3,566
- − Management
- −$3,566
- − HOA
- −$8,004
- − Depreciation
- −$10,121
- Taxable loss
- −$8,032
- Est. tax savings @ 24.0%
- +$1,928
- After-tax cash flow
- $-618/yr
For passive investors: Depreciation is non-cash, so a rental often shows a tax loss while cash-flowing — sheltering income. Rental losses are passive: they offset passive income freely, and up to $25,000/yr can offset ordinary (W-2) income if you actively participate and your MAGI is under $100k (phasing out to $0 by $150k); unused losses carry forward. On sale, claimed depreciation is recaptured at up to 25%, and gains may owe capital-gains tax (a 1031 exchange can defer both). Figures are a year-1 estimate at your 24.0% rate — not tax advice; consult a CPA.
Schools (NCES district)
- District
- Collier
- NCES district ID
- 1200330
- Math proficiency
- 60% ▼ -4.00%
- Reading proficiency
- 56% ▼ -2.00%
- Median HH income
- $58,275
- Composite
- 50.23/100
- National rank
- #1892
- State rank
- #16 of 73 in FL
Livability — Naples
- Score
- 80/100
- State rank
- #126
- US rank
- #1903
Category grades
Schools grade is shown separately in the Schools card above.
Census & demographics
- County
- Collier County · 396,295 people
- City population
- 344,941
- Metro
- Naples-Marco Island, FL
- Population (ZIP)
- 26,408
- Household income
- $71,686
- Rent vs Own
- Severe rent burden
- 1423.0
Population outlook (Collier County) Hauer SSP2
- Today (2025)
- 420,858 people
- By 2030
- 450,054 · +6.9%
- By 2040
- 502,232 · +19.3%
- By 2050
- 544,932 · +29.5%
- By 2075
- 627,203 · +49.0%
- By 2100
- 659,015 · +56.6%
Race, ethnicity, and origin ACS 2023
- Neighborhood character
- Majority White (62%)
- Race & ethnicity
- White 62% Hispanic / Latino 30% Two or more races 19% Black 4% Asian 2%
- Hispanic origin (detail)
- Mexican 7% Puerto Rican 3% Cuban 6% Dominican 1%
- Common ancestry
- Lithuanian 6% Romanian 3% Hispanic 2%
- Foreign-born
- 30% · Canada, Jamaica, Dominican Republic
- Languages at home
- 66% English-only · Spanish 24% French/Haitian/Cajun 5% Russian/Polish/Slavic 1%
Political lean MEDSL · Collier
- 2024 margin
- Solid R (+33.1) · D 33.1% · R 66.2%
- 2008→2024 swing
- -10.6pp toward R · 2008: -22.5pp · 2024: -33.1pp
- All cycles
- 2024: R+33.1 2020: R+24.7 2016: R+26.0 2012: R+30.1 2008: R+22.5
Not yet ingested
- Civics
- —
Market trends
- HPI YoY
- ▼ -252.48%
- Current HPI
- 259.3498
- Rent YoY
- ▼ -1.10%
- Metro
- Naples-Marco Island, FL
- State GDP YoY
- ▲ 3.28%
- F500 in state
- 36
Industry mix (Fortune 500 HQ in FL)
| Industry | F500 HQs | Revenue |
|---|---|---|
| Industrial Technology | 2 | $29B |
|
||
| Insurance | 2 | $17B |
|
||
| Retail | 1 | $60B |
|
||
| Technology Distribution | 1 | $58B |
|
||
| Homebuilding | 1 | $35B |
|
||
| Technology Manufacturing | 1 | $35B |
|
||
Price history
+44.8% since first listed21 events — show timeline
- 2026-04-05 Price Changed $347,900 NAPLESMLS
- 2026-03-28 Price Changed $359,000 NAPLESMLS
- 2026-03-13 Listed $374,900 NAPLESMLS
- 2026-03-06 Listing Removed — NAPLESMLS
- 2026-01-16 Price Changed $377,000 NAPLESMLS
- 2026-01-16 Price Changed $377,000 MIML
- 2025-10-10 Listed $395,000 NAPLESMLS
- 2025-10-10 Listed $395,000 MIML
- 2025-10-09 Listing Removed — NAPLESMLS
- 2025-06-05 Price Changed $395,000 NAPLESMLS
- 2025-06-05 Price Changed $395,000 MIML
- 2025-04-29 Price Changed $402,000 NAPLESMLS
- 2025-04-28 Price Changed $403,000 NAPLESMLS
- 2025-04-28 Price Changed $402,000 MIML
- 2024-10-19 Listed $425,000 MIML
- 2024-10-18 Listed $425,000 NAPLESMLS
- 2005-06-08 Sold (Public Records) $315,000 Public Records
- 2005-02-10 Sold (MLS) $281,640 MIML
- 2005-01-25 Sold (Public Records) $281,640 Public Records
- 2004-11-11 Listed $240,200 MIML
- 2004-11-04 Listed $240,200 MIML
Property tax history
+2.7%/yrLatest (2025): $1,005 · +6.2% YoY. Source: county tax records.
Cash-flow waterfall
monthlySold comps — $/sqft
last 12 mo · ≤1 miLoading sold comps…