615 7th Ave · Belle Plaine, IA
Flood risk 1/10 · Minimal
- FEMA flood zone
- X (unshaded)
- Chance of flooding over 30 yrs
- 0.0%
- Est. flood insurance / yr
- $473 – $860
Fire risk 4/10 · Minor
- Est. fire insurance / yr
- $902 – $1,676
Heat risk 3/10 · Minor
- Hot days now (above 103°F)
- 7 days/yr
- Hot days in 30 yrs
- 15 days/yr
Wind risk 2/10 · Minimal
- Chance of severe wind over 30 yrs
- —
Air-quality risk 1/10 · Minimal
- Unhealthy air days now
- 0 days/yr
- Unhealthy air days in 30 yrs
- 0 days/yr
Risk factors via First Street. Map © Google.
Why this score? — see what drove the D grade
The composite is a weighted blend of 9 inputs, each scored 0–100. Each bar is that input's sub-score; the figure is the points it added to the 100-point composite (weight × sub-score).
- Appreciation +10.0/10.0
- Cash flow +7.5/30.0
- ARV discount +7.5/15.0
- Schools +5.9/10.0
- Livability +3.8/5.0
- Rent growth +2.5/5.0
- Condition / age +2.5/5.0
- DSCR +1.6/10.0
- 1% rule +0.8/10.0
$219,000
🖨 Deal sheet 📄 Offer letter ✓ Due diligence
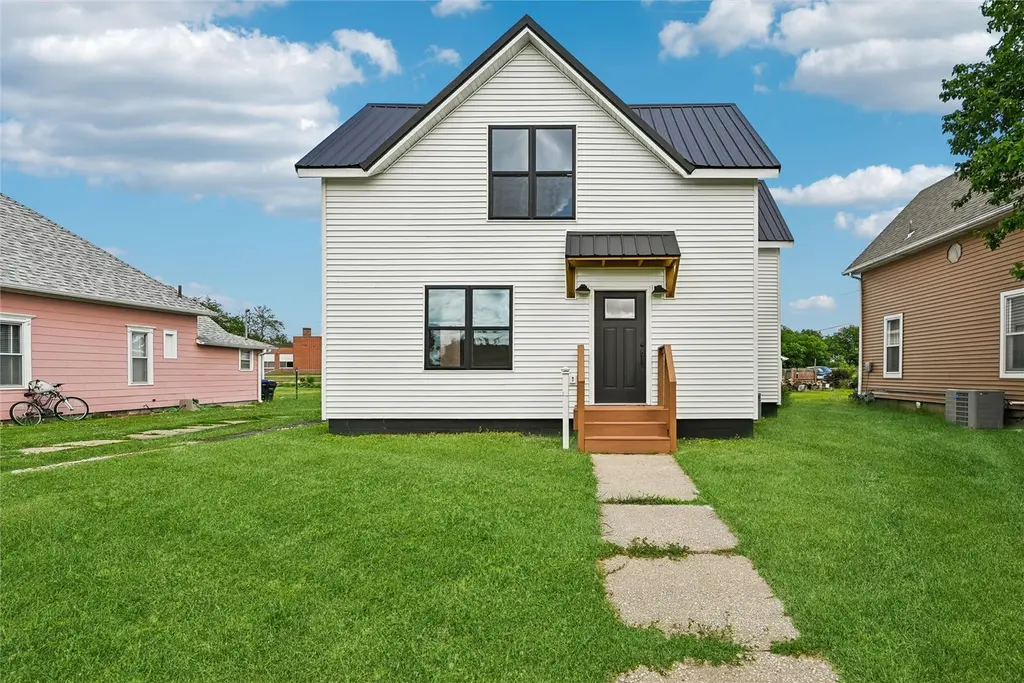
Key facts
- All new windows
- All new doors
- All new siding
Tags
Property features AI
Exterior
- Parking: Detached 2-car garage with garage door opener
- Utilities: Public water; Public sewer
- Home design: Single-family residence; One and one-half to two stories
- Construction: Frame construction with vinyl siding; Block foundation; Home warranty included
- Exterior features: Deck; Patio
Interior
- Kitchen: Electric water heater
- Bathrooms: 2 full bathrooms
- Heating & cooling: Natural gas forced-air heating; Central air conditioning
- Interior features: Eat-in kitchen; Partial basement
- Laundry & utility: Main-level laundry
Neighborhood map
What this means for you Summary
Snapshot
- This is a 4-bed/2.0-bath single-family listed at $219k.
Deal economics
- At list price, monthly cash flow is $-271 ($-3k/yr) — negative.
- To cash-flow at today's rent, offer at most $171k (21.8% below list).
- To meet the 1% rule (rent ≥ 1% of price), the offer needs to be $128k (41.7% below list).
- Recommended offer: $128k (41.7% below list) — sets the bar for 1% rule.
Location & tenants
- Location reads 75/100 on livability (#215 in IA, #3,962 nationally) — a middle-class / working-renter tenant base. Strengths: cost of living A+, housing A+, health & safety A+; Watch: crime C-, amenities F, commute F.
- Belle Plaine Community School District (rural): math 68% / reading 74% proficiency, ranked #144 of 289 in IA (top 50%) — strong family-tenant draw, lease renewals of 3-5y typical.
- Zoned schools: Longfellow Elementary School (math 72% / reading 72%, grade A-, #181 of 616 statewide, top 34%, 286 students, 44% FRL); Belle Plaine Jr/Sr High School (math 62% / reading 77%, grade B, #152 of 336 statewide, top 52%, 193 students, 35% FRL).
- Market conditions: 31 active listings in the ZIP; 34 units permitted in Benton County in 2024 (0 in 5+ unit buildings).
Forward outlook
- In year one you build about $23k of equity ($2k loan paydown + $22k appreciation (10.0% local appreciation)).
- Benton County population projected at -13% by 2050 — secular population decline; favor cash flow + early exit over multi-decade hold.
- By year 2, paydown + projected appreciation supports a ~$38k cash-out refi (75% LTV) — recoverable capital for the next deal without selling this one.
Negotiation context
- Only 1 days on market — expect competitive offers; lowballing is unlikely to land.
- Current owner paid $20k; list at $219k implies a 995% gain — meaningful room to come down on a strong offer.
Risks & watch-outs
- Watch-outs: built in 1900 — expect roof / HVAC / electrical / plumbing capex.
Questions for the listing agent
- What do current leases actually rent for vs. the listed asking? Can we see a recent rent roll and the last 12 months of T-12 income?
- Built in 1900 — when were the roof, HVAC, electrical panel, plumbing, and water heater last replaced?
- Is there a deadline driving the sale (1031 exchange, divorce, estate, relocation)? That informs how much negotiation room exists.
- Schools are B-rated — typically a magnet for longer-tenancy family renters. What's the average tenant stay here, and is there a school-zone premium baked into asking?
- The area grade is low — what's the realistic commute time and amenity access for the typical tenant pool here? Any planned neighborhood developments (good or bad) we should know about?
- What's the average days-on-market for RENTAL listings here right now (not sales)? A rising rental-DOM trend means longer vacancies and softer asking-rent achievability than the comps imply.
- What's the recent tenant-quality profile in this submarket — average credit score on applications, eviction rate, late-payment / NSF rate, and stable-employment percentage? A property-management company in the area should have these aggregated.
- How much new for-sale + rental construction is in the pipeline within 1–3 miles? Heavy new supply typically softens prices + rents 12–24 months out; constrained supply supports both.
Investment metrics
- 1% rule
- 0.58% ✗
- Cap rate
- 4.81%
- Cash-on-cash
- -5.30%
- DSCR
- 0.76
- GRM
- 14.3
CMA / ARV
- ARV (on-the-fly)
- $105,560
- Comps found
- 8
Show comp detail 8 sales within ~0.75 mi
| Address | Dist | Beds/Ba | Sqft | Sold | Price | $/sf | Match |
|---|---|---|---|---|---|---|---|
| 405 10th St | 0.35mi | 3/1.5 (-1) | 1,802 (+11%) | 6mo | $150,000 | $83 | 54 |
| 412 13th St | 0.52mi | 3/1.5 (-1) | 1,616 (-0%) | 18mo | $102,000 | $63 | 53 |
| 704 15th St | 0.62mi | 5/1.0 (+1) | 1,550 (-5%) | 4mo | $53,000 | $34 | 51 |
| 1502 9th Ave | 0.63mi | 3/1.5 (-1) | 1,526 (-6%) | 9mo | $127,500 | $84 | 46 |
| 911 4th Ave | 0.36mi | 3/2.0 (-1) | 1,772 (+9%) | 20mo | $225,000 | $127 | 46 |
| 1509 6th Ave | 0.67mi | 3/1.0 (-1) | 1,544 (-5%) | 7mo | $62,000 | $40 | 46 |
| 910 14th St | 0.59mi | 4/2.0 | 1,836 (+13%) | 6mo | $109,000 | $59 | 45 |
| 1104 15th St | 0.72mi | 4/2.0 | 1,458 (-10%) | 5mo | $95,000 | $65 | 45 |
Match score weights: distance 35% · size 25% · config 20% · recency 20%. Top-matched comps best support the ARV.
Projected returns pro-forma
10.0% appreciation · 3.0% rent growth · sell at horizon
- IRR
- 20.5%
- Equity multiple
- 2.66×
- Total profit
- $101,902
- Equity at exit
- $197,293
- IRR
- 18.6%
- Equity multiple
- 6.11×
- Total profit
- $313,401
- Equity at exit
- $425,469
Cash invested: $61,320 (down + closing). Projections, not guarantees.
Landlord ↔ Tenant lean methodology
- Overall (STATE)
- 83 Strongly Landlord-Friendly
- State Iowa
- 83 Strongly Landlord-Friendly · R+6
- County
- — inherits STATE
- City
- — inherits STATE
ZIP-level market 52208
- Home prices YoY
- 5.4%
- Active inventory
- 31
- Price-to-rent
- 14.3×
Monthly cashflow live
- Estimated rent
- $1,278 medium interval (Pro) →
- Mortgage (P&I)
- −$1,148
- Tax from tax record
- −$40 /mo · $484/yr
- Insurance
- −$91
- HOA
- −$0
- Vacancy / Maint / Mgmt
- −$268
- Net cashflow
- $-271
Break-even live
UW: 25.0% down · 7.5% · 30yr · 1.5% tax · 5.0% vac · 8.0% maint · 8.0% mgmt
Financing live
Cash to close
- Down payment
- $54,750
- Closing costs
- $6,570
- Reserves months
- —
- Total cash needed
- —
Loan-product check · same deal, 3 products live
Conventional
25% down · 7.5% · 30yr
- Down + closing
- —
- Monthly P&I
- —
- Monthly cashflow
- —
- DSCR
- —
- Eligible?
- —
Personal DTI + credit; lowest rate.
DSCR
20% down · 8.5% · 30yr
- Down + closing
- —
- Monthly P&I
- —
- Monthly cashflow
- —
- DSCR
- —
- Eligible?
- —
No personal income docs; deal must DSCR.
Hard money
10% down · 12.0% · 12mo
- Down + closing
- —
- Monthly P&I
- —
- Monthly cashflow
- —
- DSCR
- —
- Eligible?
- —
Short-term bridge; refi at stabilization.
Listing history 1 events
-
2026-06-17$219,000 Active 1 DOM
ⓘ Source: listings_history table (triggers on properties + properties_extension) + one-shot
backfill from property_details.listing_events for pre-trigger history.
Tax reassessment forecast IA · Partial reset (capped growth)
- Current annual tax
- $484 · $40/mo
- Projected year-2 tax
- $1,961 · $163/mo
- Expected delta
- +$1,477/yr (+$123/mo · 305.2%)
ⓘ Screening estimate from a state-policy table — verify with the county assessor before closing.
Climate risk First Street
- Flood 1/10 Low FEMA zone X (unshaded) · 0% chance over 30 yrs
- Wildfire 4/10 Moderate
- Heat 3/10 Moderate 7 d/yr ≥103°F today · 15 d/yr by 30 yrs out
- Wind 2/10 Low
- Air quality 1/10 Low 0 unhealthy d/yr today · 0 by 30 yrs out
Nearby sold comps map
Loading sold comps map…
Walkable amenities ~0.75 mi
Loading nearby amenities…
Taxation est. · year 1
- Rental income
- $15,330
- − Mortgage interest
- −$12,267
- − Property taxes
- −$484
- − Insurance
- −$1,095
- − Repairs & maintenance
- −$1,226
- − Management
- −$1,226
- − Depreciation
- −$6,371
- Taxable loss
- −$7,340
- Est. tax savings @ 24.0%
- +$1,762
- After-tax cash flow
- $-1,488/yr
For passive investors: Depreciation is non-cash, so a rental often shows a tax loss while cash-flowing — sheltering income. Rental losses are passive: they offset passive income freely, and up to $25,000/yr can offset ordinary (W-2) income if you actively participate and your MAGI is under $100k (phasing out to $0 by $150k); unused losses carry forward. On sale, claimed depreciation is recaptured at up to 25%, and gains may owe capital-gains tax (a 1031 exchange can defer both). Figures are a year-1 estimate at your 24.0% rate — not tax advice; consult a CPA.
Schools (NCES district)
- District
- Belle Plaine Community School District
- NCES district ID
- 1904620
- Math proficiency
- 68% ▼ -5.00%
- Reading proficiency
- 74% ▬ 0.00%
- Median HH income
- $42,054
- Composite
- 59.42/100
- National rank
- #927
- State rank
- #144 of 289 in IA
Livability — Belle Plaine
- Score
- 75/100
- State rank
- #215
- US rank
- #3962
Category grades
Schools grade is shown separately in the Schools card above.
Census & demographics
- Census place
- Belle Plaine, IA
- Population (ZIP)
- 2,921
Population outlook (Benton County) Hauer SSP2
- Today (2025)
- 25,078 people
- By 2030
- 24,606 · -1.9%
- By 2040
- 23,425 · -6.6%
- By 2050
- 21,891 · -12.7%
- By 2075
- 19,482 · -22.3%
- By 2100
- 17,139 · -31.7%
Race, ethnicity, and origin ACS 2023
- Neighborhood character
- Predominantly White (94%)
- Race & ethnicity
- White 94% Hispanic / Latino 3% Two or more races 3%
- Common ancestry
- Slovak 3% Portuguese 3% Lithuanian 3%
- Foreign-born
- 1% · Canada
- Languages at home
- 98% English-only · Spanish 1%
Political lean MEDSL · Benton
- 2024 margin
- Solid R (+33.2) · D 32.8% · R 66.0% · Other 1.3%
- 2008→2024 swing
- -37.7pp toward R · 2008: 4.5pp · 2024: -33.2pp
- All cycles
- 2024: R+33.2 2020: R+27.5 2016: R+26.0 2012: R+0.6 2008: D+4.5
Not yet ingested
- Civics
- —
Market trends
- HPI YoY
- ▲ 12.07%
- Current HPI
- 237.1468
- Rent YoY
- —
- Metro
- —
- State GDP YoY
- ▲ 2.48%
- F500 in state
- 4
Industry mix (Fortune 500 HQ in IA)
| Industry | F500 HQs | Revenue |
|---|---|---|
| Financial Services | 1 | $16B |
|
||
| Retail / Convenience | 1 | $15B |
|
||
Price history
+852.2% since first listed4 events — show timeline
- 2026-06-17 Listed $219,000 CRAAR, CDRMLS
- 1994-08-25 Sold (Public Records) $20,000 Public Records
- 1994-08-04 Sold (Public Records) $25,000 Public Records
- 1993-09-01 Sold (Public Records) $23,000 Public Records
Property tax history
+1.0%/yrLatest (2025): $484 · -15.7% YoY. Source: county tax records.
Cash-flow waterfall
monthlySold comps — $/sqft
last 12 mo · ≤1 miLoading sold comps…