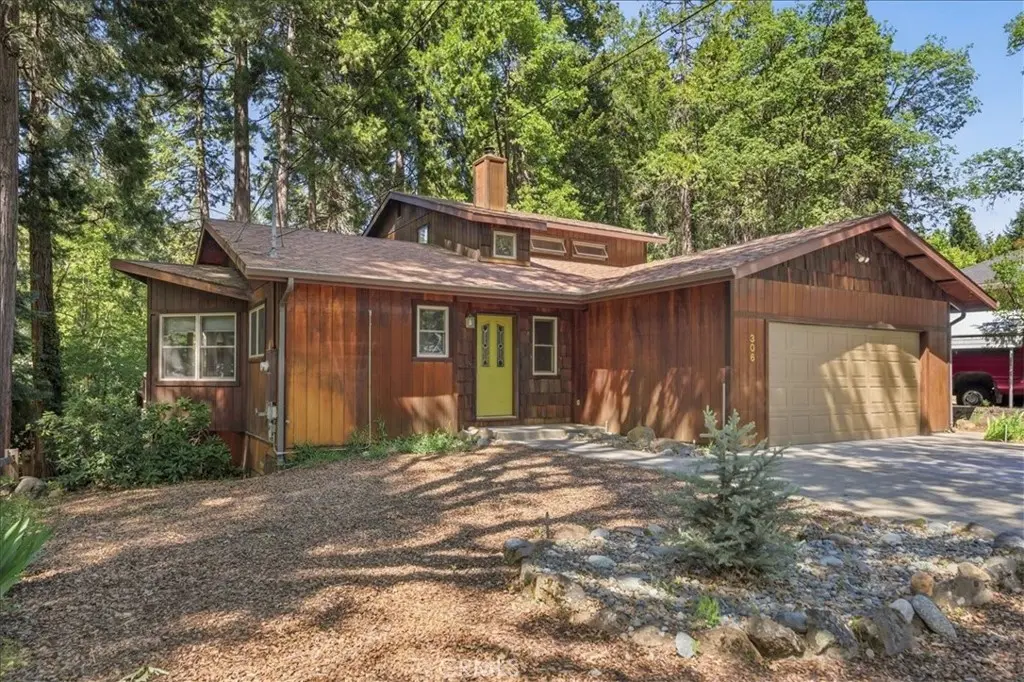
306 Gaudenzio · Mount Shasta, CA
Flood risk 1/10 · Minimal
- FEMA flood zone
- X (unshaded)
- Chance of flooding over 30 yrs
- 0.0%
- Est. flood insurance / yr
- $507 – $1,088
Fire risk 5/10 · Moderate
- Est. fire insurance / yr
- $659 – $1,223
Heat risk 4/10 · Minor
- Hot days now (above 92°F)
- 7 days/yr
- Hot days in 30 yrs
- 16 days/yr
Wind risk 1/10 · Minimal
- Chance of severe wind over 30 yrs
- —
Air-quality risk 10/10 · Severe
- Unhealthy air days now
- 34 days/yr
- Unhealthy air days in 30 yrs
- 34 days/yr
Risk factors via First Street. Map © Google.
Why this score? — see what drove the D grade
The composite is a weighted blend of 9 inputs, each scored 0–100. Each bar is that input's sub-score; the figure is the points it added to the 100-point composite (weight × sub-score).
- Cash flow +14.6/30.0
- ARV discount +7.3/15.0
- DSCR +4.4/10.0
- Schools +3.6/10.0
- Livability +3.2/5.0
- 1% rule +3.1/10.0
- Rent growth +2.5/5.0
- Condition / age +2.5/5.0
- Appreciation +0.0/10.0
$459,000
🖨 Deal sheet (PDF) 📄 Offer letter ✓ Due diligence
Listing remarks MLS
ADJOINING LOT INCLUDED! GREAT LOCATION! This 3 BR/2BA home is located in one of Mt. Shasta's highly desirable neighborhoods on a quiet street. Built in 1990, this home has a tranquil outdoor setting from the main deck as well as a private balcony off the master suite. Vaulted ceilings and skylight in the living room; lovely kitchen with breakfast bar open to the living room; and a dining area off the kitchen with slider to the deck. Wood casement dual pane windows and ample large windows bring the scenic outdoors inside! Clerestory windows in the master bedroom bring in lots of natural light and air flow while optimizing wall space for furniture or art. Woodstove, hydronic central heating system, and mini splits provide all the comfort you'll need for any season. A low maintenance front yard and natural landscaping on the adjacent lot add to the simplicity of ownership. Minutes to downtown and the location is ideal for all the recreational outdoor activities the area has to offer. Last photo virtually enhanced (twilight).
Key facts
- Private balcony
- Woodstove
- Clerestory windows
Tags
Property features AI
Finance
- Other: Single-family dwelling (1 unit); No ADU; Living area and lot size from assessor data; Access via paved city streets; Additional parcel referenced
- HOA & community: Community near golf course, lake, park and national forest areas; Recreational nearby: biking, hiking, fishing
Exterior
- Parking: Attached garage with front entry and direct access; Garage door opener; 2 garage/parking spaces
- Security: Carbon monoxide detector(s); Smoke detector
- Utilities: Public/district water; Public sewer; Electricity connected; Sewer connected; Water connected; Cable available; Telephone available in street
- Home design: House; Two stories; Entry at level 1; Street entry; Turnkey condition; R1 zoning
- Construction: Wood construction; Composition roof; Concrete perimeter foundation; Year built (assessor)
- Exterior features: Back yard; Partial fencing; Rain gutters; Wood deck/patio (see remarks); No pool; Has view
Interior
- Kitchen: Dishwasher; Garbage disposal; Microwave; Refrigerator; Electric range and oven; Tile counters; Breakfast counter/bar; Kitchen open to family room
- Bedrooms: Primary suite; Two main-level bedrooms
- Flooring: Tile; Vinyl; Carpet
- Bathrooms: Two full bathrooms; Jetted tub; Separate tub and shower; Shower in tub; Bathtub and shower
- Heating & cooling: Combination heating with wood stove; Cooling (see remarks)
- Interior features: Open floor plan; Tile counters; Sliding glass door(s); Skylights; Double-pane and casement wood-frame windows; Carbon monoxide and smoke detectors; Main floor full bath
- Laundry & utility: Laundry in closet
Neighborhood map
What this means for you Summary
Snapshot
- This is a 3-bed/2.0-bath single-family listed at $459k.
Deal economics
- At list price, monthly cash flow is $105 ($1k/yr) — positive.
- The deal already cash-flows at list — no discount required.
- To meet the 1% rule (rent ≥ 1% of price), the offer needs to be $373k (18.7% below list).
- Recommended offer: $373k (18.7% below list) — sets the bar for 1% rule.
- Cap rate 6.6% vs local median 4.1% in Mount Shasta — top-decile yield for the area; either an underpriced asset or a hidden risk that comps aren't pricing in. Stress-test before assuming the spread holds.
Location & tenants
- Location reads 64/100 on livability (#405 in CA) — a middle-class / working-renter tenant base. Strengths: health & safety A+; Watch: housing C-, employment D+, crime F.
- Siskiyou Union High (rural): math 25% / reading 55% proficiency, ranked #763 of 1,400 in CA (top 54%) — families likely to look elsewhere, expect single-tenant / working-renter base with shorter leases; only 12% free/reduced lunch — higher-income household profile.
- Zoned schools: Mt. Shasta Elementary (math 34% / reading 34%, grade F, #719 of 1,571 statewide, top 48%, 194 students, 51% FRL); Sisson (math 38% / reading 59%, grade C-, #109 of 498 statewide, top 22%, 270 students, 44% FRL); Mount Shasta High (math 15% / reading 64%, grade F, #520 of 1,170 statewide, top 45%, 266 students, 30% FRL) — zoned schools average 42% FRL vs 12% district-wide (30 pts higher); higher-poverty schools than district average — tighter screening recommended.
- Market conditions: 117 active listings in the ZIP; 3 comparable units currently listed for rent nearby; rentals at typical pace (median 23d on market — plan ~3-4 weeks tenant-placement turnaround); 50 units permitted in Siskiyou County in 2024 (0 in 5+ unit buildings).
Forward outlook
- Local home prices are declining (-3.0%/yr); year-one equity from $3k of loan paydown is wiped out by about $14k of value loss. Plan a longer hold.
- Siskiyou County population projected at -26% by 2050 — secular population decline; favor cash flow + early exit over multi-decade hold.
Negotiation context
- It's been on market 41 days — a 3% lower offer ($445k) is reasonable based on typical stale-listing flexibility.
- 4 sale attempts since 13y ago with the ask held roughly flat each time — persistent listings suggest the price (not the market) is what's stuck; bring a comps-based counter.
- Current owner paid $310k; 48% above their basis — modest negotiation headroom, anchor on the comps not their cost.
Risks & watch-outs
- Climate carrying-cost: moderate wildfire risk — expect insurance premiums to compound above CPI over the hold.
Questions for the listing agent
- It's been on market 41 days. Have you received any prior offers? Is the seller open to a 19% concession, seller financing, or rate buy-down credit?
- Is there a deadline driving the sale (1031 exchange, divorce, estate, relocation)? That informs how much negotiation room exists.
- Crime grade is F in this area — have there been break-ins, vandalism, or insurance claims at this property in the last 3 years? What carrier currently insures it and at what premium?
- The area grade is low — what's the realistic commute time and amenity access for the typical tenant pool here? Any planned neighborhood developments (good or bad) we should know about?
- What's the average days-on-market for RENTAL listings here right now (not sales)? A rising rental-DOM trend means longer vacancies and softer asking-rent achievability than the comps imply.
- What's the recent tenant-quality profile in this submarket — average credit score on applications, eviction rate, late-payment / NSF rate, and stable-employment percentage? A property-management company in the area should have these aggregated.
- How much new for-sale + rental construction is in the pipeline within 1–3 miles? Heavy new supply typically softens prices + rents 12–24 months out; constrained supply supports both.
Investment metrics
- 1% rule
- 0.81% ✗
- Cap rate
- 6.57%
- Cash-on-cash
- 0.98%
- DSCR
- 1.04
- GRM
- 10.2
CMA / ARV
- ARV (on-the-fly)
- $457,470
- Comps found
- 12
Show comp detail 12 sales within ~0.75 mi
| Address | Dist | Beds/Ba | Sqft | Sold | Price | $/sf | Match |
|---|---|---|---|---|---|---|---|
| 506 Eiler Rd | 0.16mi | 3/2.0 | 1,528 (-0%) | 7mo | $440,000 | $288 | 86 |
| 307 S Washington Dr | 0.05mi | 3/2.0 | 1,480 (-3%) | 11mo | $370,000 | $250 | 83 |
| 205 Perry St | 0.17mi | 3/2.0 | 1,500 (-2%) | 11mo | $449,000 | $299 | 79 |
| 515 Eiler Rd | 0.16mi | 3/2.5 | 1,635 (+7%) | 13mo | $635,000 | $388 | 68 |
| 600 Mountain View Drive Dr | 0.44mi | 3/2.0 | 1,489 (-3%) | 8mo | $455,000 | $306 | 68 |
| 322 E Jessie St | 0.66mi | 3/2.0 | 1,523 (-0%) | 1mo | $335,000 | $220 | 68 |
| 305 N C St | 0.34mi | 3/2.0 | 1,638 (+7%) | 10mo | $385,000 | $235 | 64 |
| 201 Sheldon Ave | 0.30mi | 4/2.0 (+1) | 1,442 (-6%) | 12mo | $400,000 | $277 | 62 |
| 513 Meadow Ave | 0.46mi | 3/2.0 | 1,422 (-7%) | 9mo | $430,000 | $302 | 60 |
| 604 Meadow Ave | 0.49mi | 3/2.0 | 1,354 (-12%) | 2mo | $470,000 | $347 | 57 |
| 817 Ream Ave | 0.33mi | 3/1.0 | 1,400 (-8%) | 12mo | $355,000 | $254 | 56 |
| 404 N Adams | 0.55mi | 4/3.0 (+1) | 1,438 (-6%) | 11mo | $502,996 | $350 | 47 |
Match score weights: distance 35% · size 25% · config 20% · recency 20%. Top-matched comps best support the ARV.
Projected returns pro-forma
-3.0% appreciation · 3.0% rent growth · sell at horizon
- IRR
- -14.8%
- Equity multiple
- 0.47×
- Total profit
- $-67,818
- Equity at exit
- $68,438
- IRR
- -6.2%
- Equity multiple
- 0.60×
- Total profit
- $-51,011
- Equity at exit
- $39,686
Cash invested: $128,520 (down + closing). Projections, not guarantees.
Landlord ↔ Tenant lean methodology
- Overall (STATE)
- 18 Strongly Tenant-Friendly
- State California
- 18 Strongly Tenant-Friendly · D+13
- County
- — inherits STATE
- City
- — inherits STATE
ZIP-level market 96067
- Active inventory
- 117
- Price-to-rent
- 10.2×
Monthly cashflow live
- Estimated rent
- $3,733 medium interval (Pro) →
- Mortgage (P&I)
- −$2,407
- Tax from tax record
- −$245 /mo · $2,944/yr
- Insurance
- −$191
- HOA
- −$0
- Vacancy / Maint / Mgmt
- −$784
- Net cashflow
- $105
Break-even live
Sensitivity live
| Price | -10% $365 | -5% $235 | +0% $105 | +5% $-25 | +10% $-155 |
|---|---|---|---|---|---|
| Rent | -10% $-190 | -5% $-42 | +0% $105 | +5% $253 | +10% $400 |
| Rate | -1.0pp $336 | -0.5pp $222 | base $105 | +0.5pp $-14 | +1.0pp $-135 |
UW: 25.0% down · 7.5% · 30yr · 1.5% tax · 5.0% vac · 8.0% maint · 8.0% mgmt
Financing live
Cash to close
- Down payment
- $114,750
- Closing costs
- $13,770
- Reserves months
- —
- Total cash needed
- —
Loan-product check · same deal, 3 products live
Conventional
25% down · 7.5% · 30yr
- Down + closing
- —
- Monthly P&I
- —
- Monthly cashflow
- —
- DSCR
- —
- Eligible?
- —
Personal DTI + credit; lowest rate.
DSCR
20% down · 8.5% · 30yr
- Down + closing
- —
- Monthly P&I
- —
- Monthly cashflow
- —
- DSCR
- —
- Eligible?
- —
No personal income docs; deal must DSCR.
Hard money
10% down · 12.0% · 12mo
- Down + closing
- —
- Monthly P&I
- —
- Monthly cashflow
- —
- DSCR
- —
- Eligible?
- —
Short-term bridge; refi at stabilization.
Rent comps 3 comps
| Address | Beds | Baths | Sqft | Rent | $/sqft | DOM | Units | Dist |
|---|---|---|---|---|---|---|---|---|
| 230 S Washington Dr Mount Shasta, CA | 3.0 | 3.0 | 1697 | $4,000 | $2.36 | 23d | 1 | 0.08mi |
| 413 E Ivy St Mount Shasta, CA | 2.0 | 2.0 | 1234 | $2,150 | $1.74 | 23d | 1 | 0.74mi |
| Grant Rd Mt Shasta, CA | 3.0 | 2.5 | 1500 | $2,750 | $1.83 | 23d | 1 | 1.43mi |
Listing history 27 events
-
2026-06-22days on market $459,000 Active 41 DOM
-
2026-06-21days on market $459,000 Active 40 DOM
-
2026-06-19days on market $459,000 Active 38 DOM
-
2026-06-18days on market $459,000 Active 37 DOM
-
2026-06-17days on market $459,000 Active 36 DOM
-
2026-06-16days on market $459,000 Active 35 DOM
-
2026-06-15days on market $459,000 Active 34 DOM
-
2026-06-14days on market $459,000 Active 32 DOM
-
2026-06-12days on market $459,000 Active 31 DOM
-
2026-06-09days on market $459,000 Active 28 DOM
-
2026-06-08days on market $459,000 Active 27 DOM
-
2026-06-07days on market $459,000 Active 26 DOM
-
2026-06-07days on market $459,000 Active 25 DOM
-
2026-06-04days on market $459,000 Active 22 DOM
-
2026-06-02days on market $459,000 Active 21 DOM
-
2026-06-01days on market $459,000 Active 20 DOM
-
2026-05-31days on market $459,000 Active 19 DOM
-
2026-05-31days on market $459,000 Active 18 DOM
-
2026-05-12$459,000 Active
-
2026-05-08$459,000 Active 1037-char remark
Show marketing remark (1037 chars)
ADJOINING LOT INCLUDED! GREAT LOCATION! This 3 BR/2BA home is located in one of Mt. Shasta's highly desirable neighborhoods on a quiet street. Built in 1990, this home has a tranquil outdoor setting from the main deck as well as a private balcony off the master suite. Vaulted ceilings and skylight in the living room; lovely kitchen with breakfast bar open to the living room; and a dining area off the kitchen with slider to the deck. Wood casement dual pane windows and ample large windows bring the scenic outdoors inside! Clerestory windows in the master bedroom bring in lots of natural light and air flow while optimizing wall space for furniture or art. Woodstove, hydronic central heating system, and mini splits provide all the comfort you'll need for any season. A low maintenance front yard and natural landscaping on the adjacent lot add to the simplicity of ownership. Minutes to downtown and the location is ideal for all the recreational outdoor activities the area has to offer. Last photo virtually enhanced (twilight).
-
2018-09-06soldstatus $310,000
-
2018-09-03soldstatus $304,000 451-char remark
Show marketing remark (451 chars)
Fabulous location!!! Adjoining lot included in price! This sweet home is situated on a beautiful treed mountain lot within walking distance to downtown Mt. Shasta. This quality home features wood casement windows, tile kitchen counter tops, eating bar, open floor plan to the living room with vaulted ceilings. The master bath has a tile spa soaking tub and the the large master bedroom has a wood balcony looking down into the space treed backyard.
-
2018-01-08$310,000 451-char remark
Show marketing remark (451 chars)
Fabulous location!!! Adjoining lot included in price! This sweet home is situated on a beautiful treed mountain lot within walking distance to downtown Mt. Shasta. This quality home features wood casement windows, tile kitchen counter tops, eating bar, open floor plan to the living room with vaulted ceilings. The master bath has a tile spa soaking tub and the the large master bedroom has a wood balcony looking down into the space treed backyard.
-
2013-07-12soldstatus $255,420
-
2013-07-12soldstatus $255,500
-
2013-05-10$263,000
-
1989-08-28soldstatus $22,000
ⓘ Source: listings_history table (triggers on properties + properties_extension) + one-shot
backfill from property_details.listing_events for pre-trigger history.
Tax reassessment forecast CA · Resets to sale price
- Current annual tax
- $2,944 · $245/mo
- Projected year-2 tax
- $3,488 · $291/mo
- Expected delta
- +$544/yr (+$45/mo · 18.5%)
ⓘ Screening estimate from a state-policy table — verify with the county assessor before closing.
Climate risk First Street
- Flood 1/10 Low FEMA zone X (unshaded) · 0% chance over 30 yrs
- Wildfire 5/10 Major
- Heat 4/10 Moderate 7 d/yr ≥92°F today · 16 d/yr by 30 yrs out
- Wind 1/10 Low
- Air quality 10/10 Extreme 34 unhealthy d/yr today · 34 by 30 yrs out
Nearby sold comps map
Loading sold comps map…
Walkable amenities ~0.75 mi
Loading nearby amenities…
Taxation est. · year 1
- Rental income
- $44,794
- − Mortgage interest
- −$25,711
- − Property taxes
- −$2,944
- − Insurance
- −$2,295
- − Repairs & maintenance
- −$3,584
- − Management
- −$3,584
- − Depreciation
- −$13,353
- Taxable loss
- −$6,676
- Est. tax savings @ 24.0%
- +$1,602
- After-tax cash flow
- $2,866/yr
For passive investors: Depreciation is non-cash, so a rental often shows a tax loss while cash-flowing — sheltering income. Rental losses are passive: they offset passive income freely, and up to $25,000/yr can offset ordinary (W-2) income if you actively participate and your MAGI is under $100k (phasing out to $0 by $150k); unused losses carry forward. On sale, claimed depreciation is recaptured at up to 25%, and gains may owe capital-gains tax (a 1031 exchange can defer both). Figures are a year-1 estimate at your 24.0% rate — not tax advice; consult a CPA.
Schools (NCES district)
- District
- Siskiyou Union High
- NCES district ID
- 0636940
- Math proficiency
- 25% ▲ 5.00%
- Reading proficiency
- 55% ▲ 5.00%
- Median HH income
- $39,293
- Composite
- 35.84/100
- National rank
- #9605
- State rank
- #763 of 1400 in CA
Livability — Mount Shasta
- Score
- 64/100
- State rank
- #405
- US rank
- #13833
Category grades
Schools grade is shown separately in the Schools card above.
Census & demographics
- Census place
- Mount Shasta, CA
- City population
- 7,800
- Population (ZIP)
- 7,800
Population outlook (Siskiyou County) Hauer SSP2
- Today (2025)
- 39,337 people
- By 2030
- 36,930 · -6.1%
- By 2040
- 32,367 · -17.7%
- By 2050
- 29,030 · -26.2%
- By 2075
- 23,534 · -40.2%
- By 2100
- 19,312 · -50.9%
Race, ethnicity, and origin ACS 2023
- Neighborhood character
- Predominantly White (82%)
- Race & ethnicity
- White 82% Hispanic / Latino 9% Two or more races 9% Pacific Islander 2% Asian 2%
- Hispanic origin (detail)
- Mexican 5%
- Common ancestry
- Lithuanian 4% Russian 2% Italian 2%
- Foreign-born
- 9% · Canada, China
- Languages at home
- 90% English-only · Spanish 6% Other Asian/Pacific 2% Chinese 1%
Political lean MEDSL · Siskiyou
- 2024 margin
- R (+19.2) · D 38.8% · R 58.0% · Other 3.2%
- 2008→2024 swing
- -8.8pp toward R · 2008: -10.4pp · 2024: -19.2pp
- All cycles
- 2024: R+19.2 2020: R+15.8 2016: R+20.7 2012: R+15.6 2008: R+10.4
Not yet ingested
- Civics
- —
Market trends
- HPI YoY
- ▼ -227.87%
- Current HPI
- 115.4662
- Rent YoY
- —
- Metro
- —
- State GDP YoY
- ▲ 3.21%
- F500 in state
- 116
Industry mix (Fortune 500 HQ in CA)
| Industry | F500 HQs | Revenue |
|---|---|---|
| Technology | 27 | $1,492B |
|
||
| Financial Services | 3 | $174B |
|
||
| Retail | 3 | $44B |
|
||
| Insurance | 3 | $26B |
|
||
| Media / Entertainment | 2 | $115B |
|
||
| Pharmaceuticals / Biotech | 2 | $62B |
|
||
Price history
+1986.4% since first listed9 events — show timeline
- 2026-05-12 Listed $459,000 CRMLS
- 2026-05-08 Listed $459,000 SMLS
- 2018-09-06 Sold (Public Records) $310,000 Public Records
- 2018-09-03 Sold (MLS) $304,000 SMLS
- 2018-01-08 Listed $310,000 SMLS
- 2013-07-12 Sold (Public Records) $255,500 Public Records
- 2013-07-12 Sold (MLS) $255,420 SMLS
- 2013-05-10 Listed $263,000 SMLS
- 1989-08-28 Sold (Public Records) $22,000 Public Records
Property tax history
+1.8%/yrLatest (2025): $2,944 · +1.7% YoY. Source: county tax records.
Cash-flow waterfall
monthlySold comps — $/sqft
last 12 mo · ≤1 miLoading sold comps…