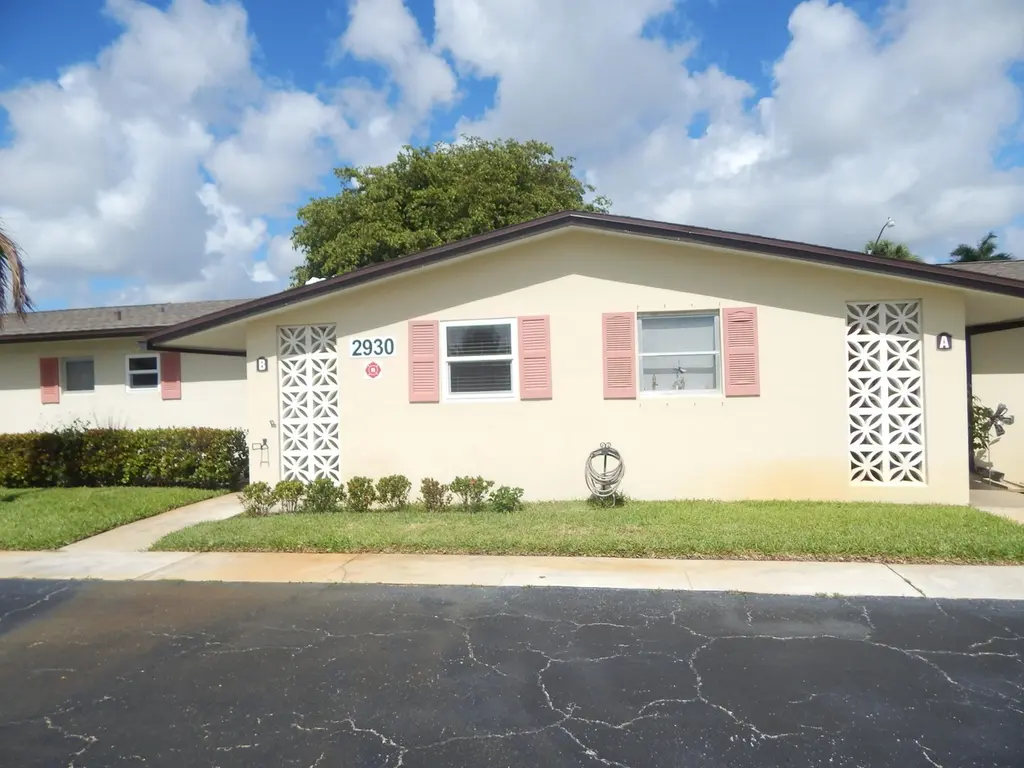
2930 E Ashley Dr Dr E Unit B · Greenacres, FL
Flood risk 1/10 · Minimal
- FEMA flood zone
- X (unshaded)
- Chance of flooding over 30 yrs
- 0.0%
- Est. flood insurance / yr
- $507 – $1,088
Fire risk 1/10 · Minimal
- Est. fire insurance / yr
- $947 – $1,759
Heat risk 9/10 · Severe
- Hot days now (above 105°F)
- 5 days/yr
- Hot days in 30 yrs
- 16 days/yr
Wind risk 10/10 · Severe
- Chance of severe wind over 30 yrs
- 99.0%
Air-quality risk 2/10 · Minimal
- Unhealthy air days now
- 0 days/yr
- Unhealthy air days in 30 yrs
- 2 days/yr
Risk factors via First Street. Map © Google.
Why this score? — see what drove the C grade
The composite is a weighted blend of 9 inputs, each scored 0–100. Each bar is that input's sub-score; the figure is the points it added to the 100-point composite (weight × sub-score).
- Cash flow +20.6/30.0
- 1% rule +10.0/10.0
- ARV discount +7.5/15.0
- DSCR +6.5/10.0
- Schools +4.3/10.0
- Livability +3.5/5.0
- Condition / age +2.5/5.0
- Rent growth +2.1/5.0
- Appreciation +0.0/10.0
$90,000
🖨 Deal sheet 📄 Offer letter ✓ Due diligence
Listing remarks MLS
Unit is in its original condition. Great location in rear of area yet close to the clubhouse and pool. Shopping is convenient and public bus service in in the front of Ashley.
Key facts
- Kitchen wall tiles
- New roof
- Air conditioner
Tags
Property features AI
Finance
- Financial info: Pets allowed (restrictions on number and size); Is a senior community
- HOA & community: Ashley Condo Association; Monthly HOA fee; Association amenities include clubhouse, fitness center, pool, sauna, billiard room, shuffleboard court, community room, library, laundry, manager on site, management, sidewalks, and street lights; HOA covers cable TV, insurance, grounds maintenance, pest control, sewer, water, and common areas
Exterior
- Parking: Assigned parking plus guest parking; One open parking space (total parking 1)
- Security: Smoke detectors
- Utilities: Public water; Public sewer; Three-phase electric; Cable available
- Home design: Condominium; Single-story; Facing east; Resale condition
- Construction: CBS construction; Composition/shingle roof; Built on a foundation (public records)
- Exterior features: Porch; Sidewalks; Paved road access; Not waterfront
Interior
- Kitchen: Electric range; Refrigerator
- Bedrooms: One bedroom on the main level
- Flooring: Ceramic tile
- Bathrooms: One full bathroom on the main level
- Heating & cooling: Central heating; Central air conditioning
- Interior features: Entrance foyer; Screened porch
- Laundry & utility: Laundry in a common area; Electric water heater
Neighborhood map
What this means for you Summary
Snapshot
- This is a 1-bed/1.0-bath condo listed at $90k.
Deal economics
- At list price, monthly cash flow is $120 ($1k/yr) — positive.
- The deal already cash-flows at list — no discount required.
- Meets the 1% rule at list price ($2k rent vs $90k).
- Recommended offer: $89k (1.5% below list) — sets the bar for market timing.
Location & tenants
- Location reads 69/100 on livability (#490 in FL) — a middle-class / working-renter tenant base. Strengths: cost of living A+, housing A+, health & safety A; Watch: employment D, amenities F, commute F.
- Palm Beach (suburban): math 46% / reading 53% proficiency, ranked #34 of 73 in FL (top 47%) — families likely to look elsewhere, expect single-tenant / working-renter base with shorter leases.
- Zoned schools: Clifford O Taylor/Kirklane Elementary (math 26% / reading 34%, grade F, #1,882 of 2,144 statewide, top 88%, 1,230 students, 80% FRL); L C Swain Middle School (math 26% / reading 33%, grade F, #469 of 571 statewide, top 84%, 1,451 students, 74% FRL); John I. Leonard High School (math 17% / reading 35%, grade F, #494 of 667 statewide, top 75%, 3,549 students, 67% FRL) — zoned schools average 74% FRL vs 52% district-wide (22 pts higher); higher-poverty schools than district average — tighter screening recommended.
- Zoned-school proficiency averages 28% at this address vs 50% district-wide (-21 pts) — the specific schools serving this property underperform the Palm Beach average; the district grade overstates school quality for this exact location.
- Market conditions: Rents soft (-1.6%/yr); 314 active listings in the ZIP; 30 comparable units currently listed for rent nearby; rentals at typical pace (median 25d on market — plan ~3-4 weeks tenant-placement turnaround); 3,974 units permitted in Palm Beach County in 2024 (1,012 in 5+ unit buildings).
- This rent runs 30% of the median local income ($61k/yr) — at the standard rent-burdened threshold; future hikes will face affordability resistance.
Forward outlook
- Local home prices are declining (-3.0%/yr); year-one equity from $622 of loan paydown is wiped out by about $3k of value loss. Plan a longer hold.
- Palm Beach County population projected at +30% by 2050 — long-run rental-demand tailwind backs the buy-and-hold thesis.
Negotiation context
- It's been on market 20 days — a 2% lower offer ($89k) is reasonable based on typical stale-listing flexibility.
- 5 sale attempts since 19y ago with the ask held roughly flat each time — persistent listings suggest the price (not the market) is what's stuck; bring a comps-based counter.
Risks & watch-outs
- Watch-outs: HOA is 29% of rent.
- Climate carrying-cost: severe wind risk, 99% chance of damaging wind over 30y; extreme-heat days projected 5→16/yr by 2055 (HVAC capex compounding) — expect insurance premiums to compound above CPI over the hold.
Questions for the listing agent
- Built in 1968 — when were the roof, HVAC, electrical panel, plumbing, and water heater last replaced?
- What does the HOA fee cover, when was the last increase, and are there any pending special assessments or reserve-fund shortfalls?
- Any open or pending special assessments — roof, HVAC, plumbing, elevator, façade? What's the per-unit balance and payoff schedule, and is the seller paying it off at close or rolling it to the buyer?
- Is there a deadline driving the sale (1031 exchange, divorce, estate, relocation)? That informs how much negotiation room exists.
- Schools are D-rated, which usually means shorter tenancies and higher turnover. Who's the typical renter profile here, and what's been the actual vacancy rate?
- What's the average days-on-market for RENTAL listings here right now (not sales)? A rising rental-DOM trend means longer vacancies and softer asking-rent achievability than the comps imply.
- What's the recent tenant-quality profile in this submarket — average credit score on applications, eviction rate, late-payment / NSF rate, and stable-employment percentage? A property-management company in the area should have these aggregated.
- How much new apartment / multifamily construction is in the pipeline within 1–3 miles? Heavy new supply (>2% of stock underway) typically softens rents 12–24 months out; light construction supports rent growth.
Investment metrics
- 1% rule
- 1.71% ✓
- Cap rate
- 7.89%
- Cash-on-cash
- 5.70%
- DSCR
- 1.25
- GRM
- 4.9
CMA / ARV
No comps found within radius.
Projected returns pro-forma
-3.0% appreciation · 0.0% rent growth · sell at horizon
- IRR
- -12.9%
- Equity multiple
- 0.56×
- Total profit
- $-11,146
- Equity at exit
- $13,419
- IRR
- -14.4%
- Equity multiple
- 0.36×
- Total profit
- $-16,020
- Equity at exit
- $7,782
Cash invested: $25,200 (down + closing). Projections, not guarantees.
Landlord ↔ Tenant lean methodology
- Overall (STATE)
- 87 Strongly Landlord-Friendly
- State Florida
- 87 Strongly Landlord-Friendly · R+3
- County
- — inherits STATE
- City
- — inherits STATE
ZIP-level market 33415
- Rents YoY
- -1.6%
- Active inventory
- 314
- Price-to-rent
- 4.9×
Monthly cashflow live
- Estimated rent
- $1,538 high interval (Pro) →
- Mortgage (P&I)
- −$472
- Tax from tax record
- −$133 /mo · $1,601/yr
- Insurance
- −$38
- HOA
- −$452
- Vacancy / Maint / Mgmt
- −$323
- Net cashflow
- $120
Break-even live
UW: 25.0% down · 7.5% · 30yr · 1.5% tax · 5.0% vac · 8.0% maint · 8.0% mgmt
Financing live
Cash to close
- Down payment
- $22,500
- Closing costs
- $2,700
- Reserves months
- —
- Total cash needed
- —
Loan-product check · same deal, 3 products live
Conventional
25% down · 7.5% · 30yr
- Down + closing
- —
- Monthly P&I
- —
- Monthly cashflow
- —
- DSCR
- —
- Eligible?
- —
Personal DTI + credit; lowest rate.
DSCR
20% down · 8.5% · 30yr
- Down + closing
- —
- Monthly P&I
- —
- Monthly cashflow
- —
- DSCR
- —
- Eligible?
- —
No personal income docs; deal must DSCR.
Hard money
10% down · 12.0% · 12mo
- Down + closing
- —
- Monthly P&I
- —
- Monthly cashflow
- —
- DSCR
- —
- Eligible?
- —
Short-term bridge; refi at stabilization.
Rent comps 30 comps
| Address | Beds | Baths | Sqft | Rent | $/sqft | DOM | Units | Dist |
|---|---|---|---|---|---|---|---|---|
| 2966 Ashley Dr E Unit C West Palm Beach, FL | 1.0 | 1.0 | 611 | $1,375 | $2.25 | 24d | 1 | 0.03mi |
| 2951 Ashley Dr W West Palm Beach, FL | 1.0 | 1.5 | 662 | $1,525 | $2.30 | 21d | 1 | 0.15mi |
| 2951 Ashley Dr W Unit D West Palm Beach, FL | 1.0 | 1.5 | 662 | $1,450 | $2.19 | 17d | 1 | 0.15mi |
| 2550 Lakehaven Rd West Palm Beach, FL | 1.0 | 1.0 | 400 | $1,500 | $3.75 | 24d | 1 | 0.41mi |
| 2854 Crosley Dr E Unit J West Palm Beach, FL | 1.0 | 1.0 | 612 | $1,300 | $2.12 | 24d | 1 | 0.42mi |
| 2805 Crosley Dr E Unit E West Palm Beach, FL | 1.0 | 1.5 | 662 | $1,250 | $1.89 | 24d | 1 | 0.46mi |
| 2723 Dudley Dr W Unit G West Palm Beach, FL | 1.0 | 1.0 | 611 | $1,300 | $2.13 | 24d | 1 | 0.60mi |
| 4904 Dillon St Unit C Greenacres, FL | 1.0 | 1.0 | 699 | $1,450 | $2.07 | 24d | 1 | 0.67mi |
| 2607 Dudley Dr W Unit L West Palm Beach, FL | 1.0 | 1.0 | 611 | $1,300 | $2.13 | 8d | 1 | 0.73mi |
| 4403 Anna Ln Unit B Palm Springs, FL | 1.0 | 1.0 | 740 | $1,600 | $2.16 | 8d | 1 | 0.79mi |
| 3263 Kirk Rd #2 Lake Worth, FL | 1.0 | 1.0 | 619 | $1,650 | $2.67 | 24d | 1 | 0.81mi |
| 3263 Kirk Rd #2 Lake Worth, FL | 1.0 | 1.0 | 619 | $1,650 | $2.67 | 8d | 1 | 0.81mi |
| 2715 Emory Dr W Unit C West Palm Beach, FL | 1.0 | 1.5 | 661 | $1,425 | $2.16 | 18d | 1 | 0.87mi |
| 600 Village Green Ct #203 Palm Springs, FL | 1.0 | 1.0 | 650 | $1,300 | $2.00 | 4d | 1 | 0.94mi |
| 2647 Emory Dr W Unit C West Palm Beach, FL | 1.0 | 1.0 | 612 | $1,250 | $2.04 | 24d | 1 | 0.95mi |
| 2551 Emory Dr W Unit A West Palm Beach, FL | 1.0 | 1.5 | 661 | $1,600 | $2.42 | 24d | 1 | 0.96mi |
| 500 Village Green Cir W Palm Springs, FL | 1.0–2.0 | 1.0–1.5 | 739 | $1,400 | $1.89 | 24d | 2 | 0.97mi |
| 555 Purdy Ln Palm Springs, FL | 1.0 | 1.0 | 650 | $1,375 | $2.12 | 5d | 1 | 0.98mi |
| 3874 7th Ave N Unit 3878 Lake Worth Beach, FL | 1.0 | 1.0 | 528 | $1,600 | $3.03 | 24d | 1 | 1.09mi |
| 555 Kirk Rd Palm Springs, FL | 1.0 | 1.0 | 625 | $2,268 | $3.63 | 8d | 1 | 1.12mi |
| 555 Kirk Rd Palm Springs, FL | 1.0 | 1.0 | 670 | $2,352 | $3.51 | 14d | 1 | 1.12mi |
| 436 Fontana Dr Lake Worth, FL | 1.0 | 1.0 | 550 | $1,450 | $2.64 | 24d | 1 | 1.20mi |
| 436 Fontana Dr Lake Worth, FL | 1.0 | 1.0 | 550 | $1,375 | $2.50 | 22d | 1 | 1.20mi |
| 118 Urquhart St Lake Worth, FL | 2.0 | 1.0 | 480 | $1,850 | $3.85 | 18d | 1 | 1.28mi |
| 3890 Lakewood Rd #1 Lake Worth, FL | 1.0 | 1.0 | 433 | $1,500 | $3.46 | 11d | 1 | 1.29mi |
| 5855 S 37th St Unit 5857 Greenacres, FL | 2.0 | 1.0 | 747 | $1,974 | $2.64 | 8d | 1 | 1.35mi |
| 2206 Laurel Way West Palm Beach, FL | 1.0–3.0 | 1.0–2.0 | 850 | $1,700 | $2.00 | 24d | 3 | 1.38mi |
| 3901 Gulfstream Rd Unit 2 B Lake Worth Beach, FL | 1.0 | 1.0 | 450 | $1,700 | $3.78 | 21d | 1 | 1.41mi |
| 3654 Coconut Rd Palm Springs, FL | 1.0 | 1.0 | 600 | $1,500 | $2.50 | 24d | 1 | 1.42mi |
| 3901 Lakewood Rd Unit A Lake Worth Beach, FL | 2.0 | 1.0 | 704 | $2,000 | $2.84 | 24d | 1 | 1.50mi |
HOA detail condo
- Monthly dues
- $452 · $5,424/yr
- Likely covers
- pool
- Assessments
- None detected in remarks — confirm with the listing agent.
Listing history 13 events
-
2026-06-18days on market $90,000 Active 20 DOM
-
2026-06-17days on market $90,000 Active 19 DOM
-
2026-06-16days on market $90,000 Active 18 DOM
-
2026-06-15days on market $90,000 Active 17 DOM
-
2026-06-13days on market $90,000 Active 15 DOM
-
2026-06-09days on market $90,000 Active 11 DOM
-
2026-06-08days on market $90,000 Active 10 DOM
-
2026-06-07days on market $90,000 Active 9 DOM
-
2026-06-04days on market $90,000 Active 6 DOM
-
2026-06-03days on market $90,000 Active 5 DOM
-
2026-06-02days on market $90,000 Active 4 DOM
-
2026-06-01days on market $90,000 Active 3 DOM
-
2026-05-31days on market $90,000 Active 2 DOM
ⓘ Source: listings_history table (triggers on properties + properties_extension) + one-shot
backfill from property_details.listing_events for pre-trigger history.
Tax reassessment forecast FL · Resets to sale price
- Current annual tax
- $1,601 · $133/mo
- Projected year-2 tax
- $1,601 · $133/mo
- Expected delta
- $0/yr ($0/mo · 0.0%)
ⓘ Screening estimate from a state-policy table — verify with the county assessor before closing.
Climate risk First Street
- Flood 1/10 Low FEMA zone X (unshaded) · 0% chance over 30 yrs
- Wildfire 1/10 Low
- Heat 9/10 Extreme 5 d/yr ≥105°F today · 16 d/yr by 30 yrs out
- Wind 10/10 Extreme 99% chance of damaging wind over 30 yrs
- Air quality 2/10 Low 0 unhealthy d/yr today · 2 by 30 yrs out
Nearby sold comps map
Loading sold comps map…
Walkable amenities ~0.75 mi
Loading nearby amenities…
Taxation est. · year 1
- Rental income
- $18,451
- − Mortgage interest
- −$5,041
- − Property taxes
- −$1,601
- − Insurance
- −$450
- − Repairs & maintenance
- −$1,476
- − Management
- −$1,476
- − HOA
- −$5,424
- − Depreciation
- −$2,618
- Taxable income
- $364
- Est. tax owed @ 24.0%
- −$87
- After-tax cash flow
- $1,350/yr
For passive investors: Depreciation is non-cash, so a rental often shows a tax loss while cash-flowing — sheltering income. Rental losses are passive: they offset passive income freely, and up to $25,000/yr can offset ordinary (W-2) income if you actively participate and your MAGI is under $100k (phasing out to $0 by $150k); unused losses carry forward. On sale, claimed depreciation is recaptured at up to 25%, and gains may owe capital-gains tax (a 1031 exchange can defer both). Figures are a year-1 estimate at your 24.0% rate — not tax advice; consult a CPA.
Schools (NCES district)
- District
- Palm Beach
- NCES district ID
- 1201500
- Math proficiency
- 46% ▼ -16.00%
- Reading proficiency
- 53% ▼ -4.00%
- Median HH income
- $53,943
- Composite
- 42.72/100
- National rank
- #3160
- State rank
- #34 of 73 in FL
Livability — Greenacres
- Score
- 69/100
- State rank
- #490
- US rank
- #9008
Category grades
Schools grade is shown separately in the Schools card above.
Census & demographics
- County
- Palm Beach County · 1,438,312 people
- City population
- 65,478
- Metro
- Miami-Fort Lauderdale-Pompano Beach, FL
- Population (ZIP)
- 54,581
- Household income
- $61,274
- Rent vs Own
- Severe rent burden
- 2254.0
Population outlook (Palm Beach County) Hauer SSP2
- Today (2025)
- 1,637,487 people
- By 2030
- 1,743,255 · +6.5%
- By 2040
- 1,948,712 · +19.0%
- By 2050
- 2,132,979 · +30.3%
- By 2075
- 2,530,027 · +54.5%
- By 2100
- 2,706,979 · +65.3%
Race, ethnicity, and origin ACS 2023
- Neighborhood character
- Diverse neighborhood (Simpson 0.63)
- Race & ethnicity
- Hispanic / Latino 53% Two or more races 26% White 21% Black 21% Asian 2%
- Hispanic origin (detail)
- Mexican 7% Puerto Rican 6% Cuban 14% Dominican 2% Salvadoran 1%
- Common ancestry
- Hispanic 9% Romanian 1% Lithuanian 1%
- Foreign-born
- 44% · Canada, Jamaica, Dominican Republic
- Languages at home
- 40% English-only · Spanish 49% French/Haitian/Cajun 8% Other Indo-European 1%
Political lean MEDSL · Palm Beach
- 2024 margin
- Toss-up / Even · D 50.0% · R 49.2%
- 2008→2024 swing
- -22.1pp toward R · 2008: 22.9pp · 2024: 0.8pp
- All cycles
- 2024: D+0.8 2020: D+12.8 2016: D+15.3 2012: D+17.0 2008: D+22.9
Not yet ingested
- Civics
- —
Market trends
- HPI YoY
- ▼ -400.29%
- Current HPI
- 413.9695
- Rent YoY
- ▼ -1.64%
- Metro
- Miami-Fort Lauderdale-Pompano Beach, FL
- State GDP YoY
- ▲ 3.28%
- F500 in state
- 36
Industry mix (Fortune 500 HQ in FL)
| Industry | F500 HQs | Revenue |
|---|---|---|
| Industrial Technology | 2 | $29B |
|
||
| Insurance | 2 | $17B |
|
||
| Retail | 1 | $60B |
|
||
| Technology Distribution | 1 | $58B |
|
||
| Homebuilding | 1 | $35B |
|
||
| Technology Manufacturing | 1 | $35B |
|
||
Price history
+260.0% since first listed17 events — show timeline
- 2026-05-29 Listed $90,000 Beaches MLS
- 2025-04-23 Sold (Public Records) $92,000 Public Records
- 2024-12-12 Listing Removed — Beaches MLS
- 2024-11-11 Price Changed $99,895 Beaches MLS
- 2024-11-08 Price Changed $100,000 Beaches MLS
- 2024-10-25 Price Changed $109,895 Beaches MLS
- 2024-10-22 Price Changed $110,000 Beaches MLS
- 2024-09-24 Listed $112,900 Beaches MLS
- 2016-02-04 Sold (Public Records) $30,000 Public Records
- 2016-02-01 Sold (MLS) $30,000 Beaches MLS
- 2016-01-15 Pending — Beaches MLS
- 2016-01-06 Listed $39,000 Beaches MLS
- 2013-09-21 Listing Removed — Beaches MLS
- 2008-05-31 Listing Removed — Beaches MLS
- 2007-06-01 Listed $55,000 Beaches MLS
- 2007-02-06 Listed $79,999 Beaches MLS
- 2001-12-11 Sold (Public Records) $25,000 Public Records
Property tax history
+8.2%/yrLatest (2025): $1,601 · +258.8% YoY. Source: county tax records.
Cash-flow waterfall
monthlySold comps — $/sqft
last 12 mo · ≤1 miLoading sold comps…