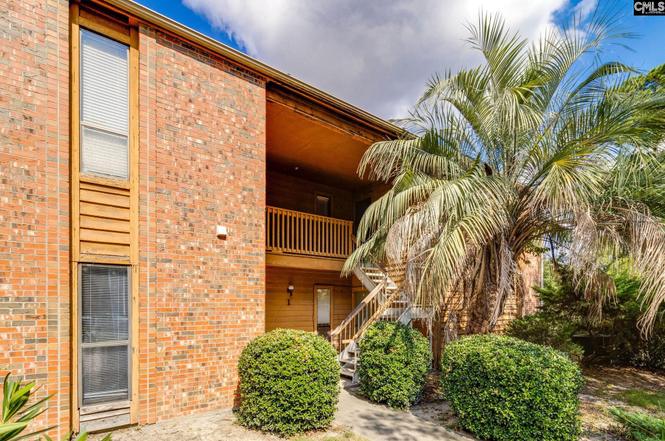
207 Weddell St Unit 1-H · Dentsville, SC
Flood risk 1/10 · Minimal
- FEMA flood zone
- X (unshaded)
- Chance of flooding over 30 yrs
- 0.0%
- Est. flood insurance / yr
- $507 – $1,088
Fire risk 3/10 · Minor
- Est. fire insurance / yr
- $783 – $1,453
Heat risk 7/10 · Major
- Hot days now (above 108°F)
- 7 days/yr
- Hot days in 30 yrs
- 16 days/yr
Wind risk 6/10 · Moderate
- Chance of severe wind over 30 yrs
- 64.0%
Air-quality risk 3/10 · Minor
- Unhealthy air days now
- 2 days/yr
- Unhealthy air days in 30 yrs
- 2 days/yr
Risk factors via First Street. Map © Google.
Why this score? — see what drove the D+ grade
The composite is a weighted blend of 9 inputs, each scored 0–100. Each bar is that input's sub-score; the figure is the points it added to the 100-point composite (weight × sub-score).
- Cash flow +13.5/30.0
- 1% rule +7.9/10.0
- ARV discount +7.5/15.0
- DSCR +4.1/10.0
- Schools +3.6/10.0
- Livability +3.6/5.0
- Rent growth +2.6/5.0
- Condition / age +2.5/5.0
- Appreciation +0.0/10.0
$97,000
🖨 Deal sheet 📄 Offer letter ✓ Due diligence
Listing remarks
Conveniently located 2BR/2BA condo just minutes from I-77, I-277, and I-20—perfect for commuters! This well maintained and recently remodeled unitfeatures LVP flooring throughout, spacious bedrooms with walk-in closets, and generous storage space. The living room offers a cozy wood-burningfireplace and opens to a private patio, ideal for year-round enjoyment. Updated kitchen with stainless steel appliances. Community amenities include arefreshing pool for summer relaxation. Close to shopping, dining, and schools—everything you need within minutes! This condo has new flooring, refrigerator and comes with washer and dryer. It features two bedrooms with walk-in closets and extra st
Key facts
- Community pool
- Private patio
- Updated kitchen
Tags
Property features AI
Finance
- HOA & community: Has association; Association covers common area maintenance and pool
Exterior
- Parking: 2 parking spaces
- Utilities: Public water; Public sewer
- Home design: Faces southeast
- Construction: Partial brick above foundation; Cedar exterior finish; Slab foundation
- Exterior features: Covered front porch; Additional covered porch; Inground vinyl pool; Pool fenced around pool
Interior
- Kitchen: Bar; Formica countertops; Laminate flooring; Painted cabinets; Dishwasher; Disposal; Refrigerator; Built-in range with smooth surface and self-cleaning
- Bedrooms: Master bedroom on main with private bath, walk-in closet, tub/shower, and luxury vinyl plank floors; Second bedroom on main with shared bath, walk-in closet, and luxury vinyl plank floors
- Flooring: Luxury vinyl plank flooring in bedrooms, formal living, dining, and great room; Laminate flooring in kitchen
- Bathrooms: Two full bathrooms (both on main level)
- Heating & cooling: Central air conditioning; Central electric heating
- Interior features: Smoke detector; Fireplace (wood burning)
- Laundry & utility: Laundry located in kitchen/utility room on main level
Neighborhood map
What this means for you Summary
Snapshot
- This is a 2-bed/2.0-bath condo listed at $97k.
Deal economics
- At list price, monthly cash flow is $4 ($44/yr) — positive.
- The deal already cash-flows at list — no discount required.
- Meets the 1% rule at list price ($1k rent vs $97k).
- Recommended offer: $85k (12.0% below list) — sets the bar for market timing.
Location & tenants
- Location reads 71/100 on livability (#50 in SC) — a middle-class / working-renter tenant base. Strengths: cost of living A+, health & safety A+, housing A; Watch: amenities D+, crime F, commute F.
- Richland 02 (suburban): math 35% / reading 47% proficiency, ranked #29 of 80 in SC (top 36%) — families likely to look elsewhere, expect single-tenant / working-renter base with shorter leases.
- Zoned schools: Joseph Keels Elementary (math 27% / reading 26%, grade F, #435 of 597 statewide, top 73%, 438 students, 100% FRL); Westwood High (math 47% / reading 87%, grade B, #73 of 196 statewide, top 41%, 1,684 students, 66% FRL) — zoned schools average 83% FRL vs 38% district-wide (45 pts higher); higher-poverty schools than district average — tighter screening recommended.
- Market conditions: Rents flat; 341 active listings in the ZIP; 14 comparable units currently listed for rent nearby; rentals leasing fast (median 11d on market — plan ~1-2 weeks tenant-placement turnaround); 3,472 units permitted in Richland County in 2024 (1,096 in 5+ unit buildings).
Forward outlook
- Local home prices are declining (-3.0%/yr); year-one equity from $671 of loan paydown is wiped out by about $3k of value loss. Plan a longer hold.
- Richland County population projected at +30% by 2050 — long-run rental-demand tailwind backs the buy-and-hold thesis.
Negotiation context
- It's been on market 230 days — a 12% lower offer ($85k) is reasonable based on typical stale-listing flexibility.
- 3 sale attempts since 5y ago; this cycle's ask has dropped $12k (11%) from the opening price — seller is motivated, your offer sets the floor, not the list.
- Current owner paid $58k; list at $97k implies a 69% gain — meaningful room to come down on a strong offer.
Risks & watch-outs
- Watch-outs: HOA is 22% of rent.
- Climate carrying-cost: major wind risk, 64% chance of damaging wind over 30y; extreme-heat days projected 7→16/yr by 2055 (HVAC capex compounding) — expect insurance premiums to compound above CPI over the hold.
Questions for the listing agent
- It's been on market 230 days. Have you received any prior offers? Is the seller open to a 12% concession, seller financing, or rate buy-down credit?
- What does the HOA fee cover, when was the last increase, and are there any pending special assessments or reserve-fund shortfalls?
- Any open or pending special assessments — roof, HVAC, plumbing, elevator, façade? What's the per-unit balance and payoff schedule, and is the seller paying it off at close or rolling it to the buyer?
- Why hasn't it sold? Are there any deal-killer items the seller is aware of (foundation, flood, title, zoning, code violations)?
- Is there a deadline driving the sale (1031 exchange, divorce, estate, relocation)? That informs how much negotiation room exists.
- Schools are D-rated, which usually means shorter tenancies and higher turnover. Who's the typical renter profile here, and what's been the actual vacancy rate?
- Crime grade is F in this area — have there been break-ins, vandalism, or insurance claims at this property in the last 3 years? What carrier currently insures it and at what premium?
- The area grade is low — what's the realistic commute time and amenity access for the typical tenant pool here? Any planned neighborhood developments (good or bad) we should know about?
- What's the average days-on-market for RENTAL listings here right now (not sales)? A rising rental-DOM trend means longer vacancies and softer asking-rent achievability than the comps imply.
- What's the recent tenant-quality profile in this submarket — average credit score on applications, eviction rate, late-payment / NSF rate, and stable-employment percentage? A property-management company in the area should have these aggregated.
- How much new apartment / multifamily construction is in the pipeline within 1–3 miles? Heavy new supply (>2% of stock underway) typically softens rents 12–24 months out; light construction supports rent growth.
Investment metrics
- 1% rule
- 1.29% ✓
- Cap rate
- 6.34%
- Cash-on-cash
- 0.16%
- DSCR
- 1.01
- GRM
- 6.4
CMA / ARV
No comps found within radius.
Projected returns pro-forma
-3.0% appreciation · 0.21% rent growth · sell at horizon
- IRR
- -20.5%
- Equity multiple
- 0.31×
- Total profit
- $-18,698
- Equity at exit
- $14,463
- IRR
- -27.2%
- Equity multiple
- -0.05×
- Total profit
- $-28,407
- Equity at exit
- $8,387
Cash invested: $27,160 (down + closing). Projections, not guarantees.
Landlord ↔ Tenant lean methodology
- Overall (STATE)
- 90 Strongly Landlord-Friendly
- State South Carolina
- 90 Strongly Landlord-Friendly · R+6
- County
- — inherits STATE
- City
- — inherits STATE
ZIP-level market 29223
- Rents YoY
- 0.2%
- Active inventory
- 341
- Price-to-rent
- 6.4×
Monthly cashflow live
- Estimated rent
- $1,254 high interval (Pro) →
- Mortgage (P&I)
- −$509
- Tax from tax record
- −$168 /mo · $2,016/yr
- Insurance
- −$40
- HOA est. from 1 same-building comp
- −$270
- Vacancy / Maint / Mgmt
- −$263
- Net cashflow
- $4
Break-even live
UW: 25.0% down · 7.5% · 30yr · 1.5% tax · 5.0% vac · 8.0% maint · 8.0% mgmt
Financing live
Cash to close
- Down payment
- $24,250
- Closing costs
- $2,910
- Reserves months
- —
- Total cash needed
- —
Loan-product check · same deal, 3 products live
Conventional
25% down · 7.5% · 30yr
- Down + closing
- —
- Monthly P&I
- —
- Monthly cashflow
- —
- DSCR
- —
- Eligible?
- —
Personal DTI + credit; lowest rate.
DSCR
20% down · 8.5% · 30yr
- Down + closing
- —
- Monthly P&I
- —
- Monthly cashflow
- —
- DSCR
- —
- Eligible?
- —
No personal income docs; deal must DSCR.
Hard money
10% down · 12.0% · 12mo
- Down + closing
- —
- Monthly P&I
- —
- Monthly cashflow
- —
- DSCR
- —
- Eligible?
- —
Short-term bridge; refi at stabilization.
Rent comps 14 comps
| Address | Beds | Baths | Sqft | Rent | $/sqft | DOM | Units | Dist |
|---|---|---|---|---|---|---|---|---|
| 8100 Bayfield Rd Columbia, SC | 3.0 | 1.0–2.0 | 773 | $1,209 | $1.56 | 23d | 1 | 0.27mi |
| 1728 Springwoods Lake Dr Columbia, SC | 2.0 | 1.5 | 1025 | $1,200 | $1.17 | 3d | 1 | 0.63mi |
| 1682 Horseshoe Dr Unit D Columbia, SC | 2.0 | 2.0 | 1000 | $895 | $0.90 | 14d | 1 | 0.67mi |
| 1718 Horseshoe Dr Apt B Columbia, SC | 2.0 | 1.5 | 1050 | $1,300 | $1.24 | 11d | 1 | 0.74mi |
| 250 Springtree Dr Columbia, SC | 1.0–2.0 | 1.0 | 839 | $1,090 | $1.30 | 3d | 8 | 0.88mi |
| 2920 Chatsworth Rd Apt C Columbia, SC | 2.0 | 2.0 | 980 | $1,100 | $1.12 | 23d | 1 | 1.35mi |
| 2920 Chatsworth Rd Unit A Columbia, SC | 2.0 | 2.0 | 980 | $1,100 | $1.12 | 3d | 1 | 1.35mi |
| 2919 Chatsworth Rd Columbia, SC | 2.0 | 1.0 | 975 | $1,300 | $1.33 | 23d | 1 | 1.35mi |
| 350 Powell Rd Columbia, SC | 1.0–2.0 | 1.0–2.0 | 915 | $1,333 | $1.46 | 11d | 26 | 1.44mi |
| 1000 Windsor Shores Dr Columbia, SC | 1.0–3.0 | 1.0–2.0 | 1011 | $1,390 | $1.37 | 23d | 1 | 1.44mi |
| 1310 Oakcrest Dr Columbia, SC | 1.0–3.0 | 1.0–2.0 | 1110 | $1,598 | $1.44 | 3d | 27 | 1.46mi |
| 229 Windsor Point Rd Unit 3H Columbia, SC | 2.0 | 2.0 | 1000 | $1,243 | $1.24 | 23d | 1 | 1.47mi |
| 229 Windsor Point Rd Unit 3H Columbia, SC | 2.0 | 2.0 | 1000 | $1,243 | $1.24 | 2d | 1 | 1.47mi |
| 261 Business Park Blvd Columbia, SC | 1.0–3.0 | 1.0–2.0 | 1127 | $1,349 | $1.20 | 11d | 2 | 1.47mi |
HOA detail condo
- Monthly dues
- $0 · $0/yr
- Likely covers
- pool
- Assessments
- None detected in remarks — confirm with the listing agent.
Listing history 24 events
-
2026-06-18days on market $97,000 Active 230 DOM
-
2026-06-17days on market $97,000 Active 229 DOM
-
2026-06-16days on market $97,000 Active 228 DOM
-
2026-06-15days on market $97,000 Active 227 DOM
-
2026-06-14days on market $97,000 Active 225 DOM
-
2026-06-13days on market $97,000 Active 224 DOM
-
2026-06-10days on market $97,000 Active 222 DOM
-
2026-06-09days on market $97,000 Active 221 DOM
-
2026-06-08days on market $97,000 Active 220 DOM
-
2026-06-07days on market $97,000 Active 219 DOM
-
2026-06-05days on market $97,000 Active 216 DOM
-
2026-06-03days on market $97,000 Active 215 DOM
-
2026-06-03status $97,000 Active 214 DOM
-
2026-05-01status Pending
-
2026-04-09status Active
-
2026-04-01historical
-
2026-03-14price $97,000
-
2025-11-30price $99,000
-
2025-09-19$109,000 Active
-
2021-09-13soldstatus $57,500
-
2021-06-30historical
-
2021-05-22$65,000 Active
-
2008-04-01soldstatus $54,900
-
1994-10-14soldstatus $44,900
ⓘ Source: listings_history table (triggers on properties + properties_extension) + one-shot
backfill from property_details.listing_events for pre-trigger history.
Tax reassessment forecast SC · Resets to sale price
- Current annual tax
- $2,016 · $168/mo
- Projected year-2 tax
- $2,016 · $168/mo
- Expected delta
- $0/yr ($0/mo · -0.0%)
ⓘ Screening estimate from a state-policy table — verify with the county assessor before closing.
Climate risk First Street
- Flood 1/10 Low FEMA zone X (unshaded) · 0% chance over 30 yrs
- Wildfire 3/10 Moderate
- Heat 7/10 Severe 7 d/yr ≥108°F today · 16 d/yr by 30 yrs out
- Wind 6/10 Major 64% chance of damaging wind over 30 yrs
- Air quality 3/10 Moderate 2 unhealthy d/yr today · 2 by 30 yrs out
Nearby sold comps map
Loading sold comps map…
Walkable amenities ~0.75 mi
Loading nearby amenities…
Taxation est. · year 1
- Rental income
- $15,049
- − Mortgage interest
- −$5,434
- − Property taxes
- −$2,016
- − Insurance
- −$485
- − Repairs & maintenance
- −$1,204
- − Management
- −$1,204
- − HOA
- −$3,240
- − Depreciation
- −$2,822
- Taxable loss
- −$1,355
- Est. tax savings @ 24.0%
- +$325
- After-tax cash flow
- $369/yr
For passive investors: Depreciation is non-cash, so a rental often shows a tax loss while cash-flowing — sheltering income. Rental losses are passive: they offset passive income freely, and up to $25,000/yr can offset ordinary (W-2) income if you actively participate and your MAGI is under $100k (phasing out to $0 by $150k); unused losses carry forward. On sale, claimed depreciation is recaptured at up to 25%, and gains may owe capital-gains tax (a 1031 exchange can defer both). Figures are a year-1 estimate at your 24.0% rate — not tax advice; consult a CPA.
Schools (NCES district)
- District
- Richland 02
- NCES district ID
- 4503390
- Math proficiency
- 35% ▼ -15.00%
- Reading proficiency
- 47% ▼ -5.00%
- Median HH income
- $59,684
- Composite
- 36.2/100
- National rank
- #4730
- State rank
- #29 of 80 in SC
Livability — Dentsville
- Score
- 71/100
- State rank
- #50
- US rank
- #6940
Category grades
Schools grade is shown separately in the Schools card above.
Census & demographics
- Census place
- Dentsville, SC
- County
- Richland County · 389,530 people
- City population
- 52,835
- Metro
- Columbia, SC
- Population (ZIP)
- 53,074
- Household income
- $62,408
- Rent vs Own
- Severe rent burden
- 2857.0
Population outlook (Richland County) Hauer SSP2
- Today (2025)
- 459,667 people
- By 2030
- 487,524 · +6.1%
- By 2040
- 542,035 · +17.9%
- By 2050
- 595,371 · +29.5%
- By 2075
- 732,998 · +59.5%
- By 2100
- 820,415 · +78.5%
Race, ethnicity, and origin ACS 2023
- Neighborhood character
- Diverse neighborhood (Simpson 0.60)
- Race & ethnicity
- Black 57% White 23% Hispanic / Latino 11% Two or more races 6% Asian 4%
- Hispanic origin (detail)
- Mexican 5% Puerto Rican 2%
- Common ancestry
- Slovak 1% Serbian 1% Italian 1%
- Foreign-born
- 10% · Canada, South Korea
- Languages at home
- 86% English-only · Spanish 8% Other Indo-European 2% Korean 1%
Political lean MEDSL · Richland
- 2024 margin
- Solid D (+34.6) · D 66.4% · R 31.8% · Other 1.8%
- 2008→2024 swing
- +5.7pp toward D · 2008: 28.9pp · 2024: 34.6pp
- All cycles
- 2024: D+34.6 2020: D+38.3 2016: D+32.9 2012: D+33.3 2008: D+28.9
Not yet ingested
- Civics
- —
Market trends
- HPI YoY
- ▼ -135.96%
- Current HPI
- 195.3158
- Rent YoY
- ▲ 0.21%
- Metro
- Columbia, SC
- State GDP YoY
- ▲ 4.51%
- F500 in state
- 2
Industry mix (Fortune 500 HQ in SC)
| Industry | F500 HQs | Revenue |
|---|---|---|
| Packaging | 1 | $7B |
|
||
Price history
+116.0% since first listed11 events — show timeline
- 2026-05-01 Pending — Consolidated MLS
- 2026-04-09 Relisted — Consolidated MLS
- 2026-04-01 Delisted — Consolidated MLS
- 2026-03-14 Price Changed $97,000 Consolidated MLS
- 2025-11-30 Price Changed $99,000 Consolidated MLS
- 2025-09-19 Listed $109,000 Consolidated MLS
- 2021-09-13 Sold (Public Records) $57,500 Public Records
- 2021-06-30 Delisted — Consolidated MLS
- 2021-05-22 Listed $65,000 Consolidated MLS
- 2008-04-01 Sold (Public Records) $54,900 Public Records
- 1994-10-14 Sold (Public Records) $44,900 Public Records
Property tax history
+13.7%/yrLatest (2025): $2,016 · +2.1% YoY. Source: county tax records.
Cash-flow waterfall
monthlySold comps — $/sqft
last 12 mo · ≤1 miLoading sold comps…