74 Beaver Dr · Indian Mountain Lake, PA
Flood risk 1/10 · Minimal
- FEMA flood zone
- X (unshaded)
- Chance of flooding over 30 yrs
- 0.0%
- Est. flood insurance / yr
- $507 – $1,088
Fire risk 3/10 · Minor
- Est. fire insurance / yr
- $511 – $949
Heat risk 2/10 · Minimal
- Hot days now (above 91°F)
- 7 days/yr
- Hot days in 30 yrs
- 15 days/yr
Wind risk 4/10 · Minor
- Chance of severe wind over 30 yrs
- 9.0%
Air-quality risk 3/10 · Minor
- Unhealthy air days now
- 1 days/yr
- Unhealthy air days in 30 yrs
- 4 days/yr
Risk factors via First Street. Map © Google.
Why this score? — see what drove the C+ grade
The composite is a weighted blend of 9 inputs, each scored 0–100. Each bar is that input's sub-score; the figure is the points it added to the 100-point composite (weight × sub-score).
- Cash flow +20.8/30.0
- ARV discount +13.6/15.0
- DSCR +6.6/10.0
- 1% rule +5.9/10.0
- Appreciation +3.6/10.0
- Schools +3.1/10.0
- Livability +3.1/5.0
- Rent growth +2.5/5.0
- Condition / age +2.5/5.0
$150,000
🖨 Deal sheet 📄 Offer letter ✓ Due diligence
Listing remarks MLS
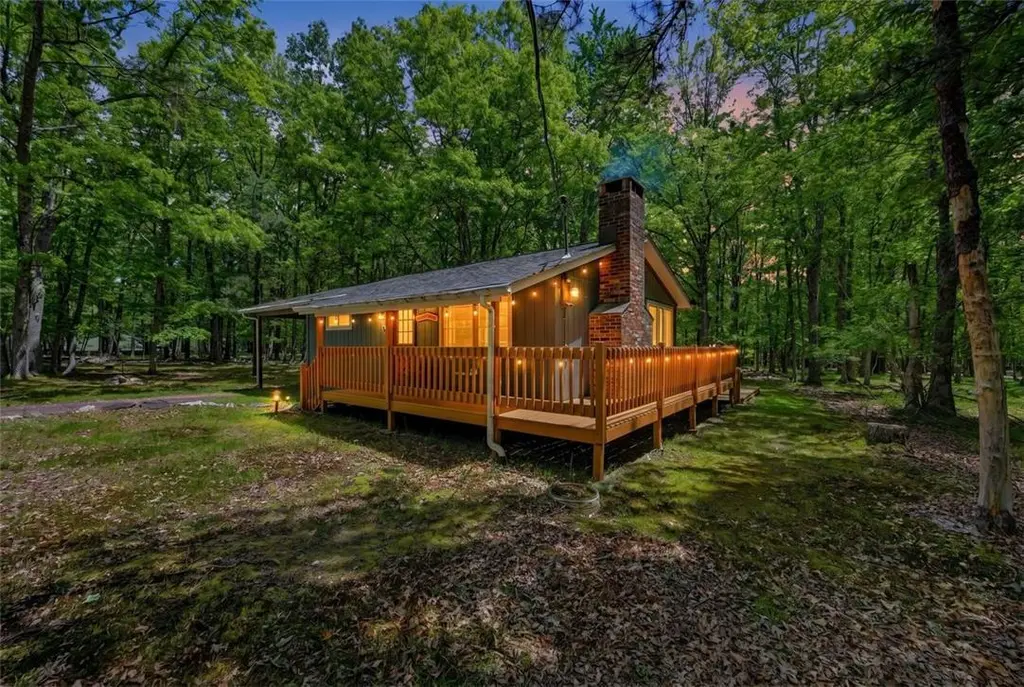
Affordable Pocono Cottage Retreat With Seasonal Lake Views! Tucked Away On Long Private Driveway And Adjoining 118 Acres Of Community Greenbelt, This Charming 2-Bedroom Cottage-Style Ranch Offers The Peaceful Pocono Setting Buyers Are Searching For. Enjoy Seasonal Lake Views, A Lake And Creek Directly Across The Street, And Access To One Of Five Community Lakes For Year-Round Recreation. The Property Features A Partial Wraparound Deck, Covered Front Entry, Rear Entertaining Patio, Spacious Carport, And Plenty Of Parking. Surrounded By Mature Trees And Nature, This Inviting Home Offers Privacy And A Relaxing Mountain Atmosphere. Inside, The Living Room Showcases A Floor-To-Ceiling Custom Stone Fireplace And Hearth, Creating The Perfect Gathering Space For All Seasons. The Bright Eat-In Kitchen Offers Backyard Views, Abundant Natural Light, And Convenient Deck Access For Easy Indoor-Outdoor Living. The Primary Bedroom Overlooks The Private Yard And Includes Built-In Shelving, While The Second Bedroom Enjoys Seasonal Lake Views. A Full Bathroom Features A Tiled Shower And Linen Closet For Added Convenience. Whether You're Looking For A Weekend Getaway, Full-Time Residence, Or Investment Opportunity, This Affordable Retreat Delivers Exceptional Value. Enjoy Access To Five Community Lakes, Boating, Fishing, A Community Playground, And The Best Of Pocono Lake Life. With A Newer Roof, Charming Cottage Appeal, And A Location That Combines Nature, Recreation, And Privacy, This Is The Pocono Escape You've Been Waiting For!
Key facts
- Seasonal lake views
- Spacious carport
- Covered front entry
Tags
Property features AI
Finance
- HOA & community: Annual association fee of $1,350
Exterior
- Parking: Attached garage; 1 garage space; Carport; Driveway; Off-street parking
- Security: Smoke detectors
- Utilities: 200+ amp electric service with circuit breakers; Well water; Septic tank
- Home design: One-story property; Has a view; Above-grade finished area: 616
- Construction: T1-11 siding; Asphalt/fiberglass roof
- Exterior features: Deck; Porch; Fire pit; Corner lot; Flat lot; Wooded views; Private paved road frontage
Interior
- Kitchen: Electric cooktop; Electric oven; Electric range; Refrigerator
- Bedrooms: Total rooms: 4
- Flooring: Laminate flooring; Resilient flooring
- Bathrooms: 1 full bathroom
- Heating & cooling: Baseboard heating; Electric heating; Wood stove
- Interior features: Eat-in kitchen; Traditional floorplan; Wired for data; Crawl space basement with exterior entry and sump pump; Wood-burning fireplace in the living room
- Laundry & utility: Electric water heater
Neighborhood map
What this means for you Summary
Snapshot
- This is a 2-bed/1.0-bath single-family listed at $150k.
Deal economics
- At list price, monthly cash flow is $206 ($2k/yr) — positive.
- The deal already cash-flows at list — no discount required.
- Meets the 1% rule at list price ($2k rent vs $150k).
- Cap rate 7.9% vs local median 4.7% in Indian Mountain Lake — top-decile yield for the area; either an underpriced asset or a hidden risk that comps aren't pricing in. Stress-test before assuming the spread holds.
Location & tenants
- Location reads 62/100 on livability (#1,349 in PA) — a middle-class / working-renter tenant base. Strengths: cost of living A+, housing A+, crime A; Watch: schools D, health & safety D, amenities F.
- Jim Thorpe Area SD (rural): math 25% / reading 47% proficiency, ranked #394 of 539 in PA (top 73%) — families likely to look elsewhere, expect single-tenant / working-renter base with shorter leases.
- Market conditions: 453 active listings in the ZIP; 180 units permitted in Carbon County in 2024 (10 in 5+ unit buildings).
Forward outlook
- Local home prices are declining (-2.9%/yr); year-one equity from $1k of loan paydown is wiped out by about $4k of value loss. Plan a longer hold.
- Carbon County population projected at -18% by 2050 — secular population decline; favor cash flow + early exit over multi-decade hold.
Negotiation context
- Only 5 days on market — expect competitive offers; lowballing is unlikely to land.
- 3 sale attempts since 11y ago with the ask held roughly flat each time — persistent listings suggest the price (not the market) is what's stuck; bring a comps-based counter.
- Current owner paid $49k; list at $150k implies a 207% gain — meaningful room to come down on a strong offer.
Questions for the listing agent
- Built in 1971 — when were the roof, HVAC, electrical panel, plumbing, and water heater last replaced?
- What does the HOA fee cover, when was the last increase, and are there any pending special assessments or reserve-fund shortfalls?
- Is there a deadline driving the sale (1031 exchange, divorce, estate, relocation)? That informs how much negotiation room exists.
- Schools are D-rated, which usually means shorter tenancies and higher turnover. Who's the typical renter profile here, and what's been the actual vacancy rate?
- What's the average days-on-market for RENTAL listings here right now (not sales)? A rising rental-DOM trend means longer vacancies and softer asking-rent achievability than the comps imply.
- What's the recent tenant-quality profile in this submarket — average credit score on applications, eviction rate, late-payment / NSF rate, and stable-employment percentage? A property-management company in the area should have these aggregated.
- How much new for-sale + rental construction is in the pipeline within 1–3 miles? Heavy new supply typically softens prices + rents 12–24 months out; constrained supply supports both.
Investment metrics
- 1% rule
- 1.09% ✓
- Cap rate
- 7.94%
- Cash-on-cash
- 5.88%
- DSCR
- 1.26
- GRM
- 7.7
CMA / ARV
- ARV (on-the-fly)
- $173,712
- Comps found
- 3
Show comp detail 3 sales within ~0.75 mi
| Address | Dist | Beds/Ba | Sqft | Sold | Price | $/sf | Match |
|---|---|---|---|---|---|---|---|
| 59 Vista Dr | 0.49mi | 2/1.0 | 600 (-3%) | 6mo | $150,000 | $250 | 68 |
| 21 Beaver Dr | 0.26mi | 2/1.0 | 687 (+12%) | 12mo | $208,400 | $303 | 59 |
| 86 Shortridge Rd | 0.52mi | 2/1.0 | 600 (-3%) | 23mo | $169,000 | $282 | 52 |
Match score weights: distance 35% · size 25% · config 20% · recency 20%. Top-matched comps best support the ARV.
Projected returns pro-forma
-2.89% appreciation · 3.0% rent growth · sell at horizon
- IRR
- -6.6%
- Equity multiple
- 0.75×
- Total profit
- $-10,438
- Equity at exit
- $23,122
- IRR
- 2.8%
- Equity multiple
- 1.20×
- Total profit
- $8,604
- Equity at exit
- $14,272
Cash invested: $42,000 (down + closing). Projections, not guarantees.
Landlord ↔ Tenant lean methodology
- Overall (STATE)
- 62 Landlord-Friendly
- State Pennsylvania
- 62 Landlord-Friendly · EVEN
- County
- — inherits STATE
- City
- — inherits STATE
ZIP-level market 18210
- Home prices YoY
- -1.4%
- Active inventory
- 453
- Price-to-rent
- 7.7×
Monthly cashflow live
- Estimated rent
- $1,630 medium interval (Pro) →
- Mortgage (P&I)
- −$787
- Tax from tax record
- −$120 /mo · $1,436/yr
- Insurance
- −$62
- HOA
- −$113
- Vacancy / Maint / Mgmt
- −$342
- Net cashflow
- $206
Break-even live
UW: 25.0% down · 7.5% · 30yr · 1.5% tax · 5.0% vac · 8.0% maint · 8.0% mgmt
Financing live
Cash to close
- Down payment
- $37,500
- Closing costs
- $4,500
- Reserves months
- —
- Total cash needed
- —
Loan-product check · same deal, 3 products live
Conventional
25% down · 7.5% · 30yr
- Down + closing
- —
- Monthly P&I
- —
- Monthly cashflow
- —
- DSCR
- —
- Eligible?
- —
Personal DTI + credit; lowest rate.
DSCR
20% down · 8.5% · 30yr
- Down + closing
- —
- Monthly P&I
- —
- Monthly cashflow
- —
- DSCR
- —
- Eligible?
- —
No personal income docs; deal must DSCR.
Hard money
10% down · 12.0% · 12mo
- Down + closing
- —
- Monthly P&I
- —
- Monthly cashflow
- —
- DSCR
- —
- Eligible?
- —
Short-term bridge; refi at stabilization.
HOA detail
- Monthly dues
- $113 · $1,356/yr
Listing history 6 events
-
2026-06-14statusdays on market $150,000 Pending 5 DOM
-
2026-06-10days on market $150,000 Active 4 DOM
-
2026-06-09days on market $150,000 Active 3 DOM
-
2026-06-08days on market $150,000 Active 2 DOM
-
2026-06-07remarks 699-char remark
-
2026-06-07$150,000 Active 1 DOM
ⓘ Source: listings_history table (triggers on properties + properties_extension) + one-shot
backfill from property_details.listing_events for pre-trigger history.
Tax reassessment forecast PA · Partial reset (capped growth)
- Current annual tax
- $1,436 · $120/mo
- Projected year-2 tax
- $1,903 · $159/mo
- Expected delta
- +$467/yr (+$39/mo · 32.5%)
ⓘ Screening estimate from a state-policy table — verify with the county assessor before closing.
Climate risk First Street
- Flood 1/10 Low FEMA zone X (unshaded) · 0% chance over 30 yrs
- Wildfire 3/10 Moderate
- Heat 2/10 Low 7 d/yr ≥91°F today · 15 d/yr by 30 yrs out
- Wind 4/10 Moderate 9% chance of damaging wind over 30 yrs
- Air quality 3/10 Moderate 1 unhealthy d/yr today · 4 by 30 yrs out
Nearby sold comps map
Loading sold comps map…
Walkable amenities ~0.75 mi
Loading nearby amenities…
Taxation est. · year 1
- Rental income
- $19,558
- − Mortgage interest
- −$8,402
- − Property taxes
- −$1,436
- − Insurance
- −$750
- − Repairs & maintenance
- −$1,565
- − Management
- −$1,565
- − HOA
- −$1,356
- − Depreciation
- −$4,364
- Taxable income
- $121
- Est. tax owed @ 24.0%
- −$29
- After-tax cash flow
- $2,440/yr
For passive investors: Depreciation is non-cash, so a rental often shows a tax loss while cash-flowing — sheltering income. Rental losses are passive: they offset passive income freely, and up to $25,000/yr can offset ordinary (W-2) income if you actively participate and your MAGI is under $100k (phasing out to $0 by $150k); unused losses carry forward. On sale, claimed depreciation is recaptured at up to 25%, and gains may owe capital-gains tax (a 1031 exchange can defer both). Figures are a year-1 estimate at your 24.0% rate — not tax advice; consult a CPA.
Schools (NCES district)
- District
- Jim Thorpe Area SD
- NCES district ID
- 4212540
- Math proficiency
- 25% ▼ -12.00%
- Reading proficiency
- 47% ▼ -11.00%
- Median HH income
- $53,476
- Composite
- 31.42/100
- National rank
- #5988
- State rank
- #394 of 539 in PA
Livability — Indian Mountain Lake
- Score
- 62/100
- State rank
- #1349
- US rank
- #16713
Category grades
Schools grade is shown separately in the Schools card above.
Census & demographics
- Census place
- Indian Mountain Lake, PA
- Population (ZIP)
- 7,879
Population outlook (Carbon County) Hauer SSP2
- Today (2025)
- 61,643 people
- By 2030
- 59,840 · -2.9%
- By 2040
- 55,413 · -10.1%
- By 2050
- 50,843 · -17.5%
- By 2075
- 43,326 · -29.7%
- By 2100
- 37,126 · -39.8%
Race, ethnicity, and origin ACS 2023
- Neighborhood character
- Predominantly White (69%)
- Race & ethnicity
- White 69% Hispanic / Latino 22% Two or more races 11% Black 6% Native American 1% Asian 1%
- Hispanic origin (detail)
- Puerto Rican 12% Cuban 2% Dominican 1%
- Common ancestry
- Romanian 8% Russian 4% Iranian 2%
- Foreign-born
- 12% · Canada
- Languages at home
- 81% English-only · Spanish 10% Russian/Polish/Slavic 7% Other Indo-European 1%
Political lean MEDSL · Carbon
- 2024 margin
- Solid R (+34.8) · D 32.2% · R 67.0%
- 2008→2024 swing
- -36.7pp toward R · 2008: 1.9pp · 2024: -34.8pp
- All cycles
- 2024: R+34.8 2020: R+32.0 2016: R+34.1 2012: R+6.9 2008: D+1.9
Not yet ingested
- Civics
- —
Market trends
- HPI YoY
- ▼ -2.89%
- Current HPI
- 203.8099
- Rent YoY
- —
- Metro
- —
- State GDP YoY
- ▲ 1.68%
- F500 in state
- 34
Industry mix (Fortune 500 HQ in PA)
| Industry | F500 HQs | Revenue |
|---|---|---|
| Healthcare | 2 | $309B |
|
||
| Insurance | 2 | $27B |
|
||
| Telecommunications / Media | 1 | $124B |
|
||
| Industrial Distribution | 1 | $22B |
|
||
| Financial Services | 1 | $20B |
|
||
| Chemicals / Materials | 1 | $18B |
|
||
Price history
+150.4% since first listed5 events — show timeline
- 2026-06-06 Listed $150,000 GLVRMLS
- 2026-06-04 Listed $150,000 PMAR
- 2015-12-29 Sold (Public Records) $48,900 Public Records
- 2015-11-25 Sold (MLS) $48,900 PMAR
- 2015-06-25 Listed $59,900 PMAR
Property tax history
+1.7%/yrLatest (2026): $1,436 · +5.4% YoY. Source: county tax records.
Cash-flow waterfall
monthlySold comps — $/sqft
last 12 mo · ≤1 miLoading sold comps…