None · Brandon, FL
Flood risk 1/10 · Minimal
- FEMA flood zone
- X (unshaded)
- Chance of flooding over 30 yrs
- 0.0%
- Est. flood insurance / yr
- $507 – $1,088
Fire risk 1/10 · Minimal
- Est. fire insurance / yr
- $947 – $1,759
Heat risk 10/10 · Severe
- Hot days now (above 110°F)
- 7 days/yr
- Hot days in 30 yrs
- 25 days/yr
Wind risk 9/10 · Severe
- Chance of severe wind over 30 yrs
- 99.0%
Air-quality risk 4/10 · Minor
- Unhealthy air days now
- 4 days/yr
- Unhealthy air days in 30 yrs
- 4 days/yr
Risk factors via First Street. Map © Google.
Why this score? — see what drove the C- grade
The composite is a weighted blend of 9 inputs, each scored 0–100. Each bar is that input's sub-score; the figure is the points it added to the 100-point composite (weight × sub-score).
- Cash flow +18.3/30.0
- 1% rule +10.0/10.0
- ARV discount +7.5/15.0
- DSCR +5.7/10.0
- Schools +4.2/10.0
- Livability +4.2/5.0
- Condition / age +2.5/5.0
- Rent growth +2.2/5.0
- Appreciation +0.0/10.0
$125,000
🖨 Deal sheet 📄 Offer letter ✓ Due diligence
Listing remarks MLS
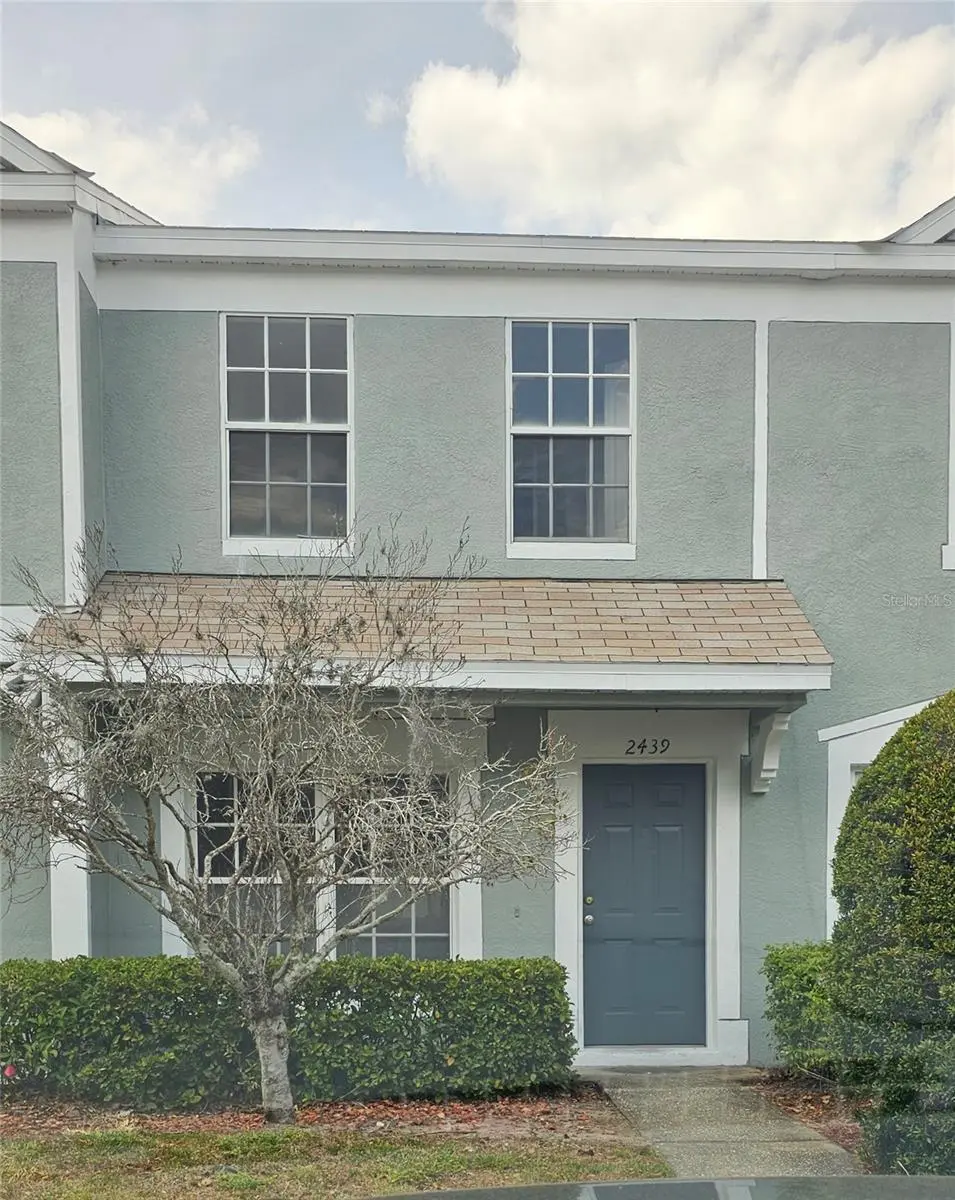
Great townhouse in a gated community that's convenient to everything! What more could you ask for?Don't miss out on this great opportunity! Bank of America, N. A. employees and employees' household members of the Bank are prohibited from purchase, whether directly or indirectly. The Grantee(s), or purchaser(s), of the Property may not re-sell, record an additional conveyance document, or otherwise transfer title to the Property within 60 days following the Grantor's execution of this Deed.
Key facts
- $529 HOA
- Community pool
- Built 2001
Property features AI
Finance
- Other: Property type: Residential townhouse; Zoning: PD; Lot size approximately 0.02 acres
- Financial info: Total annual fees approximately $6,348; No lease restrictions indicated
- HOA & community: HOA managed by Neighborly Community Management; Monthly HOA fee $529 (includes cable TV, pool, internet, structure maintenance, and grounds maintenance); Deed restrictions; Pets allowed
Exterior
- Parking: No parking details provided
- Security: No security features specified
- Utilities: Public water; Public sewer; Cable connected; Electricity connected
- Home design: Residential townhouse; Two levels; South-facing; Planned unit development
- Construction: Block and stucco construction; Shingle roof; Slab foundation; Building area about 1,245 sq ft
- Exterior features: Exterior lighting; Irrigation equipment
Interior
- Kitchen: No appliances included
- Bedrooms: 2 bedrooms
- Flooring: Carpet; Tile
- Bathrooms: 2 full bathrooms; 1 half bathroom
- Heating & cooling: Central heating (electric); Central air conditioning
- Interior features: No interior features specified
- Laundry & utility: Laundry located in kitchen
Neighborhood map
What this means for you Summary
Snapshot
- This is a 2-bed/3.0-bath townhouse listed at $125k.
Deal economics
- At list price, monthly cash flow is $113 ($1k/yr) — positive.
- The deal already cash-flows at list — no discount required.
- Meets the 1% rule at list price ($2k rent vs $125k).
Location & tenants
- Location reads 85/100 on livability (#26 in FL, #507 nationally) — a professional / high-income tenant draw. Strengths: amenities A+, housing A+, health & safety A+.
- Hillsborough (suburban): math 47% / reading 50% proficiency, ranked #41 of 73 in FL (top 56%) — families likely to look elsewhere, expect single-tenant / working-renter base with shorter leases.
- Market conditions: Rents soft (-1.2%/yr); 313 active listings in the ZIP; 11 comparable units currently listed for rent nearby; rentals leasing fast (median 3d on market — plan ~1-2 weeks tenant-placement turnaround); solid renter incomes; 9,053 units permitted in Hillsborough County in 2024 (4,555 in 5+ unit buildings).
Forward outlook
- Local home prices are declining (-3.0%/yr); year-one equity from $864 of loan paydown is wiped out by about $4k of value loss. Plan a longer hold.
- Hillsborough County population projected at +37% by 2050 — long-run rental-demand tailwind backs the buy-and-hold thesis.
Negotiation context
- Only 1 days on market — expect competitive offers; lowballing is unlikely to land.
- 5 sale attempts since 21y ago with the ask held roughly flat each time — persistent listings suggest the price (not the market) is what's stuck; bring a comps-based counter.
- Current owner paid $56k; list at $125k implies a 123% gain — meaningful room to come down on a strong offer.
Risks & watch-outs
- Watch-outs: HOA is 26% of rent.
- Climate carrying-cost: severe wind risk, 99% chance of damaging wind over 30y; extreme-heat days projected 7→25/yr by 2055 (HVAC capex compounding) — expect insurance premiums to compound above CPI over the hold.
Questions for the listing agent
- What does the HOA fee cover, when was the last increase, and are there any pending special assessments or reserve-fund shortfalls?
- Is there a deadline driving the sale (1031 exchange, divorce, estate, relocation)? That informs how much negotiation room exists.
- What's the average days-on-market for RENTAL listings here right now (not sales)? A rising rental-DOM trend means longer vacancies and softer asking-rent achievability than the comps imply.
- What's the recent tenant-quality profile in this submarket — average credit score on applications, eviction rate, late-payment / NSF rate, and stable-employment percentage? A property-management company in the area should have these aggregated.
- How much new for-sale + rental construction is in the pipeline within 1–3 miles? Heavy new supply typically softens prices + rents 12–24 months out; constrained supply supports both.
Investment metrics
- 1% rule
- 1.60% ✓
- Cap rate
- 7.38%
- Cash-on-cash
- 3.89%
- DSCR
- 1.17
- GRM
- 5.2
CMA / ARV
No comps found within radius.
Projected returns pro-forma
-3.0% appreciation · 0.0% rent growth · sell at horizon
- IRR
- -15.5%
- Equity multiple
- 0.47×
- Total profit
- $-18,500
- Equity at exit
- $18,638
- IRR
- -19.3%
- Equity multiple
- 0.20×
- Total profit
- $-27,862
- Equity at exit
- $10,808
Cash invested: $35,000 (down + closing). Projections, not guarantees.
Landlord ↔ Tenant lean methodology
- Overall (STATE)
- 87 Strongly Landlord-Friendly
- State Florida
- 87 Strongly Landlord-Friendly · R+3
- County
- — inherits STATE
- City
- — inherits STATE
ZIP-level market 33511
- Rents YoY
- -1.2%
- Active inventory
- 313
- Price-to-rent
- 5.2×
Monthly cashflow live
- Estimated rent
- $2,003 high interval (Pro) →
- Mortgage (P&I)
- −$656
- Tax from tax record
- −$233 /mo · $2,791/yr
- Insurance
- −$52
- HOA
- −$529
- Vacancy / Maint / Mgmt
- −$421
- Net cashflow
- $113
Break-even live
UW: 25.0% down · 7.5% · 30yr · 1.5% tax · 5.0% vac · 8.0% maint · 8.0% mgmt
Financing live
Cash to close
- Down payment
- $31,250
- Closing costs
- $3,750
- Reserves months
- —
- Total cash needed
- —
Loan-product check · same deal, 3 products live
Conventional
25% down · 7.5% · 30yr
- Down + closing
- —
- Monthly P&I
- —
- Monthly cashflow
- —
- DSCR
- —
- Eligible?
- —
Personal DTI + credit; lowest rate.
DSCR
20% down · 8.5% · 30yr
- Down + closing
- —
- Monthly P&I
- —
- Monthly cashflow
- —
- DSCR
- —
- Eligible?
- —
No personal income docs; deal must DSCR.
Hard money
10% down · 12.0% · 12mo
- Down + closing
- —
- Monthly P&I
- —
- Monthly cashflow
- —
- DSCR
- —
- Eligible?
- —
Short-term bridge; refi at stabilization.
Rent comps 11 comps
| Address | Beds | Baths | Sqft | Rent | $/sqft | DOM | Units | Dist |
|---|---|---|---|---|---|---|---|---|
| 1008 York Ct Brandon, FL | 3.0 | 2.0 | 1296 | $2,400 | $1.85 | 17d | 1 | 0.36mi |
| 107 Karde Ln Apt E Brandon, FL | 2.0 | 1.0 | 750 | $1,495 | $1.99 | 4d | 1 | 0.84mi |
| 1701 Lake Chapman Dr Brandon, FL | 1.0–2.0 | 1.0–2.0 | 800 | $1,777 | $2.22 | 2d | 32 | 0.86mi |
| 2617 Chelsea Manor Blvd Brandon, FL | 2.0 | 1.5 | 1211 | $1,795 | $1.48 | 24d | 1 | 1.02mi |
| 10215 Estuary Lakes Dr Unit 220 Tampa, FL | 2.0 | 2.0 | 1098 | $2,472 | $2.25 | 24d | 1 | 1.13mi |
| 1428 Highland Ridge Cir Brandon, FL | 2.0 | 2.5 | 1190 | $1,500 | $1.26 | 1d | 1 | 1.18mi |
| 10151 Iris Crosstown Dr Tampa, FL | 1.0–3.0 | 1.0–2.0 | 1032 | $1,910 | $1.85 | 3d | 78 | 1.18mi |
| 10221 Estuary Lakes Dr Tampa, FL | 2.0 | 1.0–2.0 | 993 | $2,945 | $2.97 | 2d | 42 | 1.19mi |
| 1918 Plantation Key Cir Brandon, FL | 1.0–3.0 | 1.0–2.0 | 915 | $1,600 | $1.75 | 1d | 60 | 1.28mi |
| 2136 Lennox Dale Ln Unit Main Brandon, FL | 3.0 | 2.0 | 1470 | $2,250 | $1.53 | 17d | 1 | 1.37mi |
| 10011 Balaye Run Dr Tampa, FL | 1.0–3.0 | 1.0–2.0 | 1112 | $1,732 | $1.56 | 1d | 49 | 1.41mi |
HOA detail
- Monthly dues
- $529 · $6,348/yr
- Likely covers
- security
Listing history 10 events
-
2026-05-06status Pending
-
2026-05-05$125,000 Active
-
2012-05-30soldstatus $56,000 494-char remark
Show marketing remark (494 chars)
Great townhouse in a gated community that's convenient to everything! What more could you ask for?Don't miss out on this great opportunity! Bank of America, N. A. employees and employees' household members of the Bank are prohibited from purchase, whether directly or indirectly. The Grantee(s), or purchaser(s), of the Property may not re-sell, record an additional conveyance document, or otherwise transfer title to the Property within 60 days following the Grantor's execution of this Deed.
-
2012-04-03$53,900 494-char remark
Show marketing remark (494 chars)
Great townhouse in a gated community that's convenient to everything! What more could you ask for?Don't miss out on this great opportunity! Bank of America, N. A. employees and employees' household members of the Bank are prohibited from purchase, whether directly or indirectly. The Grantee(s), or purchaser(s), of the Property may not re-sell, record an additional conveyance document, or otherwise transfer title to the Property within 60 days following the Grantor's execution of this Deed.
-
2009-07-16historical
-
2009-04-13$77,000
-
2007-03-05$164,900
-
2005-10-12soldstatus $164,000
-
2005-10-07soldstatus $164,000
-
2005-08-09$166,900
ⓘ Source: listings_history table (triggers on properties + properties_extension) + one-shot
backfill from property_details.listing_events for pre-trigger history.
Tax reassessment forecast FL · Resets to sale price
- Current annual tax
- $2,791 · $233/mo
- Projected year-2 tax
- $2,791 · $233/mo
- Expected delta
- $0/yr ($0/mo · 0.0%)
ⓘ Screening estimate from a state-policy table — verify with the county assessor before closing.
Climate risk First Street
- Flood 1/10 Low FEMA zone X (unshaded) · 0% chance over 30 yrs
- Wildfire 1/10 Low
- Heat 10/10 Extreme 7 d/yr ≥110°F today · 25 d/yr by 30 yrs out
- Wind 9/10 Extreme 99% chance of damaging wind over 30 yrs
- Air quality 4/10 Moderate 4 unhealthy d/yr today · 4 by 30 yrs out
Nearby sold comps map
Loading sold comps map…
Walkable amenities ~0.75 mi
Loading nearby amenities…
Taxation est. · year 1
- Rental income
- $24,040
- − Mortgage interest
- −$7,002
- − Property taxes
- −$2,791
- − Insurance
- −$625
- − Repairs & maintenance
- −$1,923
- − Management
- −$1,923
- − HOA
- −$6,348
- − Depreciation
- −$3,636
- Taxable loss
- −$209
- Est. tax savings @ 24.0%
- +$50
- After-tax cash flow
- $1,411/yr
For passive investors: Depreciation is non-cash, so a rental often shows a tax loss while cash-flowing — sheltering income. Rental losses are passive: they offset passive income freely, and up to $25,000/yr can offset ordinary (W-2) income if you actively participate and your MAGI is under $100k (phasing out to $0 by $150k); unused losses carry forward. On sale, claimed depreciation is recaptured at up to 25%, and gains may owe capital-gains tax (a 1031 exchange can defer both). Figures are a year-1 estimate at your 24.0% rate — not tax advice; consult a CPA.
Schools (NCES district)
- District
- Hillsborough
- NCES district ID
- 1200870
- Math proficiency
- 47% ▼ -8.00%
- Reading proficiency
- 50% ▼ -4.00%
- Median HH income
- $50,622
- Composite
- 41.6/100
- National rank
- #3435
- State rank
- #41 of 73 in FL
Livability — Brandon
- Score
- 85/100
- State rank
- #26
- US rank
- #507
Category grades
Schools grade is shown separately in the Schools card above.
Census & demographics
- Census place
- Brandon, FL
- County
- Hillsborough County · 1,540,968 people
- City population
- 92,716
- Metro
- Tampa-St. Petersburg-Clearwater, FL
- Population (ZIP)
- 62,138
- Household income
- $81,301
- Rent vs Own
- Severe rent burden
- 3073.0
Population outlook (Hillsborough County) Hauer SSP2
- Today (2025)
- 1,607,022 people
- By 2030
- 1,733,968 · +7.9%
- By 2040
- 1,979,565 · +23.2%
- By 2050
- 2,203,427 · +37.1%
- By 2075
- 2,667,893 · +66.0%
- By 2100
- 2,891,558 · +79.9%
Race, ethnicity, and origin ACS 2023
- Neighborhood character
- Diverse neighborhood (Simpson 0.68)
- Race & ethnicity
- White 45% Hispanic / Latino 30% Two or more races 18% Black 15% Asian 4%
- Hispanic origin (detail)
- Mexican 3% Puerto Rican 10% Cuban 6% Dominican 2%
- Common ancestry
- Romanian 2% Lithuanian 2% Slovak 2%
- Foreign-born
- 18% · Canada, Jamaica
- Languages at home
- 72% English-only · Spanish 22% Other Indo-European 2% Other Asian/Pacific 1%
Political lean MEDSL · Hillsborough
- 2024 margin
- Toss-up / Even · D 47.8% · R 50.9% · Other 1.3%
- 2008→2024 swing
- -10.2pp toward R · 2008: 7.1pp · 2024: -3.1pp
- All cycles
- 2024: R+3.1 2020: D+6.9 2016: D+6.8 2012: D+6.7 2008: D+7.1
Not yet ingested
- Civics
- —
Market trends
- HPI YoY
- ▼ -279.49%
- Current HPI
- 333.4744
- Rent YoY
- ▼ -1.17%
- Metro
- Tampa-St. Petersburg-Clearwater, FL
- State GDP YoY
- ▲ 3.28%
- F500 in state
- 36
Industry mix (Fortune 500 HQ in FL)
| Industry | F500 HQs | Revenue |
|---|---|---|
| Industrial Technology | 2 | $29B |
|
||
| Insurance | 2 | $17B |
|
||
| Retail | 1 | $60B |
|
||
| Technology Distribution | 1 | $58B |
|
||
| Homebuilding | 1 | $35B |
|
||
| Technology Manufacturing | 1 | $35B |
|
||
Price history
-25.1% since first listed10 events — show timeline
- 2026-05-06 Pending — Stellar MLS as Distributed by MLS Grid
- 2026-05-05 Listed $125,000 Stellar MLS as Distributed by MLS Grid
- 2012-05-30 Sold (MLS) $56,000 Stellar MLS as Distributed by MLS Grid
- 2012-04-03 Listed $53,900 Stellar MLS as Distributed by MLS Grid
- 2009-07-16 Listing Removed — Stellar MLS as Distributed by MLS Grid
- 2009-04-13 Listed $77,000 Stellar MLS as Distributed by MLS Grid
- 2007-03-05 Listed $164,900 Stellar MLS as Distributed by MLS Grid
- 2005-10-12 Sold (Public Records) $164,000 Public Records
- 2005-10-07 Sold (MLS) $164,000 Stellar MLS as Distributed by MLS Grid
- 2005-08-09 Listed $166,900 Stellar MLS as Distributed by MLS Grid
Property tax history
+7.7%/yrLatest (2025): $2,791 · +15.6% YoY. Source: county tax records.
Cash-flow waterfall
monthlySold comps — $/sqft
last 12 mo · ≤1 miLoading sold comps…