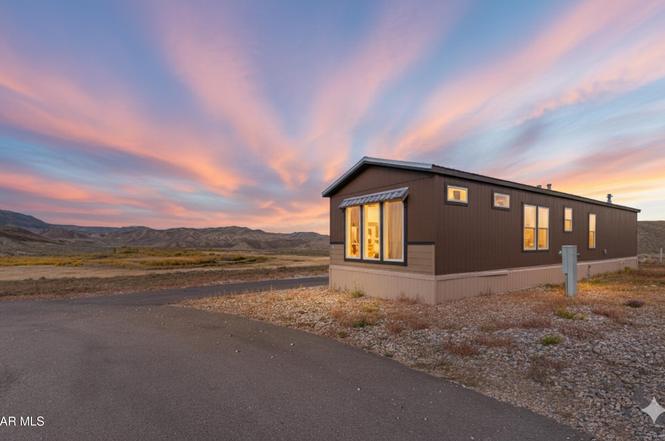
500 12th St Unit G-9 · Kremmling, CO
Flood risk 1/10 · Minimal
- FEMA flood zone
- D
- Chance of flooding over 30 yrs
- 0.0%
- Est. flood insurance / yr
- $544 – $1,084
Fire risk 5/10 · Moderate
- Est. fire insurance / yr
- $939 – $1,743
Heat risk 1/10 · Minimal
- Hot days now (above 83°F)
- 7 days/yr
- Hot days in 30 yrs
- 20 days/yr
Wind risk 1/10 · Minimal
- Chance of severe wind over 30 yrs
- —
Air-quality risk 1/10 · Minimal
- Unhealthy air days now
- 0 days/yr
- Unhealthy air days in 30 yrs
- 0 days/yr
Risk factors via First Street. Map © Google.
Why this score? — see what drove the D+ grade
The composite is a weighted blend of 9 inputs, each scored 0–100. Each bar is that input's sub-score; the figure is the points it added to the 100-point composite (weight × sub-score).
- Cash flow +18.9/30.0
- ARV discount +7.5/15.0
- DSCR +5.9/10.0
- 1% rule +5.0/10.0
- Livability +3.6/5.0
- Schools +2.9/10.0
- Rent growth +2.5/5.0
- Condition / age +2.5/5.0
- Appreciation +0.0/10.0
$110,000
🖨 Deal sheet 📄 Offer letter ✓ Due diligence
Listing remarks
Enjoy mountain living at its finest in this lightly lived-in home perched along the banks of the Muddy River. After just two years of careful use, this 2-bedroom, 1-bathroom property feels nearly brand new—offering modern finishes, comfort, and an unbeatable location. Inside, soaring 9' ceilings and floor-to-ceiling windows flood the space with natural light and mountain views, creating an open, airy atmosphere. The thoughtful layout seamlessly blends kitchen, dining, and living areas for everyday ease. A spacious bedroom and oversized bathroom provide comfort, while the full-size appliances, generous storage, and kitchen island make daily life both stylish and practical. Step outside
Key facts
- Boating
- Public lands
- Fishing
Tags
Neighborhood map
What this means for you Summary
Snapshot
- This is a 2-bed/1.0-bath single-family listed at $110k.
Deal economics
- At list price, monthly cash flow is $112 ($1k/yr) — positive.
- The deal already cash-flows at list — no discount required.
- Meets the 1% rule at list price ($1k rent vs $110k).
- Recommended offer: $97k (12.0% below list) — sets the bar for market timing.
- Cap rate 7.5% vs local median 0.6% in Kremmling — top-decile yield for the area; either an underpriced asset or a hidden risk that comps aren't pricing in. Stress-test before assuming the spread holds.
Location & tenants
- Location reads 72/100 on livability (#65 in CO) — a middle-class / working-renter tenant base. Strengths: health & safety A+, housing A; Watch: amenities F, commute F.
- West Grand School District No. 1 (rural): math 21% / reading 37% proficiency, ranked #102 of 176 in CO (top 58%) — low school quality limits family demand, transient renter base, plan for 1-2y turnover.
- Zoned schools: West Grand Elementary And Middle School (math 22% / reading 37%, grade F, #512 of 966 statewide, top 55%, 279 students, 33% FRL); West Grand High School (math 30% / reading 50%, grade F, #167 of 381 statewide, top 46%, 112 students, 44% FRL).
- Market conditions: 92 active listings in the ZIP; 294 units permitted in Grand County in 2024 (82 in 5+ unit buildings).
Forward outlook
- Local home prices are declining (-3.0%/yr); year-one equity from $761 of loan paydown is wiped out by about $3k of value loss. Plan a longer hold.
- Grand County population projected at -16% by 2050 — secular population decline; favor cash flow + early exit over multi-decade hold.
Negotiation context
- It's been on market 147 days — a 12% lower offer ($97k) is reasonable based on typical stale-listing flexibility.
Risks & watch-outs
- Climate carrying-cost: moderate wildfire risk — expect insurance premiums to compound above CPI over the hold.
Questions for the listing agent
- It's been on market 147 days. Have you received any prior offers? Is the seller open to a 12% concession, seller financing, or rate buy-down credit?
- Why hasn't it sold? Are there any deal-killer items the seller is aware of (foundation, flood, title, zoning, code violations)?
- Is there a deadline driving the sale (1031 exchange, divorce, estate, relocation)? That informs how much negotiation room exists.
- Schools are D-rated, which usually means shorter tenancies and higher turnover. Who's the typical renter profile here, and what's been the actual vacancy rate?
- The area grade is low — what's the realistic commute time and amenity access for the typical tenant pool here? Any planned neighborhood developments (good or bad) we should know about?
- What's the average days-on-market for RENTAL listings here right now (not sales)? A rising rental-DOM trend means longer vacancies and softer asking-rent achievability than the comps imply.
- What's the recent tenant-quality profile in this submarket — average credit score on applications, eviction rate, late-payment / NSF rate, and stable-employment percentage? A property-management company in the area should have these aggregated.
- How much new for-sale + rental construction is in the pipeline within 1–3 miles? Heavy new supply typically softens prices + rents 12–24 months out; constrained supply supports both.
Investment metrics
- 1% rule
- 1.00% ✓
- Cap rate
- 7.51%
- Cash-on-cash
- 4.36%
- DSCR
- 1.19
- GRM
- 8.3
CMA / ARV
- ARV (on-the-fly)
- $337,620
- Comps found
- 12
Show comp detail 12 sales within ~0.75 mi
| Address | Dist | Beds/Ba | Sqft | Sold | Price | $/sf | Match |
|---|---|---|---|---|---|---|---|
| 313 18th St | 0.47mi | 2/2.0 | 1,039 (+2%) | 8mo | $399,000 | $384 | 64 |
| 908 Central Ave Ave #4 | 0.33mi | 3/2.0 (+1) | 980 (-4%) | 17mo | $52,000 | $53 | 55 |
| 331 Kinsey Ave | 0.65mi | 2/2.0 | 1,074 (+5%) | 3mo | $463,000 | $431 | 54 |
| 212 20th St | 0.62mi | 3/1.0 (+1) | 960 (-6%) | 3mo | $416,000 | $433 | 54 |
| 401 Kinsey Ave | 0.59mi | 2/2.0 | 1,074 (+5%) | 8mo | $430,170 | $401 | 53 |
| 421 Kinsey Ave | 0.60mi | 2/2.0 | 1,074 (+5%) | 12mo | $395,000 | $368 | 49 |
| 200 9th Unit A | 0.33mi | 2/1.5 | 900 (-12%) | 22mo | $298,000 | $331 | 45 |
| 207 20th St | 0.59mi | 3/1.0 (+1) | 1,056 (+4%) | 22mo | $328,650 | $311 | 43 |
| 901 Central Ave | 0.28mi | 2/2.0 | 1,154 (+13%) | 22mo | $357,000 | $309 | 43 |
| 407 Eagle Ave | 0.65mi | 2/1.0 | 1,169 (+15%) | 7mo | $135,111 | $116 | 39 |
| 307 Eagle Avenue Ave | 0.70mi | 3/1.0 (+1) | 1,136 (+11%) | 9mo | $368,000 | $324 | 36 |
| 405 5th St | 0.74mi | 3/1.0 (+1) | 1,147 (+12%) | 6mo | $379,000 | $330 | 35 |
Match score weights: distance 35% · size 25% · config 20% · recency 20%. Top-matched comps best support the ARV.
Projected returns pro-forma
-3.0% appreciation · 3.0% rent growth · sell at horizon
- IRR
- -9.5%
- Equity multiple
- 0.65×
- Total profit
- $-10,675
- Equity at exit
- $16,401
- IRR
- -0.0%
- Equity multiple
- 1.00×
- Total profit
- $-43
- Equity at exit
- $9,511
Cash invested: $30,800 (down + closing). Projections, not guarantees.
Landlord ↔ Tenant lean methodology
- Overall (STATE)
- 38 Tenant-Leaning
- State Colorado
- 38 Tenant-Leaning · D+4
- County
- — inherits STATE
- City
- — inherits STATE
ZIP-level market 80459
- Active inventory
- 92
- Price-to-rent
- 8.3×
Monthly cashflow live
- Estimated rent
- $1,104 medium interval (Pro) →
- Mortgage (P&I)
- −$577
- Tax est. 1.5%
- −$138 /mo · $1,650/yr
- Insurance
- −$46
- HOA
- −$0
- Vacancy / Maint / Mgmt
- −$232
- Net cashflow
- $112
Break-even live
UW: 25.0% down · 7.5% · 30yr · 1.5% tax · 5.0% vac · 8.0% maint · 8.0% mgmt
Financing live
Cash to close
- Down payment
- $27,500
- Closing costs
- $3,300
- Reserves months
- —
- Total cash needed
- —
Loan-product check · same deal, 3 products live
Conventional
25% down · 7.5% · 30yr
- Down + closing
- —
- Monthly P&I
- —
- Monthly cashflow
- —
- DSCR
- —
- Eligible?
- —
Personal DTI + credit; lowest rate.
DSCR
20% down · 8.5% · 30yr
- Down + closing
- —
- Monthly P&I
- —
- Monthly cashflow
- —
- DSCR
- —
- Eligible?
- —
No personal income docs; deal must DSCR.
Hard money
10% down · 12.0% · 12mo
- Down + closing
- —
- Monthly P&I
- —
- Monthly cashflow
- —
- DSCR
- —
- Eligible?
- —
Short-term bridge; refi at stabilization.
Listing history 3 events
-
2026-02-24status Pending
-
2026-01-05price $110,000
-
2025-10-01$119,900 Active
ⓘ Source: listings_history table (triggers on properties + properties_extension) + one-shot
backfill from property_details.listing_events for pre-trigger history.
Climate risk First Street
- Flood 1/10 Low FEMA zone D · 0% chance over 30 yrs
- Wildfire 5/10 Major
- Heat 1/10 Low 7 d/yr ≥83°F today · 20 d/yr by 30 yrs out
- Wind 1/10 Low
- Air quality 1/10 Low 0 unhealthy d/yr today · 0 by 30 yrs out
Nearby sold comps map
Loading sold comps map…
Walkable amenities ~0.75 mi
Loading nearby amenities…
Taxation est. · year 1
- Rental income
- $13,248
- − Mortgage interest
- −$6,162
- − Property taxes
- −$1,650
- − Insurance
- −$550
- − Repairs & maintenance
- −$1,060
- − Management
- −$1,060
- − Depreciation
- −$3,200
- Taxable loss
- −$433
- Est. tax savings @ 24.0%
- +$104
- After-tax cash flow
- $1,448/yr
For passive investors: Depreciation is non-cash, so a rental often shows a tax loss while cash-flowing — sheltering income. Rental losses are passive: they offset passive income freely, and up to $25,000/yr can offset ordinary (W-2) income if you actively participate and your MAGI is under $100k (phasing out to $0 by $150k); unused losses carry forward. On sale, claimed depreciation is recaptured at up to 25%, and gains may owe capital-gains tax (a 1031 exchange can defer both). Figures are a year-1 estimate at your 24.0% rate — not tax advice; consult a CPA.
Schools (NCES district)
- District
- West Grand School District No. 1
- NCES district ID
- 0805070
- Math proficiency
- 21% ▼ -4.00%
- Reading proficiency
- 37% ▲ 2.00%
- Median HH income
- $56,989
- Composite
- 28.89/100
- National rank
- #11951
- State rank
- #102 of 176 in CO
Livability — Kremmling
- Score
- 72/100
- State rank
- #65
- US rank
- #6209
Category grades
Schools grade is shown separately in the Schools card above.
Census & demographics
- Population (ZIP)
- 2,691
Population outlook (Grand County) Hauer SSP2
- Today (2025)
- 14,498 people
- By 2030
- 14,215 · -2.0%
- By 2040
- 13,225 · -8.8%
- By 2050
- 12,186 · -15.9%
- By 2075
- 10,196 · -29.7%
- By 2100
- 8,326 · -42.6%
Race, ethnicity, and origin ACS 2023
- Neighborhood character
- Diverse neighborhood (Simpson 0.56)
- Race & ethnicity
- White 62% Two or more races 26% Hispanic / Latino 22%
- Hispanic origin (detail)
- Mexican 17%
- Common ancestry
- Slovak 5% Lithuanian 1% Iranian 1%
- Foreign-born
- 3% · Canada
- Languages at home
- 84% English-only · Spanish 15%
Political lean MEDSL · Grand
- 2024 margin
- Toss-up / Even · D 48.0% · R 48.8% · Other 3.2%
- 2008→2024 swing
- +0.3pp no change · 2008: -1.1pp · 2024: -0.8pp
- All cycles
- 2024: R+0.8 2020: R+1.8 2016: R+13.5 2012: R+7.2 2008: R+1.1
Not yet ingested
- Civics
- —
Market trends
- HPI YoY
- ▼ -191.60%
- Current HPI
- 350.7952
- Rent YoY
- —
- Metro
- —
- State GDP YoY
- ▲ 1.95%
- F500 in state
- 14
Industry mix (Fortune 500 HQ in CO)
| Industry | F500 HQs | Revenue |
|---|---|---|
| Technology Distribution | 1 | $31B |
|
||
| Food / Agriculture | 1 | $18B |
|
||
| Packaging | 1 | $14B |
|
||
| Healthcare | 1 | $13B |
|
||
| Energy | 1 | $10B |
|
||
| Technology | 1 | $4B |
|
||
Price history
-8.3% since first listed3 events — show timeline
- 2026-02-24 Pending — GCAR
- 2026-01-05 Price Changed $110,000 GCAR
- 2025-10-01 Listed $119,900 GCAR
Cash-flow waterfall
monthlySold comps — $/sqft
last 12 mo · ≤1 miLoading sold comps…