708 Striped Bass Ct · Santee, SC
Flood risk No data
- FEMA flood zone
- —
- Chance of flooding over 30 yrs
- —
- Est. flood insurance / yr
- —
Fire risk No data
- Est. fire insurance / yr
- —
Heat risk No data
- Hot days now (above threshold)
- —
- Hot days in 30 yrs
- —
Wind risk No data
- Chance of severe wind over 30 yrs
- —
Air-quality risk No data
- Unhealthy air days now
- —
- Unhealthy air days in 30 yrs
- —
Risk factors via First Street. Map © Google.
Why this score? — see what drove the D grade
The composite is a weighted blend of 9 inputs, each scored 0–100. Each bar is that input's sub-score; the figure is the points it added to the 100-point composite (weight × sub-score).
- ARV discount +10.9/15.0
- Cash flow +7.2/30.0
- Appreciation +6.7/10.0
- Schools +5.0/10.0
- Livability +3.1/5.0
- Rent growth +2.5/5.0
- Condition / age +2.5/5.0
- 1% rule +2.2/10.0
- DSCR +1.4/10.0
$291,900
🖨 Deal sheet 📄 Offer letter ✓ Due diligence
Listing remarks
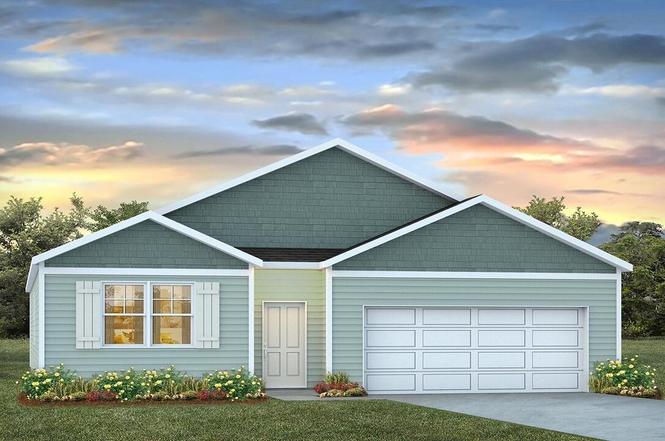
Welcome to 708 Striped Bass Court in the Center Pointe community of Santee, South Carolina, where modern new construction meets the charm of Lowcountry living. Set amid scenic surroundings, this community provides easy access to golf, outdoor recreation, and Lake Marion, offering a lifestyle that is both active and serene. This home features the Cali floor plan, a thoughtfully designed layout created for comfortable, efficient living. From the welcoming foyer, the home opens into a bright open-concept living area that flows seamlessly into the kitchen and dining space, creating an inviting environment for everyday living and entertaining. The layout offers a natural separation between the m
Key facts
- Outdoor recreation
- Walk-in closet
- Lake marion
Tags
Neighborhood map
What this means for you Summary
Snapshot
- This is a 4-bed/2.0-bath single-family listed at $292k.
Deal economics
- At list price, monthly cash flow is $-401 ($-5k/yr) — negative.
- To cash-flow at today's rent, offer at most $234k (19.9% below list).
- To meet the 1% rule (rent ≥ 1% of price), the offer needs to be $210k (28.1% below list).
- Recommended offer: $210k (28.1% below list) — sets the bar for 1% rule.
Location & tenants
- Location reads 61/100 on livability (#202 in SC) — a middle-class / working-renter tenant base. Strengths: cost of living A+, health & safety A+; Watch: crime F, amenities F, commute F.
- Zoned schools: Elloree Elementary (math 10%, 387 students, 100% FRL).
- Market conditions: 154 active listings in the ZIP; 1 comparable units currently listed for rent nearby; 87 units permitted in Orangeburg County in 2024 (0 in 5+ unit buildings).
Forward outlook
- In year one you build about $12k of equity ($2k loan paydown + $10k appreciation (3.5% local appreciation)).
- Orangeburg County population projected at -27% by 2050 — secular population decline; favor cash flow + early exit over multi-decade hold.
- By year 3, paydown + projected appreciation supports a ~$30k cash-out refi (75% LTV) — recoverable capital for the next deal without selling this one.
Negotiation context
- It's been on market 94 days — a 9% lower offer ($266k) is reasonable based on typical stale-listing flexibility.
Questions for the listing agent
- What do current leases actually rent for vs. the listed asking? Can we see a recent rent roll and the last 12 months of T-12 income?
- It's been on market 94 days. Have you received any prior offers? Is the seller open to a 28% concession, seller financing, or rate buy-down credit?
- What does the HOA fee cover, when was the last increase, and are there any pending special assessments or reserve-fund shortfalls?
- Why hasn't it sold? Are there any deal-killer items the seller is aware of (foundation, flood, title, zoning, code violations)?
- Is there a deadline driving the sale (1031 exchange, divorce, estate, relocation)? That informs how much negotiation room exists.
- Schools are D-rated, which usually means shorter tenancies and higher turnover. Who's the typical renter profile here, and what's been the actual vacancy rate?
- Crime grade is F in this area — have there been break-ins, vandalism, or insurance claims at this property in the last 3 years? What carrier currently insures it and at what premium?
- The area grade is low — what's the realistic commute time and amenity access for the typical tenant pool here? Any planned neighborhood developments (good or bad) we should know about?
- What's the average days-on-market for RENTAL listings here right now (not sales)? A rising rental-DOM trend means longer vacancies and softer asking-rent achievability than the comps imply.
- What's the recent tenant-quality profile in this submarket — average credit score on applications, eviction rate, late-payment / NSF rate, and stable-employment percentage? A property-management company in the area should have these aggregated.
- How much new for-sale + rental construction is in the pipeline within 1–3 miles? Heavy new supply typically softens prices + rents 12–24 months out; constrained supply supports both.
Investment metrics
- 1% rule
- 0.72% ✗
- Cap rate
- 4.64%
- Cash-on-cash
- -5.89%
- DSCR
- 0.74
- GRM
- 11.6
CMA / ARV
- ARV (on-the-fly)
- $315,772
- Comps found
- 12
Show comp detail 12 sales within ~0.75 mi
| Address | Dist | Beds/Ba | Sqft | Sold | Price | $/sf | Match |
|---|---|---|---|---|---|---|---|
| 717 Striped Bass Ct | 0.03mi | 4/2.0 | 1,774 (0%) | 2mo | $289,900 | $163 | 97 |
| 716 Striped Bass Ct | 0.02mi | 4/2.0 | 1,774 (0%) | 7mo | $291,900 | $165 | 93 |
| 705 Striped Bass Ct | 0.02mi | 4/2.0 | 1,774 (0%) | 9mo | $299,210 | $169 | 92 |
| 728 Striped Bass Ct | 0.05mi | 4/2.0 | 1,774 (0%) | 11mo | $289,900 | $163 | 89 |
| 620 Perch Ln | 0.07mi | 4/2.0 | 1,774 (0%) | 12mo | $290,710 | $164 | 87 |
| 122 Congaree Ct | 0.16mi | 4/2.0 | 1,774 (0%) | 10mo | $289,000 | $163 | 84 |
| 140 Green Ct | 0.31mi | 3/2.0 (-1) | 1,804 (+2%) | 10mo | $325,000 | $180 | 69 |
| 131 Green Ct | 0.28mi | 3/2.0 (-1) | 1,950 (+10%) | 1mo | $425,000 | $218 | 65 |
| 612 Perch Ln | 0.06mi | 3/2.5 (-1) | 1,517 (-14%) | 3mo | $283,900 | $187 | 64 |
| 677 Perch Ln | 0.05mi | 3/2.5 (-1) | 1,517 (-14%) | 10mo | $269,850 | $178 | 58 |
| 150 Par Ct | 0.22mi | 3/2.5 (-1) | 1,555 (-12%) | 13mo | $317,500 | $204 | 51 |
| 213 Myrtlewood Dr | 0.64mi | 3/2.0 (-1) | 1,610 (-9%) | 10mo | $365,000 | $227 | 42 |
Match score weights: distance 35% · size 25% · config 20% · recency 20%. Top-matched comps best support the ARV.
Projected returns pro-forma
3.47% appreciation · 3.0% rent growth · sell at horizon
- IRR
- 3.5%
- Equity multiple
- 1.21×
- Total profit
- $17,046
- Equity at exit
- $139,102
- IRR
- 6.7%
- Equity multiple
- 2.07×
- Total profit
- $87,660
- Equity at exit
- $220,689
Cash invested: $81,732 (down + closing). Projections, not guarantees.
Landlord ↔ Tenant lean methodology
- Overall (STATE)
- 90 Strongly Landlord-Friendly
- State South Carolina
- 90 Strongly Landlord-Friendly · R+6
- County
- — inherits STATE
- City
- — inherits STATE
ZIP-level market 29142
- Home prices YoY
- 1.8%
- Active inventory
- 154
- Price-to-rent
- 11.6×
Monthly cashflow live
- Estimated rent
- $2,100 medium interval (Pro) →
- Mortgage (P&I)
- −$1,531
- Tax est. 1.5%
- −$365 /mo · $4,378/yr
- Insurance
- −$122
- HOA
- −$43
- Vacancy / Maint / Mgmt
- −$441
- Net cashflow
- $-401
Break-even live
UW: 25.0% down · 7.5% · 30yr · 1.5% tax · 5.0% vac · 8.0% maint · 8.0% mgmt
Financing live
Cash to close
- Down payment
- $72,975
- Closing costs
- $8,757
- Reserves months
- —
- Total cash needed
- —
Loan-product check · same deal, 3 products live
Conventional
25% down · 7.5% · 30yr
- Down + closing
- —
- Monthly P&I
- —
- Monthly cashflow
- —
- DSCR
- —
- Eligible?
- —
Personal DTI + credit; lowest rate.
DSCR
20% down · 8.5% · 30yr
- Down + closing
- —
- Monthly P&I
- —
- Monthly cashflow
- —
- DSCR
- —
- Eligible?
- —
No personal income docs; deal must DSCR.
Hard money
10% down · 12.0% · 12mo
- Down + closing
- —
- Monthly P&I
- —
- Monthly cashflow
- —
- DSCR
- —
- Eligible?
- —
Short-term bridge; refi at stabilization.
Rent comps 1 comps
| Address | Beds | Baths | Sqft | Rent | $/sqft | DOM | Units | Dist |
|---|---|---|---|---|---|---|---|---|
| 208 Trillium Ct Santee, SC | 3.0 | 3.0 | 1500 | $2,100 | $1.40 | 23d | 1 | 1.07mi |
HOA detail
- Monthly dues
- $43 · $516/yr
Listing history 5 events
-
2026-04-06status Pending
-
2026-02-23price $291,900
-
2026-02-23price $289,900
-
2026-01-28price $291,900
-
2026-01-02$296,710 Active
ⓘ Source: listings_history table (triggers on properties + properties_extension) + one-shot
backfill from property_details.listing_events for pre-trigger history.
Nearby sold comps map
Loading sold comps map…
Walkable amenities ~0.75 mi
Loading nearby amenities…
Taxation est. · year 1
- Rental income
- $25,200
- − Mortgage interest
- −$16,351
- − Property taxes
- −$4,378
- − Insurance
- −$1,460
- − Repairs & maintenance
- −$2,016
- − Management
- −$2,016
- − HOA
- −$516
- − Depreciation
- −$8,492
- Taxable loss
- −$10,029
- Est. tax savings @ 24.0%
- +$2,407
- After-tax cash flow
- $-2,408/yr
For passive investors: Depreciation is non-cash, so a rental often shows a tax loss while cash-flowing — sheltering income. Rental losses are passive: they offset passive income freely, and up to $25,000/yr can offset ordinary (W-2) income if you actively participate and your MAGI is under $100k (phasing out to $0 by $150k); unused losses carry forward. On sale, claimed depreciation is recaptured at up to 25%, and gains may owe capital-gains tax (a 1031 exchange can defer both). Figures are a year-1 estimate at your 24.0% rate — not tax advice; consult a CPA.
Schools (NCES district)
No district data.
Livability — Santee
- Score
- 61/100
- State rank
- #202
- US rank
- #17354
Category grades
Schools grade is shown separately in the Schools card above.
Census & demographics
- Census place
- Santee, SC
- Population (ZIP)
- 4,658
Population outlook (Orangeburg County) Hauer SSP2
- Today (2025)
- 82,698 people
- By 2030
- 78,615 · -4.9%
- By 2040
- 69,308 · -16.2%
- By 2050
- 60,629 · -26.7%
- By 2075
- 42,678 · -48.4%
- By 2100
- 28,136 · -66.0%
Race, ethnicity, and origin ACS 2023
- Neighborhood character
- Majority Black (64%)
- Race & ethnicity
- Black 64% White 31% Asian 3% Hispanic / Latino 2%
- Common ancestry
- Lithuanian 2% Romanian 2%
- Foreign-born
- 1%
- Languages at home
- 96% English-only · Other Indo-European 2% Spanish 1%
Political lean MEDSL · Orangeburg
- 2024 margin
- Strong D (+24.6) · D 61.8% · R 37.2% · Other 1.1%
- 2008→2024 swing
- -13.5pp toward R · 2008: 38.1pp · 2024: 24.6pp
- All cycles
- 2024: D+24.6 2020: D+33.2 2016: D+37.0 2012: D+43.5 2008: D+38.1
Not yet ingested
- Civics
- —
Market trends
- HPI YoY
- ▲ 3.47%
- Current HPI
- 193.5623
- Rent YoY
- —
- Metro
- —
- State GDP YoY
- ▲ 4.51%
- F500 in state
- 2
Industry mix (Fortune 500 HQ in SC)
| Industry | F500 HQs | Revenue |
|---|---|---|
| Packaging | 1 | $7B |
|
||
Price history
-1.6% since first listed5 events — show timeline
- 2026-04-06 Pending — Charleston Trident MLS
- 2026-02-23 Price Changed $291,900 Charleston Trident MLS
- 2026-02-23 Price Changed $289,900 Charleston Trident MLS
- 2026-01-28 Price Changed $291,900 Charleston Trident MLS
- 2026-01-02 Listed $296,710 Charleston Trident MLS
Cash-flow waterfall
monthlySold comps — $/sqft
last 12 mo · ≤1 miLoading sold comps…