 Multi-family
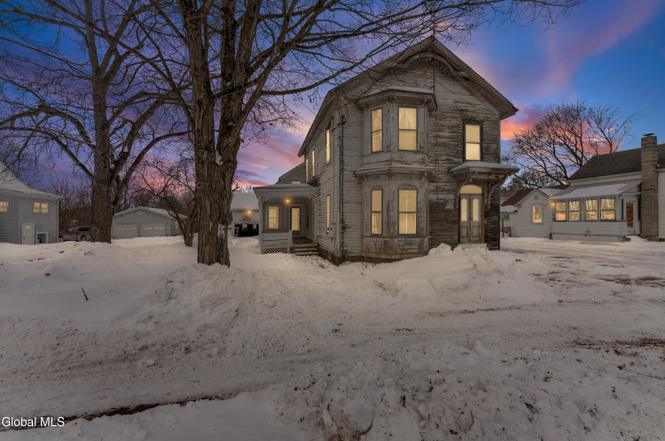
39 East St · Argyle, NY
Flood risk 1/10 · Minimal
- FEMA flood zone
- X
- Chance of flooding over 30 yrs
- 0.0%
- Est. flood insurance / yr
- $473 – $860
Fire risk 3/10 · Minor
- Est. fire insurance / yr
- $691 – $1,283
Heat risk 3/10 · Minor
- Hot days now (above 96°F)
- 7 days/yr
- Hot days in 30 yrs
- 17 days/yr
Wind risk 2/10 · Minimal
- Chance of severe wind over 30 yrs
- 4.0%
Air-quality risk 2/10 · Minimal
- Unhealthy air days now
- 0 days/yr
- Unhealthy air days in 30 yrs
- 1 days/yr
Risk factors via First Street. Map © Google.
Why this score? — see what drove the A- grade
The composite is a weighted blend of 9 inputs, each scored 0–100. Each bar is that input's sub-score; the figure is the points it added to the 100-point composite (weight × sub-score).
- Cash flow +30.0/30.0
- 1% rule +10.0/10.0
- DSCR +10.0/10.0
- Appreciation +10.0/10.0
- ARV discount +7.5/15.0
- Schools +4.6/10.0
- Livability +3.0/5.0
- Rent growth +2.5/5.0
- Condition / age +2.5/5.0
$134,000
🖨 Deal sheet (PDF) 📄 Offer letter ✓ Due diligence
Multi-family units
County records classify this as Multi-Family (2-4 Unit). Listing-text estimate: 1 unit. estimate disagrees with records
Listing remarks
Spacious old-style village home with classic character, currently set up as an up/down duplex. This property is ready for renovation and packed with potential--perfect for those with vision. Features include a two-car garage and additional office space, offering endless possibilities for income, multi-generational living, or a stunning single-family conversion. Call for detail or an appointment! So much potential. Cash or rehab loan only. Sold in as is condition. 3 electric services all 150 amp, up, down & garage separate. Hot air fuel oil furnace services both levels, unknown condition. Garage has own separate hot air/fuel oil system, also condition unknown. All utilities are current
Key facts
- 0.23 acre lot
- 2 garage spots
- Built 1890
Property features AI
Finance
- Financial info: Two-unit property
Exterior
- Parking: 2-car garage; 4 total parking spaces; Paved parking
- Utilities: Public water; Septic tank; Cable available
- Home design: Duplex; 2,580 finished living area; Main road frontage approximately 68 feet
- Construction: Wood siding; Stone foundation; Slate and rubber roofing; Built with traditional construction materials
- Exterior features: Rear porch; Workshop; Garage(s); Level lot
Interior
- Bedrooms: Unit 1: 1 bedroom; Unit 2: 2 bedrooms
- Flooring: Wood flooring; Carpet; Linoleum
- Bathrooms: 2 full bathrooms total (one on first level, one on second level); Unit 1: 1 full bath; Unit 2: 1 full bath
- Heating & cooling: Forced air heating; Oil heating
- Interior features: Chair rail; Crown molding; ENERGY STAR qualified doors
- Laundry & utility: Washer hookup; Electric dryer hookup; Full basement with interior entry and sump pump
Neighborhood map
What this means for you Summary
Snapshot
- This is a 3-bed/2.0-bath multifamily listed at $134k.
Deal economics
- At list price, monthly cash flow is $943 ($11k/yr) — positive.
- The deal already cash-flows at list — no discount required.
- Meets the 1% rule at list price ($3k rent vs $134k).
- Recommended offer: $126k (6.0% below list) — sets the bar for market timing.
Location & tenants
- Location reads 59/100 on livability (#1,010 in NY) — a working-class tenant base; expect higher turnover. Strengths: cost of living A+, housing A+; Watch: employment D, health & safety D, crime F.
- Argyle Central School District (rural): math 54% / reading 48% proficiency, ranked #426 of 755 in NY (top 56%) — acceptable for families but not a draw, mixed tenant base, ~2y average lease.
- Zoned schools: Argyle Junior/Senior High School (math 47% / reading 62%, grade C-, #912 of 1,100 statewide, top 85%, 229 students, 48% FRL) — zoned schools average 48% FRL vs 26% district-wide (22 pts higher); higher-poverty schools than district average — tighter screening recommended.
- Market conditions: 25 active listings in the ZIP; 106 units permitted in Washington County in 2024 (0 in 5+ unit buildings).
Forward outlook
- In year one you build about $14k of equity ($926 loan paydown + $13k appreciation (10.0% local appreciation)).
- Washington County population projected at -20% by 2050 — secular population decline; favor cash flow + early exit over multi-decade hold.
- At projected returns (10.0% appreciation + 3.0% rent growth), your $38k cash investment doubles in ~2 years — after that, you're playing with house money.
- By year 3, paydown + projected appreciation supports a ~$36k cash-out refi (75% LTV) — recoverable capital for the next deal without selling this one.
Negotiation context
- It's been on market 85 days — a 6% lower offer ($126k) is reasonable based on typical stale-listing flexibility.
- 2 sale attempts with the ask held roughly flat each time — persistent listings suggest the price (not the market) is what's stuck; bring a comps-based counter.
Risks & watch-outs
- Watch-outs: property tax is 2.6% of price; built in 1890 — expect roof / HVAC / electrical / plumbing capex.
Questions for the listing agent
- It's been on market 85 days. Have you received any prior offers? Is the seller open to a 6% concession, seller financing, or rate buy-down credit?
- Built in 1890 — when were the roof, HVAC, electrical panel, plumbing, and water heater last replaced?
- Property tax is high relative to price — has the assessment been appealed recently, and will the sale trigger a re-assessment?
- Why hasn't it sold? Are there any deal-killer items the seller is aware of (foundation, flood, title, zoning, code violations)?
- Is there a deadline driving the sale (1031 exchange, divorce, estate, relocation)? That informs how much negotiation room exists.
- Crime grade is F in this area — have there been break-ins, vandalism, or insurance claims at this property in the last 3 years? What carrier currently insures it and at what premium?
- What's the average days-on-market for RENTAL listings here right now (not sales)? A rising rental-DOM trend means longer vacancies and softer asking-rent achievability than the comps imply.
- What's the recent tenant-quality profile in this submarket — average credit score on applications, eviction rate, late-payment / NSF rate, and stable-employment percentage? A property-management company in the area should have these aggregated.
- How much new apartment / multifamily construction is in the pipeline within 1–3 miles? Heavy new supply (>2% of stock underway) typically softens rents 12–24 months out; light construction supports rent growth.
Investment metrics
- 1% rule
- 1.88% ✓
- Cap rate
- 14.74%
- Cash-on-cash
- 30.17%
- DSCR
- 2.34
- GRM
- 4.4
CMA / ARV
No comps found within radius.
Projected returns pro-forma
10.0% appreciation · 3.0% rent growth · sell at horizon
- IRR
- 47.2%
- Equity multiple
- 4.55×
- Total profit
- $133,166
- Equity at exit
- $120,718
- IRR
- 41.1%
- Equity multiple
- 10.20×
- Total profit
- $345,139
- Equity at exit
- $260,333
Cash invested: $37,520 (down + closing). Projections, not guarantees.
Landlord ↔ Tenant lean methodology
- Overall (STATE)
- 15 Strongly Tenant-Friendly
- State New York
- 15 Strongly Tenant-Friendly · D+10
- County
- — inherits STATE
- City
- — inherits STATE
ZIP-level market 12809
- Home prices YoY
- 20.2%
- Active inventory
- 25
- Price-to-rent
- 8.9×
Monthly cashflow live
- Estimated rent
- $2,523 medium interval (Pro) →
- Mortgage (P&I)
- −$703
- Tax from tax record
- −$291 /mo · $3,497/yr
- Insurance
- −$56
- HOA
- −$0
- Vacancy / Maint / Mgmt
- −$530
- Net cashflow
- $943
Break-even live
Sensitivity live
| Price | -10% $1,019 | -5% $981 | +0% $943 | +5% $905 | +10% $867 |
|---|---|---|---|---|---|
| Rent | -10% $744 | -5% $844 | +0% $943 | +5% $1,043 | +10% $1,143 |
| Rate | -1.0pp $1,011 | -0.5pp $977 | base $943 | +0.5pp $908 | +1.0pp $873 |
2-unit breakdown (identical units grouped — click to expand)
| Units | Beds | Baths | Est. rent |
|---|---|---|---|
| 2× units | 3 | 1.5 | $2,524 |
| #1 | 3 | 1.5 | $1,262 |
| #2 | 3 | 1.5 | $1,262 |
| Total (2 units) | $2,523 | ||
UW: 25.0% down · 7.5% · 30yr · 1.5% tax · 5.0% vac · 8.0% maint · 8.0% mgmt
Financing live
Cash to close
- Down payment
- $33,500
- Closing costs
- $4,020
- Reserves months
- —
- Total cash needed
- —
Loan-product check · same deal, 3 products live
Conventional
25% down · 7.5% · 30yr
- Down + closing
- —
- Monthly P&I
- —
- Monthly cashflow
- —
- DSCR
- —
- Eligible?
- —
Personal DTI + credit; lowest rate.
DSCR
20% down · 8.5% · 30yr
- Down + closing
- —
- Monthly P&I
- —
- Monthly cashflow
- —
- DSCR
- —
- Eligible?
- —
No personal income docs; deal must DSCR.
Hard money
10% down · 12.0% · 12mo
- Down + closing
- —
- Monthly P&I
- —
- Monthly cashflow
- —
- DSCR
- —
- Eligible?
- —
Short-term bridge; refi at stabilization.
Listing history 8 events
-
2026-05-05status Pending
-
2026-03-21historical Contingent
-
2026-03-10price $134,000
-
2026-02-08$139,000 Active
-
2026-01-17historical
-
2025-11-12price $145,000
-
2025-09-10price $160,000
-
2025-07-16$169,900 Active
ⓘ Source: listings_history table (triggers on properties + properties_extension) + one-shot
backfill from property_details.listing_events for pre-trigger history.
Tax reassessment forecast NY · Partial reset (capped growth)
- Current annual tax
- $3,497 · $291/mo
- Projected year-2 tax
- $3,497 · $291/mo
- Expected delta
- $0/yr ($0/mo · 0.0%)
ⓘ Screening estimate from a state-policy table — verify with the county assessor before closing.
Climate risk First Street
- Flood 1/10 Low FEMA zone X · 0% chance over 30 yrs
- Wildfire 3/10 Moderate
- Heat 3/10 Moderate 7 d/yr ≥96°F today · 17 d/yr by 30 yrs out
- Wind 2/10 Low 4% chance of damaging wind over 30 yrs
- Air quality 2/10 Low 0 unhealthy d/yr today · 1 by 30 yrs out
Nearby sold comps map
Loading sold comps map…
Walkable amenities ~0.75 mi
Loading nearby amenities…
Taxation est. · year 1
- Rental income
- $30,276
- − Mortgage interest
- −$7,506
- − Property taxes
- −$3,497
- − Insurance
- −$670
- − Repairs & maintenance
- −$2,422
- − Management
- −$2,422
- − Depreciation
- −$3,898
- Taxable income
- $9,860
- Est. tax owed @ 24.0%
- −$2,366
- After-tax cash flow
- $8,952/yr
For passive investors: Depreciation is non-cash, so a rental often shows a tax loss while cash-flowing — sheltering income. Rental losses are passive: they offset passive income freely, and up to $25,000/yr can offset ordinary (W-2) income if you actively participate and your MAGI is under $100k (phasing out to $0 by $150k); unused losses carry forward. On sale, claimed depreciation is recaptured at up to 25%, and gains may owe capital-gains tax (a 1031 exchange can defer both). Figures are a year-1 estimate at your 24.0% rate — not tax advice; consult a CPA.
Schools (NCES district)
- District
- Argyle Central School District
- NCES district ID
- 3603210
- Math proficiency
- 54% ▲ 1.00%
- Reading proficiency
- 48% ▼ -8.00%
- Median HH income
- $55,893
- Composite
- 46.17/100
- National rank
- #5453
- State rank
- #426 of 755 in NY
Livability — Argyle
- Score
- 59/100
- State rank
- #1010
- US rank
- #19685
Category grades
Schools grade is shown separately in the Schools card above.
Census & demographics
- Census place
- Argyle, NY
- Population (ZIP)
- 3,639
Population outlook (Washington County) Hauer SSP2
- Today (2025)
- 59,576 people
- By 2030
- 57,618 · -3.3%
- By 2040
- 52,751 · -11.5%
- By 2050
- 47,514 · -20.2%
- By 2075
- 35,690 · -40.1%
- By 2100
- 24,807 · -58.4%
Race, ethnicity, and origin ACS 2023
- Neighborhood character
- Predominantly White (95%)
- Race & ethnicity
- White 95% Two or more races 3% Hispanic / Latino 2%
- Common ancestry
- Lithuanian 8% Serbian 4% Romanian 4%
- Foreign-born
- 2% · Canada
- Languages at home
- 99% English-only · Spanish 1%
Political lean MEDSL · Washington
- 2024 margin
- Strong R (+21.2) · D 39.4% · R 60.6%
- 2008→2024 swing
- -22.0pp toward R · 2008: 0.8pp · 2024: -21.2pp
- All cycles
- 2024: R+21.2 2020: R+15.6 2016: R+20.2 2012: D+1.6 2008: D+0.8
Not yet ingested
- Civics
- —
Market trends
- HPI YoY
- ▲ 63.17%
- Current HPI
- 376.0979
- Rent YoY
- —
- Metro
- —
- State GDP YoY
- ▲ 2.60%
- F500 in state
- 92
Industry mix (Fortune 500 HQ in NY)
| Industry | F500 HQs | Revenue |
|---|---|---|
| Financial Services | 10 | $950B |
|
||
| Consumer Goods | 9 | $162B |
|
||
| Insurance | 4 | $225B |
|
||
| Telecommunications | 2 | $144B |
|
||
| Pharmaceuticals | 2 | $112B |
|
||
| Media / Entertainment | 2 | $69B |
|
||
Price history
-21.1% since first listed8 events — show timeline
- 2026-05-05 Pending — Global MLS
- 2026-03-21 Contingent — Global MLS
- 2026-03-10 Price Changed $134,000 Global MLS
- 2026-02-08 Listed $139,000 Global MLS
- 2026-01-17 Listing Removed — Global MLS
- 2025-11-12 Price Changed $145,000 Global MLS
- 2025-09-10 Price Changed $160,000 Global MLS
- 2025-07-16 Listed $169,900 Global MLS
Property tax history
+1.4%/yrLatest (2025): $3,497 · +6.6% YoY. Source: county tax records.
Cash-flow waterfall
monthlySold comps — $/sqft
last 12 mo · ≤1 miLoading sold comps…