 🏗️ New Construction
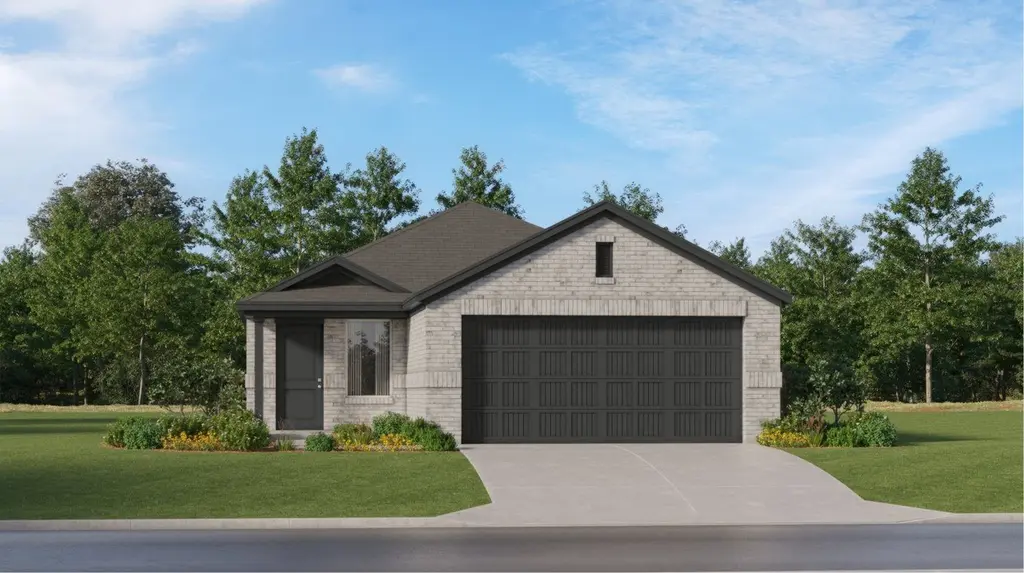
Pinehollow Plan · Angleton, TX
Flood risk 1/10 · Minimal
- FEMA flood zone
- X (unshaded)
- Chance of flooding over 30 yrs
- 0.0%
- Est. flood insurance / yr
- $507 – $1,088
Fire risk 4/10 · Minor
- Est. fire insurance / yr
- $1,222 – $2,270
Heat risk 9/10 · Severe
- Hot days now (above 111°F)
- 6 days/yr
- Hot days in 30 yrs
- 21 days/yr
Wind risk 9/10 · Severe
- Chance of severe wind over 30 yrs
- 99.0%
Air-quality risk 2/10 · Minimal
- Unhealthy air days now
- 1 days/yr
- Unhealthy air days in 30 yrs
- 1 days/yr
Risk factors via First Street. Map © Google.
Why this score? — see what drove the D- grade
The composite is a weighted blend of 9 inputs, each scored 0–100. Each bar is that input's sub-score; the figure is the points it added to the 100-point composite (weight × sub-score).
- Cash flow +12.6/30.0
- ARV discount +7.5/15.0
- DSCR +3.8/10.0
- Livability +3.7/5.0
- 1% rule +3.6/10.0
- Schools +3.5/10.0
- Rent growth +2.5/5.0
- Condition / age +2.5/5.0
- Appreciation +0.0/10.0
$250,990
🖨 Deal sheet (PDF) 📄 Offer letter ✓ Due diligence
Listing remarks MLS
This single-level home showcases a spacious open floorplan shared between the kitchen, dining area and family room for easy entertaining. An owner's suite enjoys a private location in a rear corner of the home, complemented by an en-suite bathroom and walk-in closet. There are three secondary bedrooms along the side of the home, which are comfortable spaces for household members and overnight guests.
Key facts
- 2 garage spots
- Listed 217 days
Neighborhood map
What this means for you Summary
Snapshot
- This is a 4-bed/2.0-bath single-family listed at $251k.
Deal economics
- At list price, monthly cash flow is $-33 ($-401/yr) — negative.
- The deal already cash-flows at list — no discount required.
- To meet the 1% rule (rent ≥ 1% of price), the offer needs to be $238k (5.1% below list).
- Recommended offer: $221k (12.0% below list) — sets the bar for market timing.
- Cap rate 6.1% vs local median 4.0% in Angleton — top-decile yield for the area; either an underpriced asset or a hidden risk that comps aren't pricing in. Stress-test before assuming the spread holds.
Location & tenants
- Location reads 74/100 on livability (#171 in TX, #4,520 nationally) — a middle-class / working-renter tenant base. Strengths: cost of living A+, housing A+, employment A-; Watch: schools D, amenities F, commute F.
- Angleton ISD (suburban): math 36% / reading 44% proficiency, ranked #375 of 826 in TX (top 45%) — families likely to look elsewhere, expect single-tenant / working-renter base with shorter leases.
- Market conditions: 932 active listings in the ZIP; 2 comparable units currently listed for rent nearby; solid renter incomes; 3,960 units permitted in Brazoria County in 2024 (593 in 5+ unit buildings).
- This rent runs 32% of the median local income ($89k/yr) — at the standard rent-burdened threshold; future hikes will face affordability resistance.
Forward outlook
- Local home prices are declining (-3.0%/yr); year-one equity from $2k of loan paydown is wiped out by about $8k of value loss. Plan a longer hold.
- Brazoria County population projected at +44% by 2050 — long-run rental-demand tailwind backs the buy-and-hold thesis.
Negotiation context
- It's been on market 218 days — a 12% lower offer ($221k) is reasonable based on typical stale-listing flexibility.
- 2 sale attempts since 2y ago; this cycle's ask has dropped $259k (51%) from the opening price — seller is motivated, your offer sets the floor, not the list.
Risks & watch-outs
- Climate carrying-cost: severe wind risk, 99% chance of damaging wind over 30y; extreme-heat days projected 6→21/yr by 2055 (HVAC capex compounding) — expect insurance premiums to compound above CPI over the hold.
Questions for the listing agent
- What do current leases actually rent for vs. the listed asking? Can we see a recent rent roll and the last 12 months of T-12 income?
- It's been on market 218 days. Have you received any prior offers? Is the seller open to a 12% concession, seller financing, or rate buy-down credit?
- Why hasn't it sold? Are there any deal-killer items the seller is aware of (foundation, flood, title, zoning, code violations)?
- Is there a deadline driving the sale (1031 exchange, divorce, estate, relocation)? That informs how much negotiation room exists.
- Schools are D-rated, which usually means shorter tenancies and higher turnover. Who's the typical renter profile here, and what's been the actual vacancy rate?
- The area grade is low — what's the realistic commute time and amenity access for the typical tenant pool here? Any planned neighborhood developments (good or bad) we should know about?
- What's the average days-on-market for RENTAL listings here right now (not sales)? A rising rental-DOM trend means longer vacancies and softer asking-rent achievability than the comps imply.
- What's the recent tenant-quality profile in this submarket — average credit score on applications, eviction rate, late-payment / NSF rate, and stable-employment percentage? A property-management company in the area should have these aggregated.
- How much new for-sale + rental construction is in the pipeline within 1–3 miles? Heavy new supply typically softens prices + rents 12–24 months out; constrained supply supports both.
Investment metrics
- 1% rule
- 0.86% ✗
- Cap rate
- 6.15%
- Cash-on-cash
- -0.52%
- DSCR
- 0.98
- GRM
- 9.7
CMA / ARV
- ARV (median comp)
- $276,982
- List price
- $250,990
- Delta
- -9.38%
- Verdict
- FAIR
- Comps
- 20 within 1.0 mi
Show comp detail 12 sales within ~0.75 mi
| Address | Dist | Beds/Ba | Sqft | Sold | Price | $/sf | Match |
|---|---|---|---|---|---|---|---|
| 3622 Atlas Point Ln | 0.23mi | 4/2.0 | 1,776 (+6%) | 1mo | $289,991 | $163 | 78 |
| 3610 Atlas Point Ln | 0.24mi | 4/2.0 | 1,776 (+6%) | 1mo | $291,990 | $164 | 77 |
| 3503 Atlas Point Ln | 0.26mi | 3/2.0 (-1) | 1,792 (+7%) | 2mo | $312,990 | $175 | 69 |
| 1506 Gentle Wind Ct | 0.68mi | 4/2.0 | 1,670 (0%) | 1mo | $275,990 | $165 | 68 |
| 2131 Mosaic Valley Ct | 0.30mi | 3/2.0 (-1) | 1,792 (+7%) | 2mo | $311,990 | $174 | 67 |
| 2935 Summer Breeze Way | 0.68mi | 4/2.0 | 1,670 (0%) | 2mo | $275,990 | $165 | 66 |
| 2142 Mosaic Valley Ct | 0.34mi | 3/2.0 (-1) | 1,792 (+7%) | 2mo | $312,990 | $175 | 65 |
| 3615 Atlas Point Ln | 0.20mi | 3/2.0 (-1) | 1,876 (+12%) | 3mo | $297,990 | $159 | 63 |
| 3606 Atlas Point Ln | 0.24mi | 3/2.0 (-1) | 1,876 (+12%) | 1mo | $296,990 | $158 | 63 |
| 2135 Mosaic Valley Ct | 0.31mi | 3/2.0 (-1) | 1,880 (+13%) | 2mo | $325,990 | $173 | 58 |
| 3139 Savannah Rose Dr | 0.62mi | 3/2.0 (-1) | 1,474 (-12%) | 1mo | $204,040 | $138 | 46 |
| 1535 Gentle Wind Ct | 0.62mi | 3/2.0 (-1) | 1,474 (-12%) | 2mo | $259,990 | $176 | 45 |
Match score weights: distance 35% · size 25% · config 20% · recency 20%. Top-matched comps best support the ARV.
Projected returns pro-forma
-3.0% appreciation · 3.0% rent growth · sell at horizon
- IRR
- -17.1%
- Equity multiple
- 0.39×
- Total profit
- $-46,973
- Equity at exit
- $41,299
- IRR
- -9.0%
- Equity multiple
- 0.44×
- Total profit
- $-43,495
- Equity at exit
- $23,948
Cash invested: $77,555 (down + closing). Projections, not guarantees.
Landlord ↔ Tenant lean methodology
- Overall (STATE)
- 87 Strongly Landlord-Friendly
- State Texas
- 87 Strongly Landlord-Friendly · R+5
- County
- — inherits STATE
- City
- — inherits STATE
ZIP-level market 77515
- Home prices YoY
- -5.1%
- Active inventory
- 932
- Price-to-rent
- 8.8×
Monthly cashflow live
- Estimated rent
- $2,381 medium interval (Pro) →
- Mortgage (P&I)
- −$1,453
- Tax est. 1.5%
- −$346 /mo · $4,155/yr
- Insurance
- −$115
- HOA
- −$0
- Vacancy / Maint / Mgmt
- −$500
- Net cashflow
- $-33
Break-even live
Sensitivity live
| Price | -10% $158 | -5% $62 | +0% $-33 | +5% $-129 | +10% $-225 |
|---|---|---|---|---|---|
| Rent | -10% $-221 | -5% $-127 | +0% $-33 | +5% $61 | +10% $155 |
| Rate | -1.0pp $106 | -0.5pp $37 | base $-33 | +0.5pp $-105 | +1.0pp $-178 |
UW: 25.0% down · 7.5% · 30yr · 1.5% tax · 5.0% vac · 8.0% maint · 8.0% mgmt
Financing live
Cash to close
- Down payment
- $69,246
- Closing costs
- $8,309
- Reserves months
- —
- Total cash needed
- —
Loan-product check · same deal, 3 products live
Conventional
25% down · 7.5% · 30yr
- Down + closing
- —
- Monthly P&I
- —
- Monthly cashflow
- —
- DSCR
- —
- Eligible?
- —
Personal DTI + credit; lowest rate.
DSCR
20% down · 8.5% · 30yr
- Down + closing
- —
- Monthly P&I
- —
- Monthly cashflow
- —
- DSCR
- —
- Eligible?
- —
No personal income docs; deal must DSCR.
Hard money
10% down · 12.0% · 12mo
- Down + closing
- —
- Monthly P&I
- —
- Monthly cashflow
- —
- DSCR
- —
- Eligible?
- —
Short-term bridge; refi at stabilization.
Rent comps 2 comps
| Address | Beds | Baths | Sqft | Rent | $/sqft | DOM | Units | Dist |
|---|---|---|---|---|---|---|---|---|
| 3606 Atlas Point Ln Angleton, TX | 3.0 | 2.0 | 1876 | $2,250 | $1.20 | 0d | 1 | 0.22mi |
| 513 Robin St Angleton, TX | 4.0 | 2.0 | 1900 | $2,495 | $1.31 | 23d | 1 | 1.22mi |
Listing history 18 events
-
2026-06-21days on market $250,990 Active 218 DOM
-
2026-06-18days on market $250,990 Active 215 DOM
-
2026-06-17days on market $250,990 Active 214 DOM
-
2026-06-16days on market $250,990 Active 213 DOM
-
2026-06-15days on market $250,990 Active 212 DOM
-
2026-06-13pricedays on market $250,990 Active 210 DOM
-
2026-06-09days on market $270,990 Active 206 DOM
-
2026-06-08days on market $270,990 Active 205 DOM
-
2026-06-07days on market $270,990 Active 204 DOM
-
2026-06-04days on market $270,990 Active 201 DOM
-
2026-06-03days on market $270,990 Active 200 DOM
-
2026-06-02days on market $270,990 Active 199 DOM
-
2026-06-01days on market $270,990 Active 198 DOM
-
2026-05-31days on market $270,990 Active 197 DOM
-
2025-11-17status Active 403-char remark
Show marketing remark (403 chars)
This single-level home showcases a spacious open floorplan shared between the kitchen, dining area and family room for easy entertaining. An owner's suite enjoys a private location in a rear corner of the home, complemented by an en-suite bathroom and walk-in closet. There are three secondary bedrooms along the side of the home, which are comfortable spaces for household members and overnight guests.
-
2025-11-17price $270,990 403-char remark
Show marketing remark (403 chars)
This single-level home showcases a spacious open floorplan shared between the kitchen, dining area and family room for easy entertaining. An owner's suite enjoys a private location in a rear corner of the home, complemented by an en-suite bathroom and walk-in closet. There are three secondary bedrooms along the side of the home, which are comfortable spaces for household members and overnight guests.
-
2024-03-14historical 403-char remark
Show marketing remark (403 chars)
This single-level home showcases a spacious open floorplan shared between the kitchen, dining area and family room for easy entertaining. An owner's suite enjoys a private location in a rear corner of the home, complemented by an en-suite bathroom and walk-in closet. There are three secondary bedrooms along the side of the home, which are comfortable spaces for household members and overnight guests.
-
2024-03-12$510,000 Active 403-char remark
Show marketing remark (403 chars)
This single-level home showcases a spacious open floorplan shared between the kitchen, dining area and family room for easy entertaining. An owner's suite enjoys a private location in a rear corner of the home, complemented by an en-suite bathroom and walk-in closet. There are three secondary bedrooms along the side of the home, which are comfortable spaces for household members and overnight guests.
ⓘ Source: listings_history table (triggers on properties + properties_extension) + one-shot
backfill from property_details.listing_events for pre-trigger history.
Climate risk First Street
- Flood 1/10 Low FEMA zone X (unshaded) · 0% chance over 30 yrs
- Wildfire 4/10 Moderate
- Heat 9/10 Extreme 6 d/yr ≥111°F today · 21 d/yr by 30 yrs out
- Wind 9/10 Extreme 99% chance of damaging wind over 30 yrs
- Air quality 2/10 Low 1 unhealthy d/yr today · 1 by 30 yrs out
Nearby sold comps map
Loading sold comps map…
Walkable amenities ~0.75 mi
Loading nearby amenities…
Taxation est. · year 1
- Rental income
- $28,569
- − Mortgage interest
- −$15,515
- − Property taxes
- −$4,155
- − Insurance
- −$1,385
- − Repairs & maintenance
- −$2,286
- − Management
- −$2,286
- − Depreciation
- −$8,058
- Taxable loss
- −$5,115
- Est. tax savings @ 24.0%
- +$1,228
- After-tax cash flow
- $827/yr
For passive investors: Depreciation is non-cash, so a rental often shows a tax loss while cash-flowing — sheltering income. Rental losses are passive: they offset passive income freely, and up to $25,000/yr can offset ordinary (W-2) income if you actively participate and your MAGI is under $100k (phasing out to $0 by $150k); unused losses carry forward. On sale, claimed depreciation is recaptured at up to 25%, and gains may owe capital-gains tax (a 1031 exchange can defer both). Figures are a year-1 estimate at your 24.0% rate — not tax advice; consult a CPA.
Schools (NCES district)
- District
- Angleton ISD
- NCES district ID
- 4808310
- Math proficiency
- 36% ▼ -8.00%
- Reading proficiency
- 44% ▲ 1.00%
- Median HH income
- $55,670
- Composite
- 35.01/100
- National rank
- #5046
- State rank
- #375 of 826 in TX
Livability — Angleton
- Score
- 74/100
- State rank
- #171
- US rank
- #4520
Category grades
Schools grade is shown separately in the Schools card above.
Census & demographics
- County
- Brazoria County · 374,982 people
- City population
- 34,088
- Metro
- Houston-The Woodlands-Sugar Land, TX
- Population (ZIP)
- 34,088
- Household income
- $88,787
- Rent vs Own
- Severe rent burden
- 785.0
Population outlook (Brazoria County) Hauer SSP2
- Today (2025)
- 420,414 people
- By 2030
- 457,585 · +8.8%
- By 2040
- 532,232 · +26.6%
- By 2050
- 605,399 · +44.0%
- By 2075
- 779,358 · +85.4%
- By 2100
- 883,759 · +110.2%
Race, ethnicity, and origin ACS 2023
- Neighborhood character
- Diverse neighborhood (Simpson 0.58)
- Race & ethnicity
- White 55% Hispanic / Latino 33% Two or more races 18% Black 8% Asian 2%
- Hispanic origin (detail)
- Mexican 28%
- Common ancestry
- Lithuanian 3% Romanian 2% Slovak 1%
- Foreign-born
- 8% · Canada, Vietnam
- Languages at home
- 78% English-only · Spanish 20% Other Asian/Pacific 1%
Political lean MEDSL · Brazoria
- 2024 margin
- R (+19.7) · D 39.5% · R 59.2% · Other 1.3%
- 2008→2024 swing
- +9.9pp toward D · 2008: -29.6pp · 2024: -19.7pp
- All cycles
- 2024: R+19.7 2020: R+18.2 2016: R+24.6 2012: R+34.2 2008: R+29.6
Not yet ingested
- Civics
- —
Market trends
- HPI YoY
- ▼ -15.59%
- Current HPI
- 288.7286
- Rent YoY
- —
- Metro
- Houston-The Woodlands-Sugar Land, TX
- State GDP YoY
- ▲ 3.95%
- F500 in state
- 110
Industry mix (Fortune 500 HQ in TX)
| Industry | F500 HQs | Revenue |
|---|---|---|
| Energy | 16 | $1,198B |
|
||
| Technology | 5 | $198B |
|
||
| Engineering / Construction | 4 | $72B |
|
||
| Energy Services | 3 | $60B |
|
||
| Utilities | 3 | $41B |
|
||
| Healthcare | 2 | $330B |
|
||
Price history
-46.9% since first listed4 events — show timeline
- 2025-11-17 Relisted — Zillow
- 2025-11-17 Price Changed $270,990 Zillow
- 2024-03-14 Delisted — Zillow
- 2024-03-12 Listed $510,000 Zillow
Cash-flow waterfall
monthlySold comps — $/sqft
last 12 mo · ≤1 miLoading sold comps…