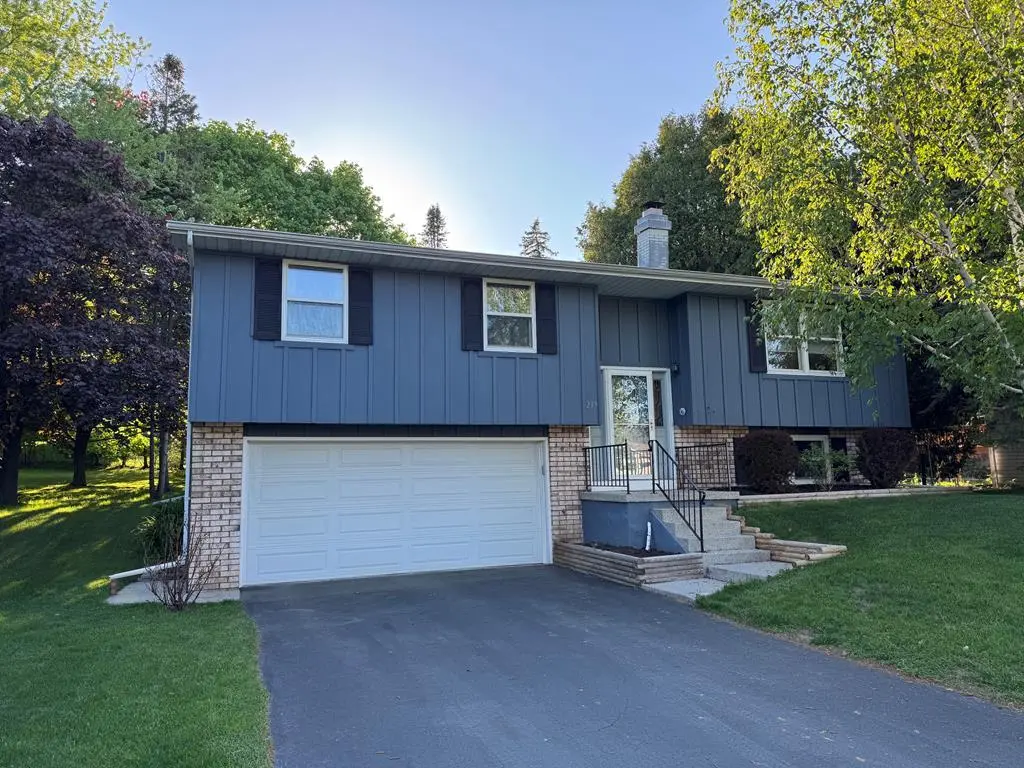
239 N 12th Ave · Sturgeon Bay, WI
Flood risk 1/10 · Minimal
- FEMA flood zone
- X (unshaded)
- Chance of flooding over 30 yrs
- 0.0%
- Est. flood insurance / yr
- $473 – $860
Fire risk 1/10 · Minimal
- Est. fire insurance / yr
- $636 – $1,182
Heat risk 1/10 · Minimal
- Hot days now (above 91°F)
- 7 days/yr
- Hot days in 30 yrs
- 13 days/yr
Wind risk 1/10 · Minimal
- Chance of severe wind over 30 yrs
- —
Air-quality risk 2/10 · Minimal
- Unhealthy air days now
- 1 days/yr
- Unhealthy air days in 30 yrs
- 1 days/yr
Risk factors via First Street. Map © Google.
Why this score? — see what drove the C grade
The composite is a weighted blend of 9 inputs, each scored 0–100. Each bar is that input's sub-score; the figure is the points it added to the 100-point composite (weight × sub-score).
- Cash flow +18.9/30.0
- ARV discount +15.0/15.0
- DSCR +5.9/10.0
- 1% rule +4.6/10.0
- Livability +3.9/5.0
- Schools +3.3/10.0
- Rent growth +2.5/5.0
- Condition / age +2.5/5.0
- Appreciation +0.0/10.0
$365,000
🖨 Deal sheet 📄 Offer letter ✓ Due diligence
Listing remarks
This home offers a spacious open concept area for family gatherings, newer SS appliances, primary bedroom with ensuite, walk-in closet, and family room in LL with cozy wood burning fireplace. Step outside to a Trex deck overlooking a quiet, private, tree lined backyard—perfect for sunsets, gardening, yard games, or evenings around the fire pit. Newer roof, windows, front door, patio door, boiler, remote blinds and more (See list for all updates). Convenient location to Sturgeon Bay schools, shopping, hospital, YMCA, bike & walking path and downtown amenities. Open House, , Saturday, May 30th | 2 PM - 4PM
Key facts
- Walk-in closet
- Newer roof
- Open concept area
Tags
Property features AI
Exterior
- Parking: Attached garage with 2 spaces; Garage door opener; Paved parking
- Security: Smoke detector(s)
- Utilities: Natural gas available
- Home design: Single-family residential property; Inland location
- Exterior features: Deck; Porch; Outbuilding
Interior
- Bathrooms: 2 full bathrooms; 1 half bathroom
- Heating & cooling: Hot water heating (natural gas); Wall cooling unit(s)
- Interior features: Walk-in closet(s); Window coverings; Basement with sump pump
Neighborhood map
What this means for you Summary
Snapshot
- This is a 4-bed/2.5-bath single-family listed at $365k.
Deal economics
- At list price, monthly cash flow is $372 ($4k/yr) — positive.
- The deal already cash-flows at list — no discount required.
- To meet the 1% rule (rent ≥ 1% of price), the offer needs to be $350k (4.1% below list).
- Recommended offer: $350k (4.1% below list) — sets the bar for 1% rule.
- Cap rate 7.5% vs local median 2.6% in Sturgeon Bay — top-decile yield for the area; either an underpriced asset or a hidden risk that comps aren't pricing in. Stress-test before assuming the spread holds.
Location & tenants
- Location reads 77/100 on livability (#113 in WI, #2,936 nationally) — a middle-class / working-renter tenant base. Strengths: crime A+, cost of living A+, housing A+; Watch: amenities F, commute F.
- Sturgeon Bay School District (town): math 38% / reading 40% proficiency, ranked #178 of 342 in WI (top 52%) — families likely to look elsewhere, expect single-tenant / working-renter base with shorter leases.
- Market conditions: 200 active listings in the ZIP; 1 comparable units currently listed for rent nearby; 306 units permitted in Door County in 2024 (0 in 5+ unit buildings).
Forward outlook
- Local home prices are declining (-3.0%/yr); year-one equity from $3k of loan paydown is wiped out by about $11k of value loss. Plan a longer hold.
- Door County population projected at -15% by 2050 — secular population decline; favor cash flow + early exit over multi-decade hold.
Negotiation context
- It's been on market 20 days — a 2% lower offer ($360k) is reasonable based on typical stale-listing flexibility.
Questions for the listing agent
- Built in 1976 — when were the roof, HVAC, electrical panel, plumbing, and water heater last replaced?
- Is there a deadline driving the sale (1031 exchange, divorce, estate, relocation)? That informs how much negotiation room exists.
- What's the average days-on-market for RENTAL listings here right now (not sales)? A rising rental-DOM trend means longer vacancies and softer asking-rent achievability than the comps imply.
- What's the recent tenant-quality profile in this submarket — average credit score on applications, eviction rate, late-payment / NSF rate, and stable-employment percentage? A property-management company in the area should have these aggregated.
- How much new for-sale + rental construction is in the pipeline within 1–3 miles? Heavy new supply typically softens prices + rents 12–24 months out; constrained supply supports both.
Investment metrics
- 1% rule
- 0.96% ✗
- Cap rate
- 7.52%
- Cash-on-cash
- 4.37%
- DSCR
- 1.19
- GRM
- 8.7
CMA / ARV
- ARV (on-the-fly)
- $456,638
- Comps found
- 12
Show comp detail 12 sales within ~0.75 mi
| Address | Dist | Beds/Ba | Sqft | Sold | Price | $/sf | Match |
|---|---|---|---|---|---|---|---|
| 146 N 9th Ave | 0.23mi | 3/1.5 (-1) | 2,264 (-4%) | 5mo | $375,000 | $166 | 69 |
| 1029 Pennsylvania St | 0.44mi | 4/2.0 | 2,386 (+1%) | 10mo | $404,900 | $170 | 68 |
| 427 N 16th Dr | 0.51mi | 4/2.5 | 2,316 (-2%) | 9mo | $550,000 | $237 | 65 |
| 219 N 15th Ct | 0.33mi | 4/3.0 | 2,174 (-8%) | 10mo | $380,000 | $175 | 60 |
| 22 S 5th Ave | 0.53mi | 4/— | 2,551 (+8%) | 4mo | $172,000 | $67 | 59 |
| 1829 Jefferson Dr | 0.71mi | 3/2.5 (-1) | 2,371 (+0%) | 11mo | $458,275 | $193 | 52 |
| 808 Superior St | 0.67mi | 5/2.0 (+1) | 2,450 (+4%) | 6mo | $530,000 | $216 | 51 |
| 1753 Michigan St | 0.68mi | 3/2.0 (-1) | 2,232 (-6%) | 9mo | $270,000 | $121 | 44 |
| 812 Belmar Pl | 0.67mi | 4/2.0 | 2,094 (-12%) | 6mo | $329,000 | $157 | 43 |
| 331 N 17th Dr | 0.56mi | 4/3.0 | 2,046 (-14%) | 11mo | $526,400 | $257 | 40 |
| 241 N 17th Dr | 0.57mi | 3/2.5 (-1) | 2,088 (-12%) | 12mo | $447,000 | $214 | 39 |
| 337 N 18th Ave | 0.62mi | 3/2.0 (-1) | 2,122 (-10%) | 11mo | $520,000 | $245 | 38 |
Match score weights: distance 35% · size 25% · config 20% · recency 20%. Top-matched comps best support the ARV.
Projected returns pro-forma
-3.0% appreciation · 3.0% rent growth · sell at horizon
- IRR
- -9.5%
- Equity multiple
- 0.65×
- Total profit
- $-35,475
- Equity at exit
- $54,423
- IRR
- -0.1%
- Equity multiple
- 1.00×
- Total profit
- $-485
- Equity at exit
- $31,559
Cash invested: $102,200 (down + closing). Projections, not guarantees.
Landlord ↔ Tenant lean methodology
- Overall (STATE)
- 73 Landlord-Friendly
- State Wisconsin
- 73 Landlord-Friendly · R+2
- County
- — inherits STATE
- City
- — inherits STATE
ZIP-level market 54235
- Active inventory
- 200
- Price-to-rent
- 8.7×
Monthly cashflow live
- Estimated rent
- $3,500 medium interval (Pro) →
- Mortgage (P&I)
- −$1,914
- Tax from tax record
- −$327 /mo · $3,921/yr
- Insurance
- −$152
- HOA
- −$0
- Vacancy / Maint / Mgmt
- −$735
- Net cashflow
- $372
Break-even live
UW: 25.0% down · 7.5% · 30yr · 1.5% tax · 5.0% vac · 8.0% maint · 8.0% mgmt
Financing live
Cash to close
- Down payment
- $91,250
- Closing costs
- $10,950
- Reserves months
- —
- Total cash needed
- —
Loan-product check · same deal, 3 products live
Conventional
25% down · 7.5% · 30yr
- Down + closing
- —
- Monthly P&I
- —
- Monthly cashflow
- —
- DSCR
- —
- Eligible?
- —
Personal DTI + credit; lowest rate.
DSCR
20% down · 8.5% · 30yr
- Down + closing
- —
- Monthly P&I
- —
- Monthly cashflow
- —
- DSCR
- —
- Eligible?
- —
No personal income docs; deal must DSCR.
Hard money
10% down · 12.0% · 12mo
- Down + closing
- —
- Monthly P&I
- —
- Monthly cashflow
- —
- DSCR
- —
- Eligible?
- —
Short-term bridge; refi at stabilization.
Rent comps 1 comps
| Address | Beds | Baths | Sqft | Rent | $/sqft | DOM | Units | Dist |
|---|---|---|---|---|---|---|---|---|
| 610 Jefferson St Unit 1 Sturgeon Bay, WI | 4.0 | 2.0 | 2150 | $3,500 | $1.63 | 43d | 1 | 0.49mi |
Listing history 17 events
-
2026-06-18days on market $365,000 Active 20 DOM
-
2026-06-17days on market $365,000 Active 19 DOM
-
2026-06-16days on market $365,000 Active 18 DOM
-
2026-06-15days on market $365,000 Active 17 DOM
-
2026-06-15days on market $365,000 Active 16 DOM
-
2026-06-13days on market $365,000 Active 15 DOM
-
2026-06-12days on market $365,000 Active 14 DOM
-
2026-06-09days on market $365,000 Active 11 DOM
-
2026-06-08days on market $365,000 Active 10 DOM
-
2026-06-08days on market $365,000 Active 9 DOM
-
2026-06-05days on market $365,000 Active 7 DOM
-
2026-06-04days on market $365,000 Active 6 DOM
-
2026-06-03days on market $365,000 Active 5 DOM
-
2026-06-02days on market $365,000 Active 4 DOM
-
2026-06-01days on market $365,000 Active 3 DOM
-
2026-05-31days on market $365,000 Active 2 DOM
-
2026-05-29$365,000 Active
ⓘ Source: listings_history table (triggers on properties + properties_extension) + one-shot
backfill from property_details.listing_events for pre-trigger history.
Tax reassessment forecast WI · Partial reset (capped growth)
- Current annual tax
- $3,921 · $327/mo
- Projected year-2 tax
- $5,337 · $445/mo
- Expected delta
- +$1,416/yr (+$118/mo · 36.1%)
ⓘ Screening estimate from a state-policy table — verify with the county assessor before closing.
Climate risk First Street
- Flood 1/10 Low FEMA zone X (unshaded) · 0% chance over 30 yrs
- Wildfire 1/10 Low
- Heat 1/10 Low 7 d/yr ≥91°F today · 13 d/yr by 30 yrs out
- Wind 1/10 Low
- Air quality 2/10 Low 1 unhealthy d/yr today · 1 by 30 yrs out
Nearby sold comps map
Loading sold comps map…
Walkable amenities ~0.75 mi
Loading nearby amenities…
Taxation est. · year 1
- Rental income
- $42,000
- − Mortgage interest
- −$20,446
- − Property taxes
- −$3,921
- − Insurance
- −$1,825
- − Repairs & maintenance
- −$3,360
- − Management
- −$3,360
- − Depreciation
- −$10,618
- Taxable loss
- −$1,530
- Est. tax savings @ 24.0%
- +$367
- After-tax cash flow
- $4,832/yr
For passive investors: Depreciation is non-cash, so a rental often shows a tax loss while cash-flowing — sheltering income. Rental losses are passive: they offset passive income freely, and up to $25,000/yr can offset ordinary (W-2) income if you actively participate and your MAGI is under $100k (phasing out to $0 by $150k); unused losses carry forward. On sale, claimed depreciation is recaptured at up to 25%, and gains may owe capital-gains tax (a 1031 exchange can defer both). Figures are a year-1 estimate at your 24.0% rate — not tax advice; consult a CPA.
Schools (NCES district)
- District
- Sturgeon Bay School District
- NCES district ID
- 5514610
- Math proficiency
- 38% ▼ -12.00%
- Reading proficiency
- 40% ▼ -5.00%
- Median HH income
- $46,705
- Composite
- 33.35/100
- National rank
- #5489
- State rank
- #178 of 342 in WI
Livability — Sturgeon Bay
- Score
- 77/100
- State rank
- #113
- US rank
- #2936
Category grades
Schools grade is shown separately in the Schools card above.
Census & demographics
- Census place
- Sturgeon Bay, WI
- City population
- 17,845
- Population (ZIP)
- 17,845
Population outlook (Door County) Hauer SSP2
- Today (2025)
- 27,220 people
- By 2030
- 26,785 · -1.6%
- By 2040
- 25,167 · -7.5%
- By 2050
- 23,052 · -15.3%
- By 2075
- 18,981 · -30.3%
- By 2100
- 14,801 · -45.6%
Race, ethnicity, and origin ACS 2023
- Neighborhood character
- Predominantly White (91%)
- Race & ethnicity
- White 91% Hispanic / Latino 5% Two or more races 5% Native American 1%
- Common ancestry
- Portuguese 8% English 7% Romanian 6%
- Foreign-born
- 2% · Canada
- Languages at home
- 96% English-only · Spanish 3%
Political lean MEDSL · Door
- 2024 margin
- Toss-up / Even · D 50.6% · R 48.3% · Other 1.1%
- 2008→2024 swing
- -15.1pp toward R · 2008: 17.3pp · 2024: 2.2pp
- All cycles
- 2024: D+2.2 2020: D+1.4 2016: R+3.2 2012: D+7.0 2008: D+17.3
Not yet ingested
- Civics
- —
Market trends
- HPI YoY
- ▼ -159.61%
- Current HPI
- 197.0112
- Rent YoY
- —
- Metro
- —
- State GDP YoY
- ▲ 2.10%
- F500 in state
- 20
Industry mix (Fortune 500 HQ in WI)
| Industry | F500 HQs | Revenue |
|---|---|---|
| Industrial Machinery | 4 | $23B |
|
||
| Industrial Technology | 2 | $36B |
|
||
| Insurance | 1 | $36B |
|
||
| Professional Services | 1 | $19B |
|
||
| Utilities | 1 | $9B |
|
||
| Consumer Goods | 1 | $3B |
|
||
Price history
1 event — show timeline
- 2026-05-29 Listed $365,000 DCBRMLS
Property tax history
+2.8%/yrLatest (2025): $3,921 · -3.7% YoY. Source: county tax records.
Cash-flow waterfall
monthlySold comps — $/sqft
last 12 mo · ≤1 miLoading sold comps…