 Duplex
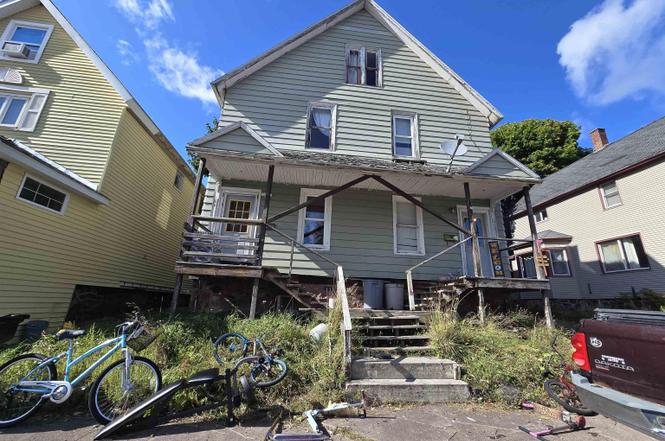
139 S Pewabic St Unit 141 S Pewabic Street · Calumet, MI
Flood risk 1/10 · Minimal
- FEMA flood zone
- —
- Chance of flooding over 30 yrs
- 0.0%
- Est. flood insurance / yr
- —
Fire risk 2/10 · Minimal
- Est. fire insurance / yr
- $784 – $1,456
Heat risk 1/10 · Minimal
- Hot days now (above 89°F)
- 7 days/yr
- Hot days in 30 yrs
- 12 days/yr
Wind risk 1/10 · Minimal
- Chance of severe wind over 30 yrs
- —
Air-quality risk 1/10 · Minimal
- Unhealthy air days now
- 0 days/yr
- Unhealthy air days in 30 yrs
- 0 days/yr
Risk factors via First Street. Map © Google.
Why this score? — see what drove the B- grade
The composite is a weighted blend of 9 inputs, each scored 0–100. Each bar is that input's sub-score; the figure is the points it added to the 100-point composite (weight × sub-score).
- Cash flow +30.0/30.0
- 1% rule +10.0/10.0
- DSCR +10.0/10.0
- ARV discount +7.5/15.0
- Schools +3.8/10.0
- Livability +3.0/5.0
- Rent growth +2.5/5.0
- Condition / age +2.5/5.0
- Appreciation +0.0/10.0
$90,000
🖨 Deal sheet 📄 Offer letter ✓ Due diligence
Multi-family units
County records classify this as Multi-Family (2-4 Unit). Listing-text estimate: 2 units. confirmed
Listing remarks
Great opportunity to own an income property! This 4 bedroom 2 bathroom duplex is close proximity to Calumet and Laurium amenities. Each side has a main living area, dining room and an eat-in kitchen. Upstairs there are two bedrooms and a full bathroom. There is also a third floor that has two additional finished spaces with flexibility of use on each side of duplex. Come visit this property and see what it has to offer! "NOTICE: All information believed accurate but not warranted. Buyer recommended to inspect & verify all aspects of the property & bares all risks for any inaccuracies including but not limited to estimated acreage, lot location/size, square footage, utilit
Key facts
- Main living area
- Dining room
- Eat-in kitchen
Tags
Property features AI
Finance
- Financial info: Property is a two-unit multi-family (both units occupied); Unit 1 rent listed at $550; Unit 2 rent listed at $550; Lease terms include 1–2 year leases and month-to-month options
Exterior
- Parking: Two parking spaces; On-street parking available
- Utilities: Public water; Public sanitary sewer; Natural gas connected; Electricity connected (100 amp service); Phone connected; Electric water heater; Separate utilities for each unit (separate heat, electric, gas, water)
- Home design: Multi-family duplex (1 to 4 units); More than two stories; Built in 1920; Village location (Laurium)
- Construction: Vinyl siding construction; Basement foundation; Year built 1920
- Exterior features: Vinyl siding; Platted lot; Paved, year-round city/county road access; Frontage approx. 50 feet; No water features
Interior
- Kitchen: Range/oven; Refrigerator; Eat-in kitchen (both units have main-level kitchens)
- Bedrooms: Unit 1: Two bedrooms (both on the second level); Unit 2: Two bedrooms (both on the second level; approx. 13 x 11 and 13 x 12)
- Bathrooms: Two full bathrooms (total for property)
- Heating & cooling: Forced air heating; No central cooling listed
- Interior features: Basement present (mi basement); Eat-in kitchen; Two total bathrooms
- Laundry & utility: Separate utilities for units (separate heat, electric, gas, and water indicated)
Neighborhood map
What this means for you Summary
Snapshot
- This is a 2 × 2-bed/1.0-bath units multifamily listed at $90k.
Deal economics
- At list price, monthly cash flow is $1k ($12k/yr) — positive. Per door: $517/mo.
- The deal already cash-flows at list — no discount required.
- Meets the 1% rule at list price ($2k rent vs $90k).
- Recommended offer: $79k (12.0% below list) — sets the bar for market timing.
- Cap rate 20.1% vs local median 5.2% in Calumet — top-decile yield for the area; either an underpriced asset or a hidden risk that comps aren't pricing in. Stress-test before assuming the spread holds.
Location & tenants
- Location reads 60/100 on livability (#585 in MI) — a middle-class / working-renter tenant base. Strengths: cost of living A+, housing A; Watch: health & safety C-, schools D, crime F.
- Public Schools Of Calumet Laurium & Keweenaw (town): math 37% / reading 54% proficiency, ranked #160 of 540 in MI (top 30%) — families likely to look elsewhere, expect single-tenant / working-renter base with shorter leases.
- Market conditions: 48 active listings in the ZIP; 111 units permitted in Houghton County in 2024 (0 in 5+ unit buildings).
Forward outlook
- Local home prices are declining (-3.0%/yr); year-one equity from $622 of loan paydown is wiped out by about $3k of value loss. Plan a longer hold.
- Houghton County population projected to shrink 10% by 2050 — rents likely to lag national; underwrite the cash flow, not the appreciation.
- At projected returns (-3.0% appreciation + 3.0% rent growth), your $25k cash investment doubles in ~3 years — after that, you're playing with house money.
Negotiation context
- It's been on market 276 days — a 12% lower offer ($79k) is reasonable based on typical stale-listing flexibility.
- 3 sale attempts with the ask held roughly flat each time — persistent listings suggest the price (not the market) is what's stuck; bring a comps-based counter.
Risks & watch-outs
- Watch-outs: built in 1920 — expect roof / HVAC / electrical / plumbing capex.
Questions for the listing agent
- It's been on market 276 days. Have you received any prior offers? Is the seller open to a 12% concession, seller financing, or rate buy-down credit?
- Can we see the unit-by-unit rent roll, current vacancy, and any below-market leases? What's the average tenancy length?
- What capital expenditures (roof, boiler, parking lot, exteriors) have been made in the last 5 years, and what's planned in the next 2?
- Built in 1920 — when were the roof, HVAC, electrical panel, plumbing, and water heater last replaced?
- Why hasn't it sold? Are there any deal-killer items the seller is aware of (foundation, flood, title, zoning, code violations)?
- Is there a deadline driving the sale (1031 exchange, divorce, estate, relocation)? That informs how much negotiation room exists.
- Schools are D-rated, which usually means shorter tenancies and higher turnover. Who's the typical renter profile here, and what's been the actual vacancy rate?
- Crime grade is F in this area — have there been break-ins, vandalism, or insurance claims at this property in the last 3 years? What carrier currently insures it and at what premium?
- What's the average days-on-market for RENTAL listings here right now (not sales)? A rising rental-DOM trend means longer vacancies and softer asking-rent achievability than the comps imply.
- What's the recent tenant-quality profile in this submarket — average credit score on applications, eviction rate, late-payment / NSF rate, and stable-employment percentage? A property-management company in the area should have these aggregated.
- How much new apartment / multifamily construction is in the pipeline within 1–3 miles? Heavy new supply (>2% of stock underway) typically softens rents 12–24 months out; light construction supports rent growth.
Investment metrics
- 1% rule
- 2.33% ✓
- Cap rate
- 20.08%
- Cash-on-cash
- 49.23%
- DSCR
- 3.19
- GRM
- 3.6
CMA / ARV
No comps found within radius.
Projected returns pro-forma
-3.0% appreciation · 3.0% rent growth · sell at horizon
- IRR
- 46.9%
- Equity multiple
- 3.04×
- Total profit
- $51,296
- Equity at exit
- $13,419
- IRR
- 52.6%
- Equity multiple
- 6.14×
- Total profit
- $129,585
- Equity at exit
- $7,782
Cash invested: $25,200 (down + closing). Projections, not guarantees.
Landlord ↔ Tenant lean methodology
- Overall (STATE)
- 62 Landlord-Friendly
- State Michigan
- 62 Landlord-Friendly · EVEN
- County
- — inherits STATE
- City
- — inherits STATE
ZIP-level market 49913
- Active inventory
- 48
- Price-to-rent
- 7.2×
Monthly cashflow live
- Estimated rent
- $2,096 medium interval (Pro) →
- Mortgage (P&I)
- −$472
- Tax est. 1.5%
- −$112 /mo · $1,350/yr
- Insurance
- −$38
- HOA
- −$0
- Vacancy / Maint / Mgmt
- −$440
- Net cashflow
- $1,034
Break-even live
2-unit breakdown (identical units grouped — click to expand)
| Units | Beds | Baths | Est. rent |
|---|---|---|---|
| 2× units | 2 | 1 | $2,096 |
| #1 | 2 | 1 | $1,048 |
| #2 | 2 | 1 | $1,048 |
| Total (2 units) | $2,096 | ||
UW: 25.0% down · 7.5% · 30yr · 1.5% tax · 5.0% vac · 8.0% maint · 8.0% mgmt
Financing live
Cash to close
- Down payment
- $22,500
- Closing costs
- $2,700
- Reserves months
- —
- Total cash needed
- —
Loan-product check · same deal, 3 products live
Conventional
25% down · 7.5% · 30yr
- Down + closing
- —
- Monthly P&I
- —
- Monthly cashflow
- —
- DSCR
- —
- Eligible?
- —
Personal DTI + credit; lowest rate.
DSCR
20% down · 8.5% · 30yr
- Down + closing
- —
- Monthly P&I
- —
- Monthly cashflow
- —
- DSCR
- —
- Eligible?
- —
No personal income docs; deal must DSCR.
Hard money
10% down · 12.0% · 12mo
- Down + closing
- —
- Monthly P&I
- —
- Monthly cashflow
- —
- DSCR
- —
- Eligible?
- —
Short-term bridge; refi at stabilization.
Listing history 20 events
-
2026-06-18days on market $90,000 Active 276 DOM
-
2026-06-17days on market $90,000 Active 275 DOM
-
2026-06-16days on market $90,000 Active 274 DOM
-
2026-06-15days on market $90,000 Active 273 DOM
-
2026-06-13days on market $90,000 Active 271 DOM
-
2026-06-12days on market $90,000 Active 270 DOM
-
2026-06-09days on market $90,000 Active 267 DOM
-
2026-06-08days on market $90,000 Active 266 DOM
-
2026-06-07days on market $90,000 Active 265 DOM
-
2026-06-07days on market $90,000 Active 264 DOM
-
2026-06-04days on market $90,000 Active 261 DOM
-
2026-06-02days on market $90,000 Active 260 DOM
-
2026-06-01days on market $90,000 Active 259 DOM
-
2026-05-31days on market $90,000 Active 258 DOM
-
2026-05-31days on market $90,000 Active 257 DOM
-
2026-04-30status Active
-
2026-04-14status Keep Showing-Contgcy Appl
-
2026-04-11historical
-
2026-04-09historical Keep Showing-Contgcy Appl
-
2025-09-11$90,000 Active
ⓘ Source: listings_history table (triggers on properties + properties_extension) + one-shot
backfill from property_details.listing_events for pre-trigger history.
Climate risk First Street
- Flood 1/10 Low 0% chance over 30 yrs
- Wildfire 2/10 Low
- Heat 1/10 Low 7 d/yr ≥89°F today · 12 d/yr by 30 yrs out
- Wind 1/10 Low
- Air quality 1/10 Low 0 unhealthy d/yr today · 0 by 30 yrs out
Nearby sold comps map
Loading sold comps map…
Walkable amenities ~0.75 mi
Loading nearby amenities…
Taxation est. · year 1
- Rental income
- $25,152
- − Mortgage interest
- −$5,041
- − Property taxes
- −$1,350
- − Insurance
- −$450
- − Repairs & maintenance
- −$2,012
- − Management
- −$2,012
- − Depreciation
- −$2,618
- Taxable income
- $11,668
- Est. tax owed @ 24.0%
- −$2,800
- After-tax cash flow
- $9,606/yr
For passive investors: Depreciation is non-cash, so a rental often shows a tax loss while cash-flowing — sheltering income. Rental losses are passive: they offset passive income freely, and up to $25,000/yr can offset ordinary (W-2) income if you actively participate and your MAGI is under $100k (phasing out to $0 by $150k); unused losses carry forward. On sale, claimed depreciation is recaptured at up to 25%, and gains may owe capital-gains tax (a 1031 exchange can defer both). Figures are a year-1 estimate at your 24.0% rate — not tax advice; consult a CPA.
Schools (NCES district)
- District
- Public Schools Of Calumet Laurium & Keweenaw
- NCES district ID
- 2607690
- Math proficiency
- 37% ▼ -7.00%
- Reading proficiency
- 54% ▲ 2.00%
- Median HH income
- $34,585
- Composite
- 37.51/100
- National rank
- #4398
- State rank
- #160 of 540 in MI
Livability — Calumet
- Score
- 60/100
- State rank
- #585
- US rank
- #18953
Category grades
Schools grade is shown separately in the Schools card above.
Census & demographics
- Census place
- Laurium, MI
- Population (ZIP)
- 7,483
Population outlook (Houghton County) Hauer SSP2
- Today (2025)
- 35,073 people
- By 2030
- 34,645 · -1.2%
- By 2040
- 33,248 · -5.2%
- By 2050
- 31,625 · -9.8%
- By 2075
- 28,105 · -19.9%
- By 2100
- 23,274 · -33.6%
Race, ethnicity, and origin ACS 2023
- Neighborhood character
- Predominantly White (94%)
- Race & ethnicity
- White 94% Two or more races 3% Asian 2% Hispanic / Latino 2%
- Common ancestry
- Lithuanian 4% Iranian 4% Romanian 2%
- Foreign-born
- 3% · China, Canada
- Languages at home
- 95% English-only · Chinese 1% Spanish 1% German/W. Germanic 1%
Political lean MEDSL · Houghton
- 2024 margin
- R (+17.0) · D 40.7% · R 57.7% · Other 1.6%
- 2008→2024 swing
- -13.1pp toward R · 2008: -3.9pp · 2024: -17.0pp
- All cycles
- 2024: R+17.0 2020: R+14.2 2016: R+15.7 2012: R+10.2 2008: R+3.9
Not yet ingested
- Civics
- —
Market trends
- HPI YoY
- ▼ -71.04%
- Current HPI
- 131.8527
- Rent YoY
- —
- Metro
- —
- State GDP YoY
- ▲ 1.37%
- F500 in state
- 28
Industry mix (Fortune 500 HQ in MI)
| Industry | F500 HQs | Revenue |
|---|---|---|
| Automotive Parts | 3 | $48B |
|
||
| Automotive | 2 | $372B |
|
||
| Chemicals | 1 | $45B |
|
||
| Automotive Retail | 1 | $29B |
|
||
| Healthcare / Medical Devices | 1 | $23B |
|
||
| Automotive Technology | 1 | $20B |
|
||
Price history
5 events — show timeline
- 2026-04-30 Relisted — MiRealSource-MiMLS
- 2026-04-14 Relisted — MiRealSource-MiMLS
- 2026-04-11 Listing Removed — MiRealSource-MiMLS
- 2026-04-09 Contingent — MiRealSource-MiMLS
- 2025-09-11 Listed $90,000 MiRealSource-MiMLS
Cash-flow waterfall
monthlySold comps — $/sqft
last 12 mo · ≤1 miLoading sold comps…