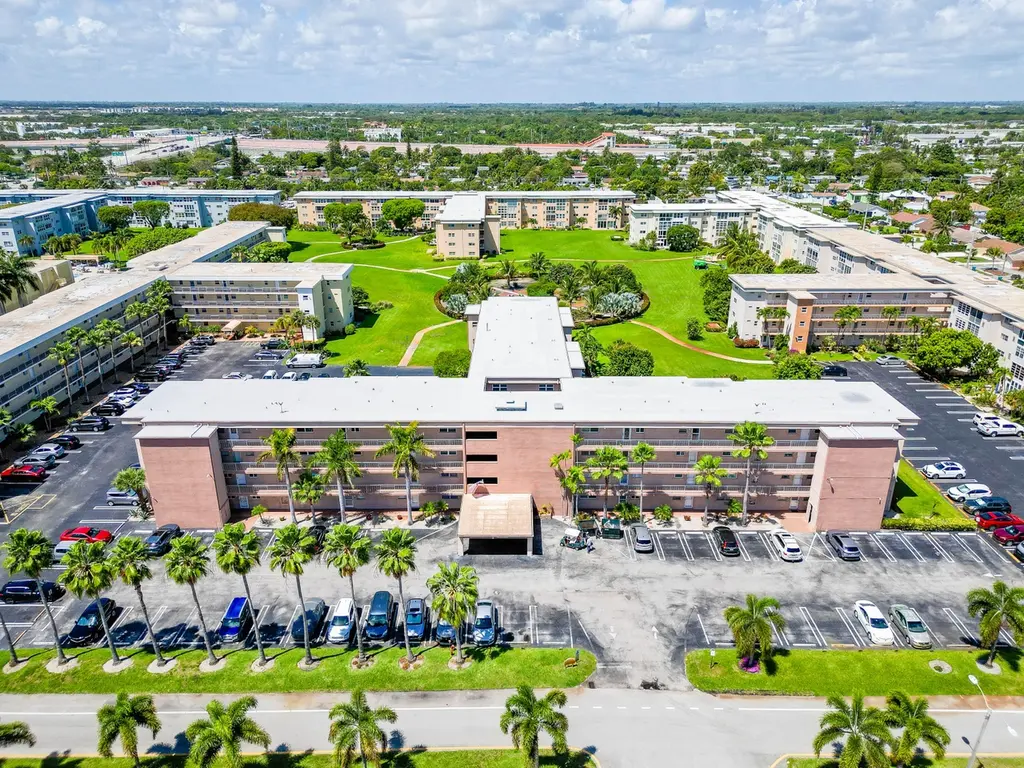
2615 NE 1st Ct #411 · Boynton Beach, FL
Flood risk 1/10 · Minimal
- FEMA flood zone
- X (unshaded)
- Chance of flooding over 30 yrs
- 0.0%
- Est. flood insurance / yr
- $507 – $1,088
Fire risk 1/10 · Minimal
- Est. fire insurance / yr
- $947 – $1,759
Heat risk 9/10 · Severe
- Hot days now (above 105°F)
- 7 days/yr
- Hot days in 30 yrs
- 26 days/yr
Wind risk 10/10 · Severe
- Chance of severe wind over 30 yrs
- 99.0%
Air-quality risk 2/10 · Minimal
- Unhealthy air days now
- 0 days/yr
- Unhealthy air days in 30 yrs
- 2 days/yr
Risk factors via First Street. Map © Google.
Why this score? — see what drove the D grade
The composite is a weighted blend of 9 inputs, each scored 0–100. Each bar is that input's sub-score; the figure is the points it added to the 100-point composite (weight × sub-score).
- Cash flow +9.1/30.0
- 1% rule +8.0/10.0
- ARV discount +7.5/15.0
- Schools +4.3/10.0
- Livability +3.6/5.0
- Rent growth +3.4/5.0
- DSCR +2.5/10.0
- Condition / age +2.5/5.0
- Appreciation +0.0/10.0
$160,000
🖨 Deal sheet 📄 Offer letter ✓ Due diligence
Listing remarks
PROPERTY HAS BEEN RENT TILL MAY 31, 2027 BUT STILL FOR SALE!!! Beautiful 2BR/2BA condo located in a desirable 55+ resort-style community. Amenities include two pools, tennis courts, exercise room, billiards, and handicap accessibility. This well-maintained unit offers a beautiful layout with some upgrades throughout, plus a screened patio with a lovely view and wonderful cross breeze. Enjoy comfortable living in an active community close to everything. Assessment of $597 monthly through May 2025.
Key facts
- Screened patio
- Billiards
- Exercise room
Tags
Property features AI
Finance
- Other: Building area reported from public records
- Financial info: Tax information available
- HOA & community: Has association; Monthly association fee; Association covers cable TV, insurance, water and common areas; Community amenities: clubhouse, elevators, fitness center, pool, shuffleboard court, tennis courts, bocce ball, business center, community room, internet included; Senior community; Pets not allowed
Exterior
- Parking: Assigned parking (1 space); Open parking spaces available
- Security: Smoke detector(s)
- Utilities: Public water; Public sewer; Electricity available; Cable available
- Home design: Condominium; Resale; 4-story building; Faces east; Accessible full bath and ramp access
- Construction: Stucco and CBS construction; Other roof
- Exterior features: Screened patio; Patio; Not waterfront
Interior
- Kitchen: Electric range; Dishwasher; Microwave; Refrigerator; Garbage disposal; Electric water heater
- Bedrooms: 2 main level bedrooms
- Flooring: Laminate; Furnished
- Bathrooms: 2 full bathrooms (main level)
- Heating & cooling: Central electric heating; Central air conditioning; Ceiling fan(s)
- Interior features: Walk-in closets; Smoke detectors
- Laundry & utility: Washer hookup
Neighborhood map
What this means for you Summary
Snapshot
- This is a 2-bed/2.0-bath condo listed at $160k.
Deal economics
- At list price, monthly cash flow is $-122 ($-1k/yr) — negative.
- To cash-flow at today's rent, offer at most $138k (13.5% below list).
- Meets the 1% rule at list price ($2k rent vs $160k).
- Recommended offer: $138k (13.5% below list) — sets the bar for cash-flow.
- Cap rate 5.4% vs local median 4.3% in Boynton Beach — meaningfully above typical; check what's discounted (condition, days-on-market, listing class) to confirm the premium yield is real.
Location & tenants
- Location reads 72/100 on livability (#351 in FL) — a middle-class / working-renter tenant base. Strengths: housing A+, health & safety B+, cost of living B; Watch: amenities D+, crime D-, commute F.
- Palm Beach (suburban): math 46% / reading 53% proficiency, ranked #34 of 73 in FL (top 47%) — families likely to look elsewhere, expect single-tenant / working-renter base with shorter leases.
- Market conditions: Rents rising (+3.6%/yr); 536 active listings in the ZIP; 40 comparable units currently listed for rent nearby; rentals at typical pace (median 24d on market — plan ~3-4 weeks tenant-placement turnaround); 3,974 units permitted in Palm Beach County in 2024 (1,012 in 5+ unit buildings).
- This rent runs 37% of the median local income ($68k/yr) — at the standard rent-burdened threshold; future hikes will face affordability resistance.
Forward outlook
- Local home prices are declining (-3.0%/yr); year-one equity from $1k of loan paydown is wiped out by about $5k of value loss. Plan a longer hold.
- Palm Beach County population projected at +30% by 2050 — long-run rental-demand tailwind backs the buy-and-hold thesis.
Negotiation context
- It's been on market 66 days — a 6% lower offer ($150k) is reasonable based on typical stale-listing flexibility.
- 2 sale attempts; this cycle's ask is 9597% above the opening price — seller raised mid-cycle; expect resistance to lowballs.
- Current owner paid $50k; list at $160k implies a 220% gain — meaningful room to come down on a strong offer.
Risks & watch-outs
- Watch-outs: HOA is 33% of rent.
- Climate carrying-cost: severe wind risk, 99% chance of damaging wind over 30y; extreme-heat days projected 7→26/yr by 2055 (HVAC capex compounding) — expect insurance premiums to compound above CPI over the hold.
Questions for the listing agent
- What do current leases actually rent for vs. the listed asking? Can we see a recent rent roll and the last 12 months of T-12 income?
- It's been on market 66 days. Have you received any prior offers? Is the seller open to a 13% concession, seller financing, or rate buy-down credit?
- Built in 1977 — when were the roof, HVAC, electrical panel, plumbing, and water heater last replaced?
- What does the HOA fee cover, when was the last increase, and are there any pending special assessments or reserve-fund shortfalls?
- Any open or pending special assessments — roof, HVAC, plumbing, elevator, façade? What's the per-unit balance and payoff schedule, and is the seller paying it off at close or rolling it to the buyer?
- Why hasn't it sold? Are there any deal-killer items the seller is aware of (foundation, flood, title, zoning, code violations)?
- Is there a deadline driving the sale (1031 exchange, divorce, estate, relocation)? That informs how much negotiation room exists.
- Crime grade is D in this area — have there been break-ins, vandalism, or insurance claims at this property in the last 3 years? What carrier currently insures it and at what premium?
- The area grade is low — what's the realistic commute time and amenity access for the typical tenant pool here? Any planned neighborhood developments (good or bad) we should know about?
- What's the average days-on-market for RENTAL listings here right now (not sales)? A rising rental-DOM trend means longer vacancies and softer asking-rent achievability than the comps imply.
- What's the recent tenant-quality profile in this submarket — average credit score on applications, eviction rate, late-payment / NSF rate, and stable-employment percentage? A property-management company in the area should have these aggregated.
- How much new apartment / multifamily construction is in the pipeline within 1–3 miles? Heavy new supply (>2% of stock underway) typically softens rents 12–24 months out; light construction supports rent growth.
Investment metrics
- 1% rule
- 1.30% ✓
- Cap rate
- 5.38%
- Cash-on-cash
- -3.27%
- DSCR
- 0.85
- GRM
- 6.4
CMA / ARV
No comps found within radius.
Projected returns pro-forma
-3.0% appreciation · 3.64% rent growth · sell at horizon
- IRR
- -20.2%
- Equity multiple
- 0.29×
- Total profit
- $-31,910
- Equity at exit
- $23,857
- IRR
- -10.6%
- Equity multiple
- 0.32×
- Total profit
- $-30,407
- Equity at exit
- $13,834
Cash invested: $44,800 (down + closing). Projections, not guarantees.
Landlord ↔ Tenant lean methodology
- Overall (STATE)
- 87 Strongly Landlord-Friendly
- State Florida
- 87 Strongly Landlord-Friendly · R+3
- County
- — inherits STATE
- City
- — inherits STATE
ZIP-level market 33435
- Rents YoY
- 3.6%
- Active inventory
- 536
- Price-to-rent
- 6.4×
Monthly cashflow live
- Estimated rent
- $2,081 high interval (Pro) →
- Mortgage (P&I)
- −$839
- Tax from tax record
- −$164 /mo · $1,974/yr
- Insurance
- −$67
- HOA
- −$696
- Vacancy / Maint / Mgmt
- −$437
- Net cashflow
- $-122
Break-even live
UW: 25.0% down · 7.5% · 30yr · 1.5% tax · 5.0% vac · 8.0% maint · 8.0% mgmt
Financing live
Cash to close
- Down payment
- $40,000
- Closing costs
- $4,800
- Reserves months
- —
- Total cash needed
- —
Loan-product check · same deal, 3 products live
Conventional
25% down · 7.5% · 30yr
- Down + closing
- —
- Monthly P&I
- —
- Monthly cashflow
- —
- DSCR
- —
- Eligible?
- —
Personal DTI + credit; lowest rate.
DSCR
20% down · 8.5% · 30yr
- Down + closing
- —
- Monthly P&I
- —
- Monthly cashflow
- —
- DSCR
- —
- Eligible?
- —
No personal income docs; deal must DSCR.
Hard money
10% down · 12.0% · 12mo
- Down + closing
- —
- Monthly P&I
- —
- Monthly cashflow
- —
- DSCR
- —
- Eligible?
- —
Short-term bridge; refi at stabilization.
Rent comps 40 comps
| Address | Beds | Baths | Sqft | Rent | $/sqft | DOM | Units | Dist |
|---|---|---|---|---|---|---|---|---|
| 2615 NE 1st Ct #403 Boynton Beach, FL | 2.0 | 2.0 | 960 | $2,100 | $2.19 | 24d | 1 | 0.02mi |
| 2615 NE 1st Ct Boynton Beach, FL | 2.0 | 2.0 | 960 | $1,850 | $1.93 | 18d | 2 | 0.03mi |
| 230 NE 26th Ave #1070 Boynton Beach, FL | 1.0 | 1.5 | 754 | $1,620 | $2.15 | 10d | 1 | 0.07mi |
| 300 NE 26th Ave #1040 Boynton Beach, FL | 2.0 | 2.0 | 1080 | $1,559 | $1.44 | 24d | 1 | 0.07mi |
| 230 NE 26th Ave Boynton Beach, FL | 1.0–2.0 | 1.5–2.0 | 857 | $1,650 | $1.93 | 17d | 2 | 0.07mi |
| 2515 NE 2nd Ct #202 Boynton Beach, FL | 2.0 | 2.0 | 960 | $1,499 | $1.56 | 24d | 1 | 0.09mi |
| 2600 NE 1st Ln #418 Boynton Beach, FL | 2.0 | 2.0 | 1182 | $1,750 | $1.48 | 24d | 1 | 0.13mi |
| 130 NE 26th Ave #307 Boynton Beach, FL | 2.0 | 2.0 | 982 | $3,500 | $3.56 | 24d | 1 | 0.13mi |
| 330 NE 26th Ave Unit 108 Boynton Beach, FL | 1.0 | 1.5 | 754 | $1,375 | $1.82 | 24d | 1 | 0.14mi |
| 330 NE 26th Ave Unit 108 Boynton Beach, FL | 1.0 | 1.5 | 754 | $1,600 | $2.12 | 2d | 1 | 0.14mi |
| 2601 3rd Ct NE #202 Boynton Beach, FL | 2.0 | 2.0 | 982 | $1,500 | $1.53 | 18d | 1 | 0.15mi |
| 2400 NE 1st Ln #206 Boynton Beach, FL | 1.0 | 1.5 | 754 | $1,800 | $2.39 | 14d | 1 | 0.16mi |
| 2615 NE 3rd Ct #4030 Boynton Beach, FL | 2.0 | 2.0 | 960 | $1,699 | $1.77 | 4d | 1 | 0.16mi |
| 2639 NE 4th St Boynton Beach, FL | 3.0 | 2.0 | 1300 | $2,895 | $2.23 | 5d | 1 | 0.32mi |
| 2100 N Seacrest Blvd Boynton Beach, FL | 3.0 | 1.0 | 1056 | $2,900 | $2.75 | 16d | 1 | 0.32mi |
| 8076 Ambach Way Hypoluxo, FL | 2.0 | 2.0 | 1243 | $2,200 | $1.77 | 24d | 1 | 0.34mi |
| 2122 NE 1st St Boynton Beach, FL | 2.0 | 1.0 | 1362 | $2,300 | $1.69 | 11d | 1 | 0.34mi |
| 4 Crossings Cir Unit B Boynton Beach, FL | 2.0 | 1.5 | 864 | $1,950 | $2.26 | 24d | 1 | 0.40mi |
| 2202 NE 3rd St Boynton Beach, FL | 3.0 | 2.0 | 902 | $3,000 | $3.33 | 16d | 1 | 0.41mi |
| 30 Crossings Cir Unit H Boynton Beach, FL | 2.0 | 2.0 | 864 | $2,400 | $2.78 | 18d | 1 | 0.41mi |
| 7 Crossings Cir Boynton Beach, FL | 2.0 | 1.5 | 864 | $2,500 | $2.89 | 24d | 1 | 0.41mi |
| 108 NE 20th Ave #206 Boynton Beach, FL | 2.0 | 2.0 | 860 | $1,800 | $2.09 | 19d | 1 | 0.41mi |
| 17 Crossings Cir Unit E Boynton Beach, FL | 2.0 | 2.0 | 864 | $1,900 | $2.20 | 24d | 1 | 0.42mi |
| 14 Crossings Cir Unit E Boynton Beach, FL | 2.0 | 2.0 | 953 | $2,300 | $2.41 | 24d | 1 | 0.44mi |
| 27 Crossings Cir Unit H Boynton Beach, FL | 2.0 | 2.0 | 864 | $1,900 | $2.20 | 14d | 1 | 0.45mi |
| 661 Waterside Dr Hypoluxo, FL | 2.0 | 2.0 | 768 | $2,000 | $2.60 | 24d | 1 | 0.45mi |
| 1214 Highview Rd Lantana, FL | 3.0 | 2.0 | 768 | $2,300 | $2.99 | 1d | 1 | 0.47mi |
| 314 Waterside Dr Hypoluxo, FL | 2.0 | 2.5 | 1128 | $1,850 | $1.64 | 24d | 1 | 0.48mi |
| 369 Waterside Dr Hypoluxo, FL | 2.0 | 2.5 | 1128 | $2,250 | $1.99 | 24d | 1 | 0.48mi |
| 221 Waterside Dr #221 Hypoluxo, FL | 3.0 | 2.5 | 1259 | $2,100 | $1.67 | 3d | 1 | 0.48mi |
| 338 Waterside Dr Hypoluxo, FL | 3.0 | 2.5 | 1259 | $2,100 | $1.67 | 4d | 1 | 0.48mi |
| 117 Waterside Dr #117 Hypoluxo, FL | 2.0 | 2.0 | 768 | $2,000 | $2.60 | 24d | 1 | 0.48mi |
| 368 Waterside Dr Hypoluxo, FL | 2.0 | 2.5 | 1152 | $2,500 | $2.17 | 24d | 1 | 0.48mi |
| 176 Waterside Dr Hypoluxo, FL | 3.0 | 2.0 | 1024 | $2,500 | $2.44 | 19d | 1 | 0.48mi |
| 221 Waterside Dr #221 Hypoluxo, FL | 3.0 | 2.5 | 1259 | $2,200 | $1.75 | 24d | 1 | 0.48mi |
| 2202 NE 4th St #10 Boynton Beach, FL | 2.0 | 1.0 | 757 | $1,900 | $2.51 | 2d | 1 | 0.48mi |
| 977 Miner Rd Lantana, FL | 3.0 | 1.0 | 1100 | $3,195 | $2.90 | 1d | 1 | 0.48mi |
| 24 Crossings Cir Unit H Boynton Beach, FL | 2.0 | 2.0 | 864 | $2,050 | $2.37 | 24d | 1 | 0.50mi |
| 1236 Peak Rd Lantana, FL | 2.0 | 1.0 | 1170 | $2,150 | $1.84 | 24d | 1 | 0.51mi |
| 311 NE 17th Ave #204 Boynton Beach, FL | 2.0 | 2.0 | 1100 | $1,650 | $1.50 | 24d | 1 | 0.57mi |
HOA detail condo
- Monthly dues
- $696 · $8,352/yr
- Likely covers
- pool
- Assessments
- None detected in remarks — confirm with the listing agent.
Listing history 17 events
-
2026-06-18days on market $160,000 Active 66 DOM
-
2026-06-17days on market $160,000 Active 65 DOM
-
2026-06-16days on market $160,000 Active 64 DOM
-
2026-06-15days on market $160,000 Active 63 DOM
-
2026-06-13days on market $160,000 Active 61 DOM
-
2026-06-09days on market $160,000 Active 57 DOM
-
2026-06-08days on market $160,000 Active 56 DOM
-
2026-06-07days on market $160,000 Active 55 DOM
-
2026-06-04days on market $160,000 Active 52 DOM
-
2026-06-03days on market $160,000 Active 51 DOM
-
2026-06-02days on market $160,000 Active 50 DOM
-
2026-06-01days on market $160,000 Active 49 DOM
-
2026-05-31days on market $160,000 Active 48 DOM
-
2026-04-16$1,650
-
2026-04-09$160,000 Active
-
2009-03-16soldstatus $50,000
-
2001-07-30soldstatus $22,000
ⓘ Source: listings_history table (triggers on properties + properties_extension) + one-shot
backfill from property_details.listing_events for pre-trigger history.
Tax reassessment forecast FL · Resets to sale price
- Current annual tax
- $1,974 · $164/mo
- Projected year-2 tax
- $1,974 · $164/mo
- Expected delta
- $0/yr ($0/mo · 0.0%)
ⓘ Screening estimate from a state-policy table — verify with the county assessor before closing.
Climate risk First Street
- Flood 1/10 Low FEMA zone X (unshaded) · 0% chance over 30 yrs
- Wildfire 1/10 Low
- Heat 9/10 Extreme 7 d/yr ≥105°F today · 26 d/yr by 30 yrs out
- Wind 10/10 Extreme 99% chance of damaging wind over 30 yrs
- Air quality 2/10 Low 0 unhealthy d/yr today · 2 by 30 yrs out
Nearby sold comps map
Loading sold comps map…
Walkable amenities ~0.75 mi
Loading nearby amenities…
Taxation est. · year 1
- Rental income
- $24,976
- − Mortgage interest
- −$8,962
- − Property taxes
- −$1,974
- − Insurance
- −$800
- − Repairs & maintenance
- −$1,998
- − Management
- −$1,998
- − HOA
- −$8,352
- − Depreciation
- −$4,655
- Taxable loss
- −$3,763
- Est. tax savings @ 24.0%
- +$903
- After-tax cash flow
- $-561/yr
For passive investors: Depreciation is non-cash, so a rental often shows a tax loss while cash-flowing — sheltering income. Rental losses are passive: they offset passive income freely, and up to $25,000/yr can offset ordinary (W-2) income if you actively participate and your MAGI is under $100k (phasing out to $0 by $150k); unused losses carry forward. On sale, claimed depreciation is recaptured at up to 25%, and gains may owe capital-gains tax (a 1031 exchange can defer both). Figures are a year-1 estimate at your 24.0% rate — not tax advice; consult a CPA.
Schools (NCES district)
- District
- Palm Beach
- NCES district ID
- 1201500
- Math proficiency
- 46% ▼ -16.00%
- Reading proficiency
- 53% ▼ -4.00%
- Median HH income
- $53,943
- Composite
- 42.72/100
- National rank
- #3160
- State rank
- #34 of 73 in FL
Livability — Boynton Beach
- Score
- 72/100
- State rank
- #351
- US rank
- #6098
Category grades
Schools grade is shown separately in the Schools card above.
Census & demographics
- Census place
- Boynton Beach, FL
- County
- Palm Beach County · 1,438,312 people
- City population
- 148,060
- Metro
- Miami-Fort Lauderdale-Pompano Beach, FL
- Population (ZIP)
- 37,833
- Household income
- $67,979
- Rent vs Own
- Severe rent burden
- 1623.0
Population outlook (Palm Beach County) Hauer SSP2
- Today (2025)
- 1,637,487 people
- By 2030
- 1,743,255 · +6.5%
- By 2040
- 1,948,712 · +19.0%
- By 2050
- 2,132,979 · +30.3%
- By 2075
- 2,530,027 · +54.5%
- By 2100
- 2,706,979 · +65.3%
Race, ethnicity, and origin ACS 2023
- Neighborhood character
- Diverse neighborhood (Simpson 0.65)
- Race & ethnicity
- White 41% Black 40% Hispanic / Latino 15% Two or more races 10%
- Hispanic origin (detail)
- Mexican 3% Puerto Rican 3% Cuban 2% Dominican 1%
- Common ancestry
- Hispanic 23% Romanian 2% Lithuanian 2%
- Foreign-born
- 30% · Canada, Jamaica
- Languages at home
- 61% English-only · French/Haitian/Cajun 24% Spanish 11% Other Indo-European 2%
Political lean MEDSL · Palm Beach
- 2024 margin
- Toss-up / Even · D 50.0% · R 49.2%
- 2008→2024 swing
- -22.1pp toward R · 2008: 22.9pp · 2024: 0.8pp
- All cycles
- 2024: D+0.8 2020: D+12.8 2016: D+15.3 2012: D+17.0 2008: D+22.9
Not yet ingested
- Civics
- —
Market trends
- HPI YoY
- ▼ -345.86%
- Current HPI
- 371.0527
- Rent YoY
- ▲ 3.64%
- Metro
- Miami-Fort Lauderdale-Pompano Beach, FL
- State GDP YoY
- ▲ 3.28%
- F500 in state
- 36
Industry mix (Fortune 500 HQ in FL)
| Industry | F500 HQs | Revenue |
|---|---|---|
| Industrial Technology | 2 | $29B |
|
||
| Insurance | 2 | $17B |
|
||
| Retail | 1 | $60B |
|
||
| Technology Distribution | 1 | $58B |
|
||
| Homebuilding | 1 | $35B |
|
||
| Technology Manufacturing | 1 | $35B |
|
||
Price history
-92.5% since first listed4 events — show timeline
- 2026-04-16 Listed for Rent $1,650 RMLSFL
- 2026-04-09 Listed $160,000 Beaches MLS
- 2009-03-16 Sold (Public Records) $50,000 Public Records
- 2001-07-30 Sold (Public Records) $22,000 Public Records
Property tax history
+6.9%/yrLatest (2025): $1,974 · +3.3% YoY. Source: county tax records.
Cash-flow waterfall
monthlySold comps — $/sqft
last 12 mo · ≤1 miLoading sold comps…