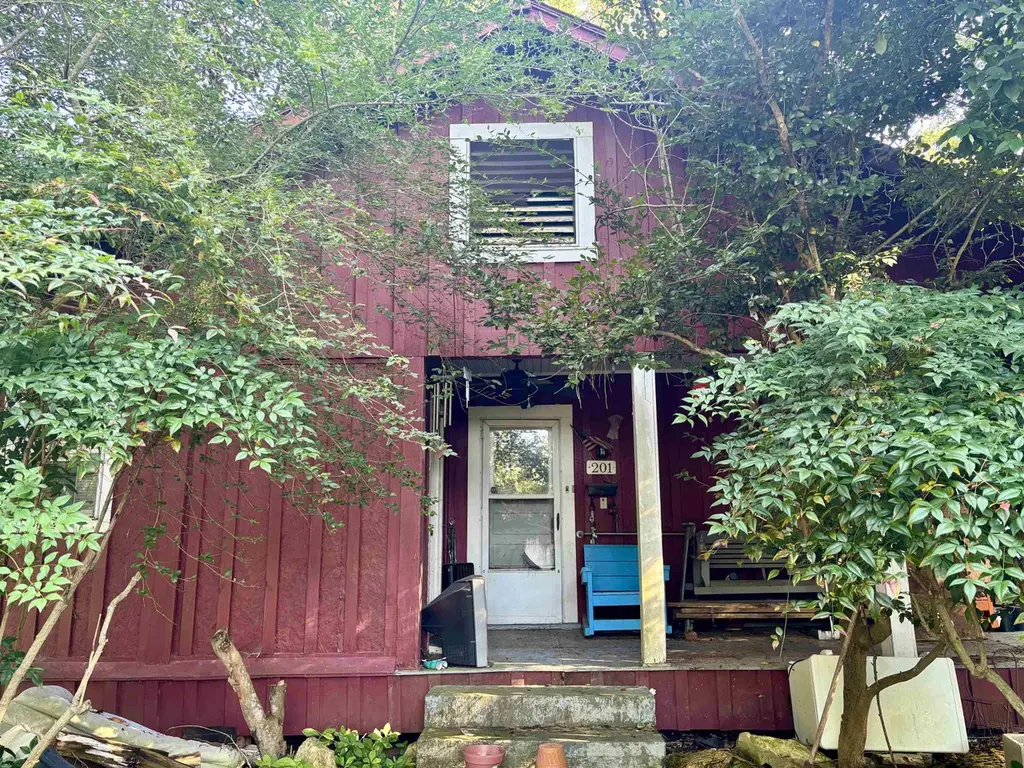
201 Florine St · Jasper, TX
Flood risk 1/10 · Minimal
- FEMA flood zone
- X (unshaded)
- Chance of flooding over 30 yrs
- 0.0%
- Est. flood insurance / yr
- $507 – $1,088
Fire risk 4/10 · Minor
- Est. fire insurance / yr
- $1,222 – $2,270
Heat risk 8/10 · Major
- Hot days now (above 111°F)
- 7 days/yr
- Hot days in 30 yrs
- 22 days/yr
Wind risk 8/10 · Major
- Chance of severe wind over 30 yrs
- 99.0%
Air-quality risk 1/10 · Minimal
- Unhealthy air days now
- 0 days/yr
- Unhealthy air days in 30 yrs
- 0 days/yr
Risk factors via First Street. Map © Google.
Why this score? — see what drove the D grade
The composite is a weighted blend of 9 inputs, each scored 0–100. Each bar is that input's sub-score; the figure is the points it added to the 100-point composite (weight × sub-score).
- Cash flow +15.0/30.0
- ARV discount +7.5/15.0
- 1% rule +5.0/10.0
- DSCR +5.0/10.0
- Livability +2.9/5.0
- Rent growth +2.5/5.0
- Condition / age +2.5/5.0
- Schools +2.0/10.0
- Appreciation +0.0/10.0
$22,500
🖨 Deal sheet 📄 Offer letter ✓ Due diligence
Listing remarks
Investment opportunity! This home is located in downtown Jasper, just steps away from dining and shopping. If you are looking to get into investing this could be the perfect place to start, or if you are a seasoned investor-come take a look! Located on a spacious lot. Call today!
Key facts
- Downtown jasper
- Spacious lot
- 0.26 acre lot
Tags
Property features AI
Finance
- Financial info: Annual tax approximately $287
Exterior
- Home design: Single Family Residence (Residential property)
- Construction: Lot size approximately 0.26 acres
- Exterior features: Located in the Out Of Town subdivision
Interior
- Bathrooms: 1 full bathroom
- Interior features: Single full bathroom
Neighborhood map
What this means for you Summary
Snapshot
- This is a 3-bed/2.0-bath single-family listed at $22k.
Deal economics
- At list price, monthly cash flow is $1k ($13k/yr) — positive.
- The deal already cash-flows at list — no discount required.
- Meets the 1% rule at list price ($2k rent vs $22k).
- Cap rate 64.3% vs local median 4.8% in Jasper — top-decile yield for the area; either an underpriced asset or a hidden risk that comps aren't pricing in. Stress-test before assuming the spread holds.
Location & tenants
- Location reads 58/100 on livability (#1,225 in TX) — a working-class tenant base; expect higher turnover. Strengths: cost of living A+, housing A; Watch: crime C-, schools F, amenities F.
- Jasper ISD (town): math 22% / reading 26% proficiency, ranked #734 of 826 in TX (top 89%) — low school quality limits family demand, transient renter base, plan for 1-2y turnover; 66% free/reduced lunch — lower-income household profile, screen leases tightly.
- Market conditions: 308 active listings in the ZIP; 4 comparable units currently listed for rent nearby; rentals leasing fast (median 14d on market — plan ~1-2 weeks tenant-placement turnaround); 45 units permitted in Jasper County in 2024 (0 in 5+ unit buildings).
Forward outlook
- Local home prices are declining (-3.0%/yr); year-one equity from $156 of loan paydown is wiped out by about $675 of value loss. Plan a longer hold.
- Jasper County population projected at -15% by 2050 — secular population decline; favor cash flow + early exit over multi-decade hold.
- At projected returns (-3.0% appreciation + 3.0% rent growth), your $6k cash investment doubles in ~1 year — after that, you're playing with house money.
Negotiation context
- Only 7 days on market — expect competitive offers; lowballing is unlikely to land.
Risks & watch-outs
- Climate carrying-cost: severe wind risk, 99% chance of damaging wind over 30y; extreme-heat days projected 7→22/yr by 2055 (HVAC capex compounding) — expect insurance premiums to compound above CPI over the hold.
Questions for the listing agent
- Is there a deadline driving the sale (1031 exchange, divorce, estate, relocation)? That informs how much negotiation room exists.
- Schools are F-rated, which usually means shorter tenancies and higher turnover. Who's the typical renter profile here, and what's been the actual vacancy rate?
- The area grade is low — what's the realistic commute time and amenity access for the typical tenant pool here? Any planned neighborhood developments (good or bad) we should know about?
- What's the average days-on-market for RENTAL listings here right now (not sales)? A rising rental-DOM trend means longer vacancies and softer asking-rent achievability than the comps imply.
- What's the recent tenant-quality profile in this submarket — average credit score on applications, eviction rate, late-payment / NSF rate, and stable-employment percentage? A property-management company in the area should have these aggregated.
- How much new for-sale + rental construction is in the pipeline within 1–3 miles? Heavy new supply typically softens prices + rents 12–24 months out; constrained supply supports both.
Investment metrics
- 1% rule
- 7.00% ✓
- Cap rate
- 64.31%
- Cash-on-cash
- 207.22%
- DSCR
- 10.22
- GRM
- 1.2
CMA / ARV
- ARV (on-the-fly)
- $96,200
- Comps found
- 2
Show comp detail 2 sales within ~0.75 mi
| Address | Dist | Beds/Ba | Sqft | Sold | Price | $/sf | Match |
|---|---|---|---|---|---|---|---|
| 430 W Water St | 0.60mi | 3/2.0 | 1,286 (-1%) | 0mo | $95,000 | $74 | 70 |
| 218 E Morris St | 0.36mi | 3/2.0 | 1,172 (-10%) | 11mo | $84,999 | $73 | 57 |
Match score weights: distance 35% · size 25% · config 20% · recency 20%. Top-matched comps best support the ARV.
Projected returns pro-forma
-3.0% appreciation · 3.0% rent growth · sell at horizon
- IRR
- —
- Equity multiple
- 11.42×
- Total profit
- $65,666
- Equity at exit
- $3,355
- IRR
- —
- Equity multiple
- 24.25×
- Total profit
- $146,497
- Equity at exit
- $1,945
Cash invested: $6,300 (down + closing). Projections, not guarantees.
Landlord ↔ Tenant lean methodology
- Overall (STATE)
- 87 Strongly Landlord-Friendly
- State Texas
- 87 Strongly Landlord-Friendly · R+5
- County
- — inherits STATE
- City
- — inherits STATE
ZIP-level market 75951
- Active inventory
- 308
- Price-to-rent
- 1.2×
Monthly cashflow live
- Estimated rent
- $1,574 medium interval (Pro) →
- Mortgage (P&I)
- −$118
- Tax est. 1.5%
- −$28 /mo · $338/yr
- Insurance
- −$9
- HOA
- −$0
- Vacancy / Maint / Mgmt
- −$331
- Net cashflow
- $1,088
Break-even live
UW: 25.0% down · 7.5% · 30yr · 1.5% tax · 5.0% vac · 8.0% maint · 8.0% mgmt
Financing live
Cash to close
- Down payment
- $5,625
- Closing costs
- $675
- Reserves months
- —
- Total cash needed
- —
Loan-product check · same deal, 3 products live
Conventional
25% down · 7.5% · 30yr
- Down + closing
- —
- Monthly P&I
- —
- Monthly cashflow
- —
- DSCR
- —
- Eligible?
- —
Personal DTI + credit; lowest rate.
DSCR
20% down · 8.5% · 30yr
- Down + closing
- —
- Monthly P&I
- —
- Monthly cashflow
- —
- DSCR
- —
- Eligible?
- —
No personal income docs; deal must DSCR.
Hard money
10% down · 12.0% · 12mo
- Down + closing
- —
- Monthly P&I
- —
- Monthly cashflow
- —
- DSCR
- —
- Eligible?
- —
Short-term bridge; refi at stabilization.
Rent comps 4 comps
| Address | Beds | Baths | Sqft | Rent | $/sqft | DOM | Units | Dist |
|---|---|---|---|---|---|---|---|---|
| 509 N Peachtree St Jasper, TX | 3.0 | 2.0 | 1627 | $2,000 | $1.23 | 13d | 1 | 0.36mi |
| 469 Ogden St Jasper, TX | 3.0 | 1.0 | 1344 | $1,600 | $1.19 | 13d | 1 | 0.43mi |
| 816 Ogden St Jasper, TX | 3.0 | 1.0 | 1270 | $1,095 | $0.86 | 13d | 1 | 0.67mi |
| 209 Cavin St Jasper, TX | 3.0 | 1.0 | 1418 | $1,300 | $0.92 | 19d | 1 | 0.86mi |
Listing history 7 events
-
2026-06-18days on market $22,500 Active 7 DOM
-
2026-06-17days on market $22,500 Active 6 DOM
-
2026-06-16days on market $22,500 Active 5 DOM
-
2026-06-15days on market $22,500 Active 4 DOM
-
2026-06-14days on market $22,500 Active 2 DOM
-
2026-06-13remarks 280-char remark
-
2026-06-13$22,500 Active 1 DOM
ⓘ Source: listings_history table (triggers on properties + properties_extension) + one-shot
backfill from property_details.listing_events for pre-trigger history.
Climate risk First Street
- Flood 1/10 Low FEMA zone X (unshaded) · 0% chance over 30 yrs
- Wildfire 4/10 Moderate
- Heat 8/10 Severe 7 d/yr ≥111°F today · 22 d/yr by 30 yrs out
- Wind 8/10 Severe 99% chance of damaging wind over 30 yrs
- Air quality 1/10 Low 0 unhealthy d/yr today · 0 by 30 yrs out
Nearby sold comps map
Loading sold comps map…
Walkable amenities ~0.75 mi
Loading nearby amenities…
Taxation est. · year 1
- Rental income
- $18,887
- − Mortgage interest
- −$1,260
- − Property taxes
- −$338
- − Insurance
- −$112
- − Repairs & maintenance
- −$1,511
- − Management
- −$1,511
- − Depreciation
- −$655
- Taxable income
- $13,500
- Est. tax owed @ 24.0%
- −$3,240
- After-tax cash flow
- $9,815/yr
For passive investors: Depreciation is non-cash, so a rental often shows a tax loss while cash-flowing — sheltering income. Rental losses are passive: they offset passive income freely, and up to $25,000/yr can offset ordinary (W-2) income if you actively participate and your MAGI is under $100k (phasing out to $0 by $150k); unused losses carry forward. On sale, claimed depreciation is recaptured at up to 25%, and gains may owe capital-gains tax (a 1031 exchange can defer both). Figures are a year-1 estimate at your 24.0% rate — not tax advice; consult a CPA.
Schools (NCES district)
- District
- Jasper ISD
- NCES district ID
- 4824630
- Math proficiency
- 22% ▼ -12.00%
- Reading proficiency
- 26% ▼ -8.00%
- Median HH income
- $36,286
- Composite
- 19.91/100
- National rank
- #8684
- State rank
- #734 of 826 in TX
Livability — Jasper
- Score
- 58/100
- State rank
- #1225
- US rank
- #21385
Category grades
Schools grade is shown separately in the Schools card above.
Census & demographics
- Census place
- Jasper, TX
- Population (ZIP)
- 15,267
Population outlook (Jasper County) Hauer SSP2
- Today (2025)
- 33,986 people
- By 2030
- 32,965 · -3.0%
- By 2040
- 30,908 · -9.1%
- By 2050
- 28,893 · -15.0%
- By 2075
- 24,828 · -26.9%
- By 2100
- 19,987 · -41.2%
Race, ethnicity, and origin ACS 2023
- Neighborhood character
- Diverse neighborhood (Simpson 0.56)
- Race & ethnicity
- White 60% Black 28% Two or more races 7% Hispanic / Latino 6%
- Hispanic origin (detail)
- Mexican 6%
- Common ancestry
- Lithuanian 1% Slovak 1% Iranian 1%
- Foreign-born
- 3% · Canada
- Languages at home
- 93% English-only · Spanish 5% Tagalog/Filipino 1%
Political lean MEDSL · Jasper
- 2024 margin
- Solid R (+66.6) · D 16.5% · R 83.1%
- 2008→2024 swing
- -24.6pp toward R · 2008: -42.0pp · 2024: -66.6pp
- All cycles
- 2024: R+66.6 2020: R+61.4 2016: R+59.9 2012: R+48.4 2008: R+42.0
Not yet ingested
- Civics
- —
Market trends
- HPI YoY
- ▼ -83.56%
- Current HPI
- 136.7972
- Rent YoY
- —
- Metro
- —
- State GDP YoY
- ▲ 3.95%
- F500 in state
- 110
Industry mix (Fortune 500 HQ in TX)
| Industry | F500 HQs | Revenue |
|---|---|---|
| Energy | 16 | $1,198B |
|
||
| Technology | 5 | $198B |
|
||
| Engineering / Construction | 4 | $72B |
|
||
| Energy Services | 3 | $60B |
|
||
| Utilities | 3 | $41B |
|
||
| Healthcare | 2 | $330B |
|
||
Price history
1 event — show timeline
- 2026-06-11 Listed $22,500 BBOR
Property tax history
+4.4%/yrLatest (2025): $1,253 · +12.4% YoY. Source: county tax records.
Cash-flow waterfall
monthlySold comps — $/sqft
last 12 mo · ≤1 miLoading sold comps…