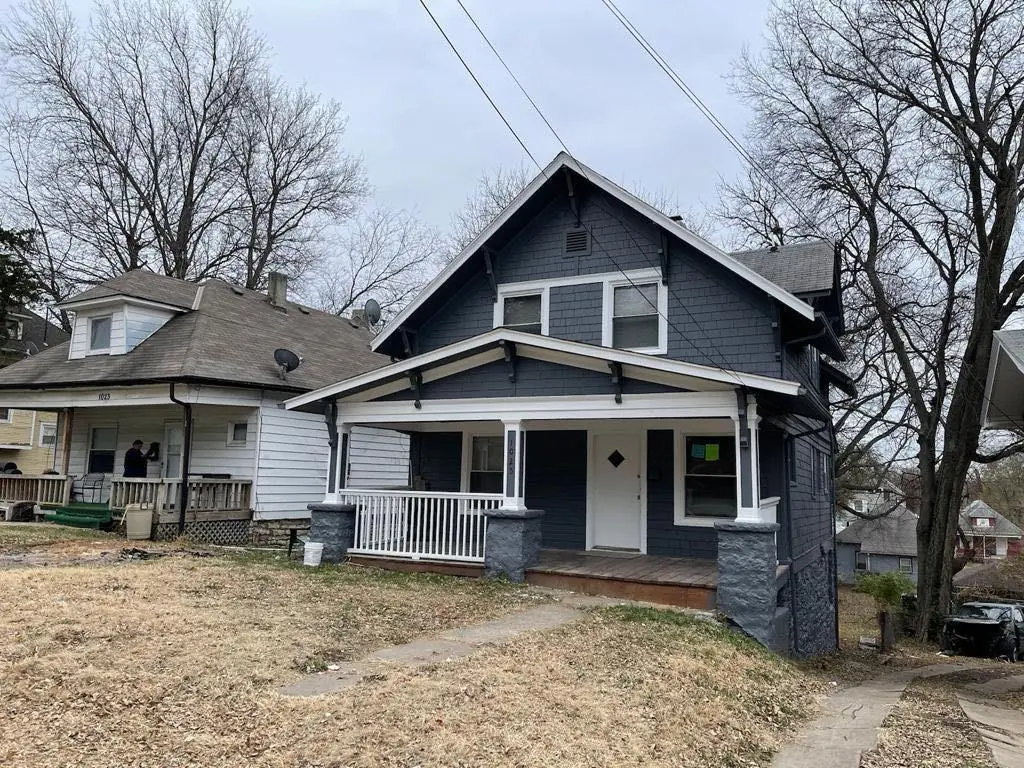
1025 Waverly Ave · Kansas City, KS
Flood risk 1/10 · Minimal
- FEMA flood zone
- X (unshaded)
- Chance of flooding over 30 yrs
- 0.0%
- Est. flood insurance / yr
- $473 – $860
Fire risk 1/10 · Minimal
- Est. fire insurance / yr
- $1,154 – $2,142
Heat risk 4/10 · Minor
- Hot days now (above 107°F)
- 7 days/yr
- Hot days in 30 yrs
- 17 days/yr
Wind risk 2/10 · Minimal
- Chance of severe wind over 30 yrs
- —
Air-quality risk 3/10 · Minor
- Unhealthy air days now
- 2 days/yr
- Unhealthy air days in 30 yrs
- 3 days/yr
Risk factors via First Street. Map © Google.
Why this score? — see what drove the C grade
The composite is a weighted blend of 9 inputs, each scored 0–100. Each bar is that input's sub-score; the figure is the points it added to the 100-point composite (weight × sub-score).
- Cash flow +24.8/30.0
- DSCR +8.1/10.0
- ARV discount +7.5/15.0
- 1% rule +5.7/10.0
- Livability +3.6/5.0
- Rent growth +2.5/5.0
- Condition / age +2.5/5.0
- Schools +0.9/10.0
- Appreciation +0.0/10.0
$175,000
🖨 Deal sheet 📄 Offer letter ✓ Due diligence
Listing remarks
Help Your Clients Transition from Renting to Owning! ?? As a real estate professional, you have a unique opportunity to guide your clients toward homeownership. Spotlight on This Property! This beautiful home was fully remodeled in 2022, offering modern amenities and a prime location just minutes from downtown. It currently has a tenant paying $1,550 per month, ensuring immediate rental income. This makes it a fantastic opportunity for investors looking to add a valuable property to their portfolio.
Key facts
- 4,547 sq ft lot
- Built 1910
- Listed 84 days
Property features AI
Finance
- Financial info: Annual tax information available
Exterior
- Parking: Off-street parking
- Utilities: Public water; Public sewer
- Home design: Single-family residence; Residential property; 2-story floor plan; Located inside city limits
- Construction: Frame construction with shingle and wood siding; Composition roof; Originally built over 100 years ago
- Exterior features: Deck
Interior
- Kitchen: Dishwasher; Microwave; Refrigerator; Electric range
- Bedrooms: 4 bedrooms (one on the first floor; three on the second floor)
- Flooring: Carpet in at least one bedroom
- Bathrooms: 2 full bathrooms (one on the first floor; one on the second floor)
- Heating & cooling: Natural gas heating; Electric cooling
- Interior features: Living and dining area combined; Full unfinished basement
- Laundry & utility: Laundry located in the basement
Neighborhood map
What this means for you Summary
Snapshot
- This is a 3-bed/1.0-bath single-family listed at $175k.
Deal economics
- At list price, monthly cash flow is $372 ($4k/yr) — positive.
- The deal already cash-flows at list — no discount required.
- Meets the 1% rule at list price ($2k rent vs $175k).
- Recommended offer: $164k (6.0% below list) — sets the bar for market timing.
- Cap rate 8.8% vs local median 4.8% in Kansas City — top-decile yield for the area; either an underpriced asset or a hidden risk that comps aren't pricing in. Stress-test before assuming the spread holds.
Location & tenants
- Location reads 72/100 on livability (#103 in KS) — a middle-class / working-renter tenant base. Strengths: commute A+, cost of living A+, housing A+; Watch: crime F, employment D-.
- Kansas City (urban): math 8% / reading 15% proficiency, ranked #169 of 169 in KS (top 100%) — low school quality limits family demand, transient renter base, plan for 1-2y turnover; 81% free/reduced lunch — lower-income household profile, screen leases tightly.
- Zoned schools: Wyandotte High (math 2% / reading 3%, grade F, #325 of 327 statewide, top 99%, 1,832 students, 83% FRL) — zoned schools at 83% FRL track the district average.
- Market conditions: 150 active listings in the ZIP; 369 units permitted in Wyandotte County in 2024 (236 in 5+ unit buildings).
Forward outlook
- Local home prices are declining (-3.0%/yr); year-one equity from $1k of loan paydown is wiped out by about $5k of value loss. Plan a longer hold.
- Wyandotte County population projected at +17% by 2050 — long-run rental-demand tailwind backs the buy-and-hold thesis.
Negotiation context
- It's been on market 85 days — a 6% lower offer ($164k) is reasonable based on typical stale-listing flexibility.
- 4 sale attempts with the ask held roughly flat each time — persistent listings suggest the price (not the market) is what's stuck; bring a comps-based counter.
Risks & watch-outs
- Watch-outs: built in 1910 — expect roof / HVAC / electrical / plumbing capex.
Questions for the listing agent
- It's been on market 85 days. Have you received any prior offers? Is the seller open to a 6% concession, seller financing, or rate buy-down credit?
- Built in 1910 — when were the roof, HVAC, electrical panel, plumbing, and water heater last replaced?
- Why hasn't it sold? Are there any deal-killer items the seller is aware of (foundation, flood, title, zoning, code violations)?
- Is there a deadline driving the sale (1031 exchange, divorce, estate, relocation)? That informs how much negotiation room exists.
- Schools are F-rated, which usually means shorter tenancies and higher turnover. Who's the typical renter profile here, and what's been the actual vacancy rate?
- Crime grade is F in this area — have there been break-ins, vandalism, or insurance claims at this property in the last 3 years? What carrier currently insures it and at what premium?
- What's the average days-on-market for RENTAL listings here right now (not sales)? A rising rental-DOM trend means longer vacancies and softer asking-rent achievability than the comps imply.
- What's the recent tenant-quality profile in this submarket — average credit score on applications, eviction rate, late-payment / NSF rate, and stable-employment percentage? A property-management company in the area should have these aggregated.
- How much new for-sale + rental construction is in the pipeline within 1–3 miles? Heavy new supply typically softens prices + rents 12–24 months out; constrained supply supports both.
Investment metrics
- 1% rule
- 1.07% ✓
- Cap rate
- 8.84%
- Cash-on-cash
- 9.11%
- DSCR
- 1.41
- GRM
- 7.8
CMA / ARV
No comps found within radius.
Projected returns pro-forma
-3.0% appreciation · 3.0% rent growth · sell at horizon
- IRR
- -2.5%
- Equity multiple
- 0.90×
- Total profit
- $-4,699
- Equity at exit
- $26,093
- IRR
- 7.1%
- Equity multiple
- 1.54×
- Total profit
- $26,280
- Equity at exit
- $15,131
Cash invested: $49,000 (down + closing). Projections, not guarantees.
Landlord ↔ Tenant lean methodology
- Overall (STATE)
- 83 Strongly Landlord-Friendly
- State Kansas
- 83 Strongly Landlord-Friendly · R+10
- County
- — inherits STATE
- City
- — inherits STATE
ZIP-level market 66104
- Home prices YoY
- -20.1%
- Active inventory
- 150
- Price-to-rent
- 7.8×
Monthly cashflow live
- Estimated rent
- $1,875 medium interval (Pro) →
- Mortgage (P&I)
- −$918
- Tax from tax record
- −$118 /mo · $1,421/yr
- Insurance
- −$73
- HOA
- −$0
- Vacancy / Maint / Mgmt
- −$394
- Net cashflow
- $372
Break-even live
UW: 25.0% down · 7.5% · 30yr · 1.5% tax · 5.0% vac · 8.0% maint · 8.0% mgmt
Financing live
Cash to close
- Down payment
- $43,750
- Closing costs
- $5,250
- Reserves months
- —
- Total cash needed
- —
Loan-product check · same deal, 3 products live
Conventional
25% down · 7.5% · 30yr
- Down + closing
- —
- Monthly P&I
- —
- Monthly cashflow
- —
- DSCR
- —
- Eligible?
- —
Personal DTI + credit; lowest rate.
DSCR
20% down · 8.5% · 30yr
- Down + closing
- —
- Monthly P&I
- —
- Monthly cashflow
- —
- DSCR
- —
- Eligible?
- —
No personal income docs; deal must DSCR.
Hard money
10% down · 12.0% · 12mo
- Down + closing
- —
- Monthly P&I
- —
- Monthly cashflow
- —
- DSCR
- —
- Eligible?
- —
Short-term bridge; refi at stabilization.
Listing history 29 events
-
2026-06-18days on market $175,000 Active 85 DOM
-
2026-06-17days on market $175,000 Active 84 DOM
-
2026-06-16days on market $175,000 Active 83 DOM
-
2026-06-15days on market $175,000 Active 82 DOM
-
2026-06-13days on market $175,000 Active 80 DOM
-
2026-06-13days on market $175,000 Active 79 DOM
-
2026-06-09days on market $175,000 Active 76 DOM
-
2026-06-08days on market $175,000 Active 75 DOM
-
2026-06-07days on market $175,000 Active 74 DOM
-
2026-06-05days on market $175,000 Active 71 DOM
-
2026-06-03days on market $175,000 Active 70 DOM
-
2026-06-02days on market $175,000 Active 69 DOM
-
2026-06-01days on market $175,000 Active 68 DOM
-
2026-05-31days on market $175,000 Active 67 DOM
-
2026-03-26$175,000 Active
-
2026-03-22historical $175,000
-
2025-09-08historical $1,550
-
2025-08-26price $1,550
-
2025-08-14price $1,600
-
2025-08-06historical
-
2025-08-03price $1,650
-
2025-07-26$1,700
-
2025-07-20historical $1,700
-
2025-06-26$1,700
-
2025-06-19price $180,000
-
2025-05-20$195,000 Active
-
2022-05-19soldstatus
-
2018-09-26soldstatus
-
2018-05-01soldstatus
ⓘ Source: listings_history table (triggers on properties + properties_extension) + one-shot
backfill from property_details.listing_events for pre-trigger history.
Tax reassessment forecast KS · Resets to sale price
- Current annual tax
- $1,421 · $118/mo
- Projected year-2 tax
- $2,468 · $206/mo
- Expected delta
- +$1,046/yr (+$87/mo · 73.6%)
ⓘ Screening estimate from a state-policy table — verify with the county assessor before closing.
Climate risk First Street
- Flood 1/10 Low FEMA zone X (unshaded) · 0% chance over 30 yrs
- Wildfire 1/10 Low
- Heat 4/10 Moderate 7 d/yr ≥107°F today · 17 d/yr by 30 yrs out
- Wind 2/10 Low
- Air quality 3/10 Moderate 2 unhealthy d/yr today · 3 by 30 yrs out
Nearby sold comps map
Loading sold comps map…
Walkable amenities ~0.75 mi
Loading nearby amenities…
Taxation est. · year 1
- Rental income
- $22,497
- − Mortgage interest
- −$9,803
- − Property taxes
- −$1,421
- − Insurance
- −$875
- − Repairs & maintenance
- −$1,800
- − Management
- −$1,800
- − Depreciation
- −$5,091
- Taxable income
- $1,708
- Est. tax owed @ 24.0%
- −$410
- After-tax cash flow
- $4,054/yr
For passive investors: Depreciation is non-cash, so a rental often shows a tax loss while cash-flowing — sheltering income. Rental losses are passive: they offset passive income freely, and up to $25,000/yr can offset ordinary (W-2) income if you actively participate and your MAGI is under $100k (phasing out to $0 by $150k); unused losses carry forward. On sale, claimed depreciation is recaptured at up to 25%, and gains may owe capital-gains tax (a 1031 exchange can defer both). Figures are a year-1 estimate at your 24.0% rate — not tax advice; consult a CPA.
Schools (NCES district)
- District
- Kansas City
- NCES district ID
- 2007950
- Math proficiency
- 8% ▼ -10.00%
- Reading proficiency
- 15% ▼ -4.00%
- Median HH income
- $34,774
- Composite
- 9.38/100
- National rank
- #9856
- State rank
- #169 of 169 in KS
Livability — Kansas City
- Score
- 72/100
- State rank
- #103
- US rank
- #6054
Category grades
Schools grade is shown separately in the Schools card above.
Census & demographics
- Census place
- Kansas City, KS
- City population
- 130,206
- Population (ZIP)
- 26,820
Population outlook (Wyandotte County) Hauer SSP2
- Today (2025)
- 177,063 people
- By 2030
- 183,212 · +3.5%
- By 2040
- 195,697 · +10.5%
- By 2050
- 207,897 · +17.4%
- By 2075
- 236,169 · +33.4%
- By 2100
- 255,790 · +44.5%
Race, ethnicity, and origin ACS 2023
- Neighborhood character
- Highly diverse neighborhood (Simpson 0.72)
- Race & ethnicity
- Hispanic / Latino 37% Black 32% White 20% Two or more races 15% Asian 5% Native American 3%
- Hispanic origin (detail)
- Mexican 28%
- Common ancestry
- Iranian 1%
- Foreign-born
- 20% · Canada, Philippines
- Languages at home
- 61% English-only · Spanish 32% Other Asian/Pacific 4% Vietnamese 1%
Political lean MEDSL · Wyandotte
- 2024 margin
- Strong D (+23.9) · D 61.1% · R 37.3% · Other 1.6%
- 2008→2024 swing
- -17.0pp toward R · 2008: 40.9pp · 2024: 23.9pp
- All cycles
- 2024: D+23.9 2020: D+30.9 2016: D+29.1 2012: D+36.4 2008: D+40.9
Not yet ingested
- Civics
- —
Market trends
- HPI YoY
- ▼ -131.50%
- Current HPI
- 523.3956
- Rent YoY
- —
- Metro
- —
- State GDP YoY
- —
- F500 in state
- 0
Price history
-10.3% since first listed15 events — show timeline
- 2026-03-26 Listed $175,000 Heartland MLS as Distributed by MLS Grid
- 2026-03-22 Coming Soon $175,000 Heartland MLS as Distributed by MLS Grid
- 2025-09-08 Rental Removed $1,550 RENTEC
- 2025-08-26 Price Changed $1,550 RENTEC
- 2025-08-14 Price Changed $1,600 RENTEC
- 2025-08-06 Listing Removed — Heartland MLS as Distributed by MLS Grid
- 2025-08-03 Price Changed $1,650 RENTEC
- 2025-07-26 Listed for Rent $1,700 RENTEC
- 2025-07-20 Rental Removed $1,700 RENTEC
- 2025-06-26 Listed for Rent $1,700 RENTEC
- 2025-06-19 Price Changed $180,000 Heartland MLS as Distributed by MLS Grid
- 2025-05-20 Listed $195,000 Heartland MLS as Distributed by MLS Grid
- 2022-05-19 Sold (Public Records) — Public Records
- 2018-09-26 Sold (Public Records) — Public Records
- 2018-05-01 Sold (Public Records) — Public Records
Property tax history
+10.7%/yrLatest (2025): $1,421 · +36.9% YoY. Source: county tax records.
Cash-flow waterfall
monthlySold comps — $/sqft
last 12 mo · ≤1 miLoading sold comps…