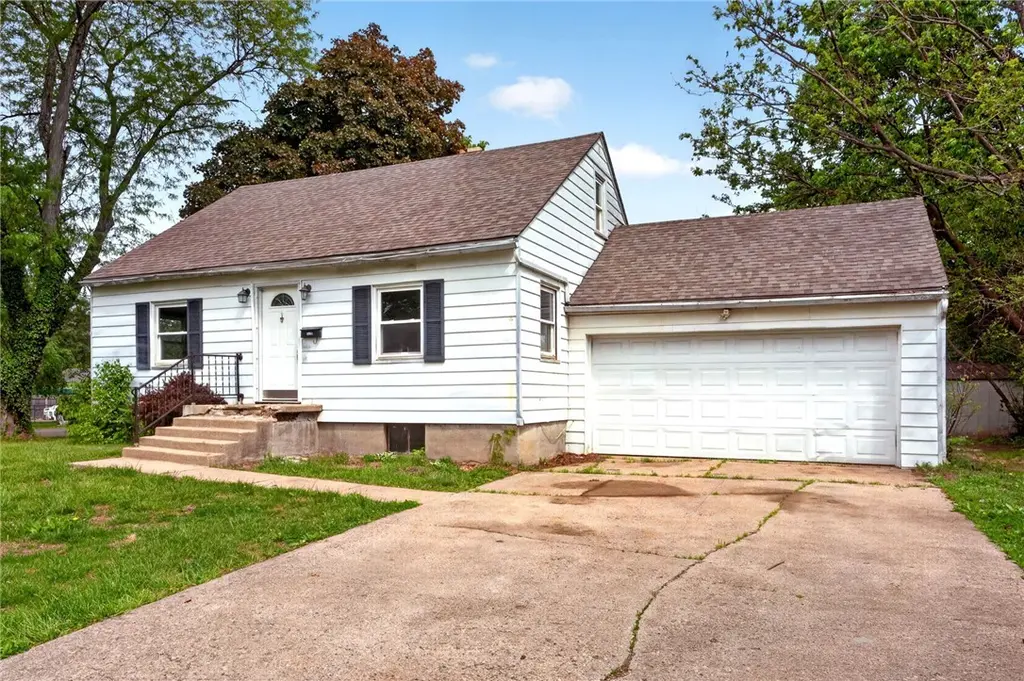
2005 Edgeworth Ave · Dayton, OH
Flood risk 7/10 · Major
- FEMA flood zone
- X (shaded)
- Chance of flooding over 30 yrs
- 0.77%
- Est. flood insurance / yr
- $473 – $860
Fire risk 1/10 · Minimal
- Est. fire insurance / yr
- $713 – $1,323
Heat risk 4/10 · Minor
- Hot days now (above 104°F)
- 7 days/yr
- Hot days in 30 yrs
- 18 days/yr
Wind risk 2/10 · Minimal
- Chance of severe wind over 30 yrs
- —
Air-quality risk 3/10 · Minor
- Unhealthy air days now
- 2 days/yr
- Unhealthy air days in 30 yrs
- 4 days/yr
Risk factors via First Street. Map © Google.
Why this score? — see what drove the C grade
The composite is a weighted blend of 9 inputs, each scored 0–100. Each bar is that input's sub-score; the figure is the points it added to the 100-point composite (weight × sub-score).
- Cash flow +23.6/30.0
- DSCR +7.6/10.0
- ARV discount +6.8/15.0
- 1% rule +6.7/10.0
- Schools +5.0/10.0
- Rent growth +4.4/5.0
- Livability +3.2/5.0
- Condition / age +2.5/5.0
- Appreciation +0.0/10.0
$105,000
🖨 Deal sheet 📄 Offer letter ✓ Due diligence
Listing remarks
Welcome to 2005 Edgeworth Avenue, a charming 3-bedroom, 1-bath Cape Cod full of character and opportunity. Step inside to find original hardwood floors flowing throughout the main level, adding warmth and timeless appeal. The upstairs offers a spacious third bedroom complete with its own sink—perfect for added convenience or a flexible living space. The home also features a full unfinished basement, providing plenty of storage or potential for future expansion. Outside, enjoy a large, private backyard with a patio area and a storage shed, ideal for relaxing or entertaining. Additional highlights include roof 2019, 1-car garage and a functional layout ready for your personal touch. Th
Key facts
- Patio area
- Storage shed
- 6,599 sq ft lot
Tags
Property features AI
Finance
- Financial info: Offered for sale
Exterior
- Parking: One-car garage
- Utilities: Natural gas available; Public water
- Home design: Single-story exterior appearance (1 story listed)
- Construction: Aluminum siding; Vinyl siding
- Exterior features: Residential zoning; Lot approximately 6,599 sq ft
Interior
- Kitchen: Kitchen on the main level
- Bedrooms: Bedroom on the second level; Bedroom on the main level
- Bathrooms: One full bathroom (main level)
- Heating & cooling: Natural gas heating; Central air conditioning
- Interior features: Full basement
- Laundry & utility: Utility room in the basement
Neighborhood map
What this means for you Summary
Snapshot
- This is a 3-bed/1.0-bath single-family listed at $105k.
Deal economics
- At list price, monthly cash flow is $143 ($2k/yr) — positive.
- The deal already cash-flows at list — no discount required.
- Meets the 1% rule at list price ($1k rent vs $105k).
- Recommended offer: $103k (1.5% below list) — sets the bar for market timing.
Location & tenants
- Location reads 65/100 on livability (#716 in OH) — a middle-class / working-renter tenant base. Strengths: cost of living A+, housing A+, health & safety A; Watch: schools C-, amenities C-, crime F.
- Market conditions: Rents rising fast (+7.4%/yr); 51 active listings in the ZIP; 34 comparable units currently listed for rent nearby; rentals at typical pace (median 24d on market — plan ~3-4 weeks tenant-placement turnaround); 907 units permitted in Montgomery County in 2024 (416 in 5+ unit buildings).
Forward outlook
- Local home prices are declining (-3.0%/yr); year-one equity from $726 of loan paydown is wiped out by about $3k of value loss. Plan a longer hold.
- Montgomery County population projected at -10% by 2050 — secular population decline; favor cash flow + early exit over multi-decade hold.
- At projected returns (-3.0% appreciation + 7.4% rent growth), your $29k cash investment doubles in ~9 years — after that, you're playing with house money.
Negotiation context
- It's been on market 30 days — a 2% lower offer ($103k) is reasonable based on typical stale-listing flexibility.
- Current owner paid $63k; list at $105k implies a 67% gain — meaningful room to come down on a strong offer.
Risks & watch-outs
- Watch-outs: flood insurance adds $56/mo; built in 1949 — expect roof / HVAC / electrical / plumbing capex.
- Climate carrying-cost: major flood risk — expect insurance premiums to compound above CPI over the hold.
Questions for the listing agent
- Built in 1949 — when were the roof, HVAC, electrical panel, plumbing, and water heater last replaced?
- What's the actual annual flood-insurance premium (NFIP or private), and is the property in a SFHA with mandatory coverage?
- Is there a deadline driving the sale (1031 exchange, divorce, estate, relocation)? That informs how much negotiation room exists.
- Crime grade is F in this area — have there been break-ins, vandalism, or insurance claims at this property in the last 3 years? What carrier currently insures it and at what premium?
- What's the average days-on-market for RENTAL listings here right now (not sales)? A rising rental-DOM trend means longer vacancies and softer asking-rent achievability than the comps imply.
- What's the recent tenant-quality profile in this submarket — average credit score on applications, eviction rate, late-payment / NSF rate, and stable-employment percentage? A property-management company in the area should have these aggregated.
- How much new for-sale + rental construction is in the pipeline within 1–3 miles? Heavy new supply typically softens prices + rents 12–24 months out; constrained supply supports both.
Investment metrics
- 1% rule
- 1.17% ✓
- Cap rate
- 8.57%
- Cash-on-cash
- 8.12%
- DSCR
- 1.36
- GRM
- 7.1
CMA / ARV
- ARV (median comp)
- $103,309
- List price
- $105,000
- Delta
- 1.64%
- Verdict
- FAIR
- Comps
- 20 within 1.0 mi
Show comp detail 12 sales within ~0.75 mi
| Address | Dist | Beds/Ba | Sqft | Sold | Price | $/sf | Match |
|---|---|---|---|---|---|---|---|
| 2039 Ontario Ave | 0.08mi | 3/1.5 | 1,142 (-5%) | 8mo | $85,000 | $74 | 80 |
| 2933 Lindale Ave | 0.25mi | 3/2.0 | 1,132 (-5%) | 2mo | $208,000 | $184 | 74 |
| 3413 Rolfe Ave | 0.46mi | 3/1.0 | 1,100 (-8%) | 3mo | $179,900 | $164 | 63 |
| 1404 Pinecrest Dr | 0.59mi | 3/1.5 | 1,256 (+5%) | 0mo | $205,000 | $163 | 62 |
| 3220 Zephyr Dr | 0.40mi | 3/2.0 | 1,292 (+8%) | 4mo | $219,000 | $170 | 60 |
| 250 E Parkwood Dr | 0.74mi | 3/1.0 | 1,176 (-2%) | 4mo | $120,000 | $102 | 59 |
| 1820 E Siebenthaler Ave | 0.39mi | 2/1.0 (-1) | 1,104 (-8%) | 6mo | $117,500 | $106 | 59 |
| 2513 Ome Ave | 0.55mi | 3/2.0 | 1,080 (-10%) | 0mo | $140,000 | $130 | 54 |
| 3832 Ridge Ave | 0.61mi | 2/2.0 (-1) | 1,277 (+7%) | 3mo | $65,000 | $51 | 49 |
| 3511 Ridge Ave | 0.52mi | 2/1.0 (-1) | 1,032 (-14%) | 4mo | $179,900 | $174 | 45 |
| 2650 Onaoto Ave | 0.71mi | 3/1.0 | 1,025 (-14%) | 2mo | $161,000 | $157 | 41 |
| 2059 Neff Rd | 0.72mi | 3/1.0 | 1,025 (-14%) | 8mo | $58,000 | $57 | 36 |
Match score weights: distance 35% · size 25% · config 20% · recency 20%. Top-matched comps best support the ARV.
Projected returns pro-forma
-3.0% appreciation · 7.41% rent growth · sell at horizon
- IRR
- -1.8%
- Equity multiple
- 0.93×
- Total profit
- $-2,133
- Equity at exit
- $15,656
- IRR
- 12.5%
- Equity multiple
- 2.22×
- Total profit
- $35,731
- Equity at exit
- $9,078
Cash invested: $29,400 (down + closing). Projections, not guarantees.
Landlord ↔ Tenant lean methodology
- Overall (STATE)
- 73 Landlord-Friendly
- State Ohio
- 73 Landlord-Friendly · R+6
- County
- — inherits STATE
- City
- — inherits STATE
ZIP-level market 45414
- Rents YoY
- 7.4%
- Active inventory
- 51
- Price-to-rent
- 7.1×
Monthly cashflow live
- Estimated rent
- $1,225 high interval (Pro) →
- Mortgage (P&I)
- −$551
- Tax from tax record
- −$174 /mo · $2,093/yr
- Insurance
- −$44
- Flood insurance flood zone
- −$56 /mo · $666/yr
- HOA
- −$0
- Vacancy / Maint / Mgmt
- −$257
- Net cashflow
- $143
Break-even live
UW: 25.0% down · 7.5% · 30yr · 1.5% tax · 5.0% vac · 8.0% maint · 8.0% mgmt
Financing live
Cash to close
- Down payment
- $26,250
- Closing costs
- $3,150
- Reserves months
- —
- Total cash needed
- —
Loan-product check · same deal, 3 products live
Conventional
25% down · 7.5% · 30yr
- Down + closing
- —
- Monthly P&I
- —
- Monthly cashflow
- —
- DSCR
- —
- Eligible?
- —
Personal DTI + credit; lowest rate.
DSCR
20% down · 8.5% · 30yr
- Down + closing
- —
- Monthly P&I
- —
- Monthly cashflow
- —
- DSCR
- —
- Eligible?
- —
No personal income docs; deal must DSCR.
Hard money
10% down · 12.0% · 12mo
- Down + closing
- —
- Monthly P&I
- —
- Monthly cashflow
- —
- DSCR
- —
- Eligible?
- —
Short-term bridge; refi at stabilization.
Rent comps 34 comps
| Address | Beds | Baths | Sqft | Rent | $/sqft | DOM | Units | Dist |
|---|---|---|---|---|---|---|---|---|
| 317 Fernwood Ave Dayton, OH | 3.0 | 1.0 | 1320 | $1,100 | $0.83 | 11d | 1 | 0.73mi |
| 2611 Onaoto Ave Dayton, OH | 3.0 | 1.0 | 1025 | $1,195 | $1.17 | 11d | 1 | 0.74mi |
| 220 Fernwood Ave Dayton, OH | 2.0 | 1.0 | 884 | $900 | $1.02 | 3d | 1 | 0.83mi |
| 152 Laura Ave Dayton, OH | 2.0 | 1.0 | 990 | $895 | $0.90 | 44d | 1 | 0.83mi |
| 147 Laura Ave Dayton, OH | 2.0 | 1.0 | 1096 | $975 | $0.89 | 23d | 1 | 0.84mi |
| 337 Ryburn Ave Unit 2 Dayton, OH | 2.0 | 1.0 | 900 | $800 | $0.89 | 44d | 1 | 0.85mi |
| 102 E Norman Ave Dayton, OH | 2.0 | 1.0 | 800 | $925 | $1.16 | 23d | 1 | 0.87mi |
| 419 Sandhurst Dr Dayton, OH | 2.0 | 1.0 | 950 | $975 | $1.03 | 23d | 1 | 0.95mi |
| 202 E Bruce Ave Apt 2 Dayton, OH | 2.0 | 1.0 | 1250 | $800 | $0.64 | 23d | 1 | 0.96mi |
| 31 E Norman Ave Dayton, OH | 3.0 | 1.0 | 1100 | $1,150 | $1.05 | 23d | 1 | 0.97mi |
| 65 E Maplewood Ave Dayton, OH | 2.0 | 1.0 | 1064 | $723 | $0.68 | 44d | 1 | 0.98mi |
| 42 Pointview Ave Unit 42 Dayton, OH | 3.0 | 2.0 | 1240 | $1,200 | $0.97 | 3d | 1 | 1.04mi |
| 38 Pointview Ave Dayton, OH | 2.0 | 1.0 | 1140 | $900 | $0.79 | 14d | 1 | 1.05mi |
| 2327 N Main St Unit 2 Dayton, OH | 2.0 | 1.0 | 900 | $1,200 | $1.33 | 23d | 1 | 1.05mi |
| 244 E Siebenthaler Ave Dayton, OH | 2.0 | 1.5 | 1273 | $1,175 | $0.92 | 3d | 1 | 1.06mi |
| 57 Walbrook Ave Dayton, OH | 2.0 | 1.0 | 861 | $975 | $1.13 | 3d | 1 | 1.06mi |
| 101 E Bruce Ave Dayton, OH | 3.0 | 1.0 | 1455 | $1,150 | $0.79 | 3d | 1 | 1.07mi |
| 228 E Siebenthaler Ave Dayton, OH | 2.0 | 1.0 | 934 | $1,200 | $1.28 | 44d | 1 | 1.08mi |
| 41 W Fairview Ave Unit 2 Dayton, OH | 3.0 | 1.0 | 1452 | $1,200 | $0.83 | 14d | 1 | 1.10mi |
| 2322 Koehler Ave Dayton, OH | 4.0 | 1.0 | 1155 | $1,350 | $1.17 | 3d | 1 | 1.13mi |
| 26 W Beechwood Ave Dayton, OH | 3.0 | 1.5 | 1468 | $1,050 | $0.72 | 44d | 1 | 1.13mi |
| 451 Hunter Ave Dayton, OH | 2.0 | 1.0 | 974 | $800 | $0.82 | 23d | 1 | 1.31mi |
| 181 W Norman Ave Dayton, OH | 3.0 | 2.0 | 1228 | $1,150 | $0.94 | 44d | 1 | 1.33mi |
| 167 W Hudson Ave Dayton, OH | 3.0 | 1.5 | 1344 | $1,185 | $0.88 | 44d | 1 | 1.34mi |
| 201 W Norman Ave Dayton, OH | 3.0 | 1.0 | 1424 | $1,200 | $0.84 | 44d | 1 | 1.35mi |
| 605 Forest Ave Dayton, OH | 2.0 | 1.0 | 978 | $650 | $0.66 | 23d | 1 | 1.36mi |
| 234 Santa Clara Ave Dayton, OH | 3.0 | 1.0 | 1368 | $1,125 | $0.82 | 44d | 1 | 1.38mi |
| 44 5 Oaks Ave Unit 2 Dayton, OH | 2.0 | 1.0 | 700 | $800 | $1.14 | 44d | 1 | 1.40mi |
| 412 W Parkwood Dr Unit 1 Dayton, OH | 2.0 | 1.0 | 900 | $875 | $0.97 | 23d | 1 | 1.42mi |
| 35 Neal Ave Dayton, OH | 2.0 | 1.0 | 728 | $875 | $1.20 | 23d | 1 | 1.45mi |
| 15 Camden Ave Dayton, OH | 2.0 | 1.0 | 833 | $950 | $1.14 | 44d | 1 | 1.47mi |
| 439 W Fairview Ave Dayton, OH | 3.0 | 1.0 | 1500 | $1,200 | $0.80 | 44d | 1 | 1.47mi |
| 240 Castlewood Ave Dayton, OH | 2.0 | 1.0 | 912 | $995 | $1.09 | 21d | 1 | 1.48mi |
| 265 Victor Ave Dayton, OH | 3.0 | 1.0 | 1204 | $900 | $0.75 | 44d | 1 | 1.49mi |
Listing history 6 events
-
2026-05-12price $105,000 850-char remark
-
2026-04-28$109,900 Active 850-char remark
-
2006-01-30soldstatus $62,900
-
2005-04-05soldstatus $36,000
-
1999-12-16soldstatus $45,025
-
1987-09-28soldstatus $41,900
ⓘ Source: listings_history table (triggers on properties + properties_extension) + one-shot
backfill from property_details.listing_events for pre-trigger history.
Tax reassessment forecast OH · Partial reset (capped growth)
- Current annual tax
- $2,093 · $174/mo
- Projected year-2 tax
- $2,093 · $174/mo
- Expected delta
- $0/yr ($0/mo · 0.0%)
ⓘ Screening estimate from a state-policy table — verify with the county assessor before closing.
Climate risk First Street
- Flood 7/10 Severe FEMA zone X (shaded) · 77% chance over 30 yrs
- Wildfire 1/10 Low
- Heat 4/10 Moderate 7 d/yr ≥104°F today · 18 d/yr by 30 yrs out
- Wind 2/10 Low
- Air quality 3/10 Moderate 2 unhealthy d/yr today · 4 by 30 yrs out
Nearby sold comps map
Loading sold comps map…
Walkable amenities ~0.75 mi
Loading nearby amenities…
Taxation est. · year 1
- Rental income
- $14,698
- − Mortgage interest
- −$5,882
- − Property taxes
- −$2,093
- − Insurance
- −$1,192
- − Repairs & maintenance
- −$1,176
- − Management
- −$1,176
- − Depreciation
- −$3,055
- Taxable income
- $126
- Est. tax owed @ 24.0%
- −$30
- After-tax cash flow
- $1,689/yr
For passive investors: Depreciation is non-cash, so a rental often shows a tax loss while cash-flowing — sheltering income. Rental losses are passive: they offset passive income freely, and up to $25,000/yr can offset ordinary (W-2) income if you actively participate and your MAGI is under $100k (phasing out to $0 by $150k); unused losses carry forward. On sale, claimed depreciation is recaptured at up to 25%, and gains may owe capital-gains tax (a 1031 exchange can defer both). Figures are a year-1 estimate at your 24.0% rate — not tax advice; consult a CPA.
Schools (NCES district)
No district data.
Livability — Dayton
- Score
- 65/100
- State rank
- #716
- US rank
- #12895
Category grades
Schools grade is shown separately in the Schools card above.
Census & demographics
- County
- Montgomery County · 459,541 people
- City population
- 164,387
- Metro
- Dayton-Kettering, OH
- Population (ZIP)
- 21,167
- Household income
- $54,485
- Rent vs Own
- Severe rent burden
- 801.0
Population outlook (Montgomery County) Hauer SSP2
- Today (2025)
- 523,241 people
- By 2030
- 514,948 · -1.6%
- By 2040
- 493,378 · -5.7%
- By 2050
- 469,639 · -10.2%
- By 2075
- 418,360 · -20.0%
- By 2100
- 353,315 · -32.5%
Race, ethnicity, and origin ACS 2023
- Neighborhood character
- Predominantly White (75%)
- Race & ethnicity
- White 75% Black 15% Two or more races 6% Hispanic / Latino 4% Asian 1%
- Common ancestry
- Slovak 2% Romanian 2% Italian 2%
- Foreign-born
- 4% · Canada
- Languages at home
- 94% English-only · Spanish 2% Arabic 1% Tagalog/Filipino 1%
Political lean MEDSL · Montgomery
- 2024 margin
- Toss-up / Even · D 49.8% · R 49.3%
- 2008→2024 swing
- -5.8pp toward R · 2008: 6.2pp · 2024: 0.5pp
- All cycles
- 2024: D+0.5 2020: D+2.2 2016: R+1.2 2012: D+3.1 2008: D+6.2
Not yet ingested
- Civics
- —
Market trends
- HPI YoY
- ▼ -142.46%
- Current HPI
- 183.1124
- Rent YoY
- ▲ 7.41%
- Metro
- Dayton-Kettering, OH
- State GDP YoY
- ▲ 1.98%
- F500 in state
- 48
Industry mix (Fortune 500 HQ in OH)
| Industry | F500 HQs | Revenue |
|---|---|---|
| Insurance | 3 | $145B |
|
||
| Industrial Machinery | 3 | $49B |
|
||
| Financial Services | 3 | $24B |
|
||
| Consumer Goods | 2 | $93B |
|
||
| Aerospace / Defense | 2 | $47B |
|
||
| Utilities | 2 | $33B |
|
||
Price history
+150.6% since first listed7 events — show timeline
- 2026-05-28 Pending — Dayton MLS
- 2026-05-12 Price Changed $105,000 Dayton MLS
- 2026-04-28 Listed $109,900 Dayton MLS
- 2006-01-30 Sold (Public Records) $62,900 Public Records
- 2005-04-05 Sold (Public Records) $36,000 Public Records
- 1999-12-16 Sold (Public Records) $45,025 Public Records
- 1987-09-28 Sold (Public Records) $41,900 Public Records
Property tax history
+3.5%/yrLatest (2025): $2,093 · -3.6% YoY. Source: county tax records.
Cash-flow waterfall
monthlySold comps — $/sqft
last 12 mo · ≤1 miLoading sold comps…