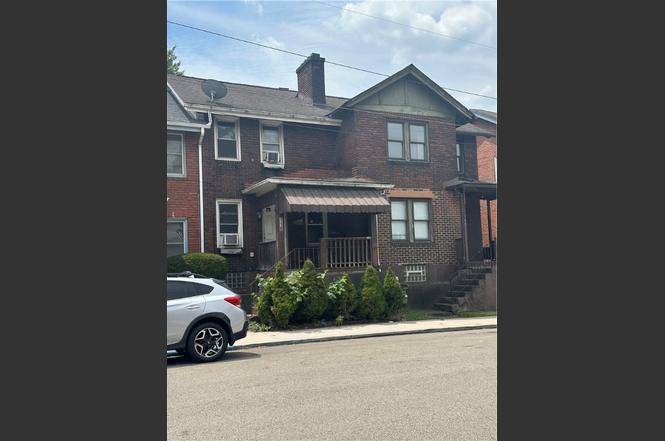
110 Center St · East Pittsburgh, PA
Flood risk 1/10 · Minimal
- FEMA flood zone
- X (unshaded)
- Chance of flooding over 30 yrs
- 0.0%
- Est. flood insurance / yr
- $473 – $860
Fire risk 1/10 · Minimal
- Est. fire insurance / yr
- $511 – $949
Heat risk 4/10 · Minor
- Hot days now (above 96°F)
- 7 days/yr
- Hot days in 30 yrs
- 18 days/yr
Wind risk 2/10 · Minimal
- Chance of severe wind over 30 yrs
- —
Air-quality risk 4/10 · Minor
- Unhealthy air days now
- 5 days/yr
- Unhealthy air days in 30 yrs
- 7 days/yr
Risk factors via First Street. Map © Google.
Why this score? — see what drove the B grade
The composite is a weighted blend of 9 inputs, each scored 0–100. Each bar is that input's sub-score; the figure is the points it added to the 100-point composite (weight × sub-score).
- Cash flow +30.0/30.0
- DSCR +10.0/10.0
- 1% rule +8.9/10.0
- ARV discount +7.5/15.0
- Appreciation +5.5/10.0
- Livability +3.3/5.0
- Rent growth +2.5/5.0
- Condition / age +2.5/5.0
- Schools +1.8/10.0
$75,000
🖨 Deal sheet (PDF) 📄 Offer letter ✓ Due diligence
Listing remarks MLS
Attached single family residence located in E Pittsburgh and conveniently located near Route 30 and minutes from Downtown Pittsburgh
Key facts
- 2 story brick home
- 1,463 sq ft lot
- Built 1953
Tags
Neighborhood map
What this means for you Summary
Snapshot
- This is a 2-bed/1.0-bath townhouse listed at $75k.
Deal economics
- At list price, monthly cash flow is $279 ($3k/yr) — positive.
- The deal already cash-flows at list — no discount required.
- Meets the 1% rule at list price ($1k rent vs $75k).
- Recommended offer: $66k (12.0% below list) — sets the bar for market timing.
Location & tenants
- Location reads 66/100 on livability (#1,022 in PA) — a middle-class / working-renter tenant base. Strengths: crime A+, commute A+, cost of living A+; Watch: amenities F, employment F, health & safety F.
- Woodland Hills SD (suburban): math 13% / reading 30% proficiency, ranked #486 of 539 in PA (top 90%) — low school quality limits family demand, transient renter base, plan for 1-2y turnover; 69% free/reduced lunch — lower-income household profile, screen leases tightly.
- Zoned schools: Wilkins El Steam Academy (math 8% / reading 17%, grade F, #1,362 of 1,518 statewide, top 92%, 416 students, 100% FRL); Dickson Prep Steam Academy (math 8% / reading 27%, grade F, #455 of 512 statewide, top 89%, 642 students, 100% FRL); Woodland Hills Hs (math 37% / reading 30%, grade F, #323 of 437 statewide, top 74%, 949 students, 89% FRL) — zoned schools average 96% FRL vs 69% district-wide (27 pts higher); higher-poverty schools than district average — tighter screening recommended.
- Market conditions: 14 active listings in the ZIP; 17 comparable units currently listed for rent nearby; rentals lingering (median 46d on market — plan ~5-8 weeks vacancy on turnover, expect pricing pressure); 53% of comp listings sitting > 30 days — soft ceiling on asking rent; 2,996 units permitted in Allegheny County in 2024 (1,588 in 5+ unit buildings).
Forward outlook
- In year one you build about $1k of equity ($519 loan paydown + $715 appreciation (0.9% local appreciation)).
- At projected returns (0.9% appreciation + 3.0% rent growth), your $21k cash investment doubles in ~5 years — after that, you're playing with house money.
Negotiation context
- It's been on market 164 days — a 12% lower offer ($66k) is reasonable based on typical stale-listing flexibility.
- 4 sale attempts since 15y ago; this cycle's ask has dropped $10k (12%) from the opening price — seller is motivated, your offer sets the floor, not the list.
- Current owner paid $20k; list at $75k implies a 277% gain — meaningful room to come down on a strong offer.
Risks & watch-outs
- Watch-outs: built in 1953 — expect roof / HVAC / electrical / plumbing capex.
Questions for the listing agent
- It's been on market 164 days. Have you received any prior offers? Is the seller open to a 12% concession, seller financing, or rate buy-down credit?
- Built in 1953 — when were the roof, HVAC, electrical panel, plumbing, and water heater last replaced?
- Why hasn't it sold? Are there any deal-killer items the seller is aware of (foundation, flood, title, zoning, code violations)?
- Is there a deadline driving the sale (1031 exchange, divorce, estate, relocation)? That informs how much negotiation room exists.
- Schools are F-rated, which usually means shorter tenancies and higher turnover. Who's the typical renter profile here, and what's been the actual vacancy rate?
- What's the average days-on-market for RENTAL listings here right now (not sales)? A rising rental-DOM trend means longer vacancies and softer asking-rent achievability than the comps imply.
- What's the recent tenant-quality profile in this submarket — average credit score on applications, eviction rate, late-payment / NSF rate, and stable-employment percentage? A property-management company in the area should have these aggregated.
- How much new for-sale + rental construction is in the pipeline within 1–3 miles? Heavy new supply typically softens prices + rents 12–24 months out; constrained supply supports both.
Investment metrics
- 1% rule
- 1.39% ✓
- Cap rate
- 10.76%
- Cash-on-cash
- 15.95%
- DSCR
- 1.71
- GRM
- 6.0
CMA / ARV
- ARV (on-the-fly)
- $45,968
- Comps found
- 1
Show comp detail 1 sale within ~0.75 mi
| Address | Dist | Beds/Ba | Sqft | Sold | Price | $/sf | Match |
|---|---|---|---|---|---|---|---|
| 545 Howard St | 0.32mi | 2/1.0 | 960 (+9%) | 15mo | $50,000 | $52 | 58 |
Match score weights: distance 35% · size 25% · config 20% · recency 20%. Top-matched comps best support the ARV.
Projected returns pro-forma
0.95% appreciation · 3.0% rent growth · sell at horizon
- IRR
- 17.8%
- Equity multiple
- 1.91×
- Total profit
- $19,037
- Equity at exit
- $25,424
- IRR
- 21.1%
- Equity multiple
- 3.55×
- Total profit
- $53,463
- Equity at exit
- $33,647
Cash invested: $21,000 (down + closing). Projections, not guarantees.
Landlord ↔ Tenant lean methodology
- Overall (STATE)
- 62 Landlord-Friendly
- State Pennsylvania
- 62 Landlord-Friendly · EVEN
- County
- — inherits STATE
- City
- — inherits STATE
ZIP-level market 15112
- Home prices YoY
- 0.5%
- Active inventory
- 14
- Price-to-rent
- 6.0×
Monthly cashflow live
- Estimated rent
- $1,040 high interval (Pro) →
- Mortgage (P&I)
- −$393
- Tax from tax record
- −$118 /mo · $1,414/yr
- Insurance
- −$31
- HOA
- −$0
- Vacancy / Maint / Mgmt
- −$218
- Net cashflow
- $279
Break-even live
Sensitivity live
| Price | -10% $322 | -5% $300 | +0% $279 | +5% $258 | +10% $237 |
|---|---|---|---|---|---|
| Rent | -10% $197 | -5% $238 | +0% $279 | +5% $320 | +10% $361 |
| Rate | -1.0pp $317 | -0.5pp $298 | base $279 | +0.5pp $260 | +1.0pp $240 |
UW: 25.0% down · 7.5% · 30yr · 1.5% tax · 5.0% vac · 8.0% maint · 8.0% mgmt
Financing live
Cash to close
- Down payment
- $18,750
- Closing costs
- $2,250
- Reserves months
- —
- Total cash needed
- —
Loan-product check · same deal, 3 products live
Conventional
25% down · 7.5% · 30yr
- Down + closing
- —
- Monthly P&I
- —
- Monthly cashflow
- —
- DSCR
- —
- Eligible?
- —
Personal DTI + credit; lowest rate.
DSCR
20% down · 8.5% · 30yr
- Down + closing
- —
- Monthly P&I
- —
- Monthly cashflow
- —
- DSCR
- —
- Eligible?
- —
No personal income docs; deal must DSCR.
Hard money
10% down · 12.0% · 12mo
- Down + closing
- —
- Monthly P&I
- —
- Monthly cashflow
- —
- DSCR
- —
- Eligible?
- —
Short-term bridge; refi at stabilization.
Rent comps 17 comps
| Address | Beds | Baths | Sqft | Rent | $/sqft | DOM | Units | Dist |
|---|---|---|---|---|---|---|---|---|
| 411 Franklin St Unit 3 East Pittsburgh, PA | 1.0 | 1.0 | 646 | $1,050 | $1.63 | 45d | 1 | 0.17mi |
| 1508 Ridge Ave Unit 3 Braddock, PA | 1.0 | 1.0 | 850 | $680 | $0.80 | 45d | 1 | 0.57mi |
| 810 Wood St Unit 1 East Pittsburgh, PA | 1.0 | 1.0 | 1000 | $1,200 | $1.20 | 9d | 1 | 0.59mi |
| 1310 Brinton Ave Unit 1 Braddock, PA | 2.0 | 1.0 | 800 | $1,000 | $1.25 | 45d | 1 | 0.65mi |
| 219 North Ave Unit 1 East Pittsburgh, PA | 2.0 | 1.0 | 850 | $900 | $1.06 | 5d | 1 | 0.88mi |
| 227 Parklane Dr Unit Parklane Dr unit North Braddock, PA | 3.0 | 1.0 | 1107 | $1,500 | $1.36 | 14d | 1 | 0.96mi |
| 817 Kirkpatrick Ave Unit 8171-A Braddock, PA | 2.0 | 1.0 | 866 | $800 | $0.92 | 45d | 1 | 1.02mi |
| 287 Palma St North Versailles, PA | 3.0 | 1.5 | 1008 | $1,395 | $1.38 | 45d | 1 | 1.10mi |
| 12 Demmer Ave Unit 2 Pittsburgh, PA | 1.0 | 1.0 | 750 | $725 | $0.97 | 25d | 1 | 1.16mi |
| 906 Penn Ave Unit B Turtle Creek, PA | 3.0 | 1.0 | 820 | $1,250 | $1.52 | 45d | 1 | 1.18mi |
| 906 Penn Ave Unit A Turtle Creek, PA | 2.0 | 2.0 | 1122 | $1,250 | $1.11 | 45d | 1 | 1.18mi |
| 906 Penn Ave Turtle Creek, PA | 1.0 | 1.0 | 588 | $895 | $1.52 | 5d | 1 | 1.18mi |
| 906 Penn Ave Unit B Turtle Creek, PA | 3.0 | 1.0 | 820 | $1,250 | $1.52 | 25d | 1 | 1.18mi |
| 221 Grant St Unit 221-B Turtle Creek, PA | 2.0 | 1.0 | 756 | $775 | $1.03 | 45d | 1 | 1.28mi |
| 1806 Greensburg Ave North Versailles Township, PA | 1.0–2.0 | 1.0 | 750 | $1,015 | $1.35 | 3d | 10 | 1.36mi |
| 505 Washington St Turtle Creek, PA | 2.0 | 1.0 | 1064 | $1,200 | $1.13 | 45d | 1 | 1.39mi |
| 918 Oak Ave Turtle Creek, PA | 1.0 | 1.0 | 750 | $1,100 | $1.47 | 25d | 1 | 1.42mi |
Listing history 11 events
-
2025-12-23status Pending
-
2025-10-08price $75,000
-
2025-07-12$85,000 Active
-
2025-07-04historical Expired 132-char remark
Show marketing remark (132 chars)
Attached single family residence located in E Pittsburgh and conveniently located near Route 30 and minutes from Downtown Pittsburgh
-
2025-01-17$85,000 Active 132-char remark
Show marketing remark (132 chars)
Attached single family residence located in E Pittsburgh and conveniently located near Route 30 and minutes from Downtown Pittsburgh
-
2024-12-31historical Expired 210-char remark
Show marketing remark (210 chars)
Attached single family residence located in E Pittsburgh and conveniently located near Route 30 and minutes from Downtown Pittsburgh. Property being sold with larger portfolio but could also be sold separately.
-
2024-09-16$85,000 Active 210-char remark
Show marketing remark (210 chars)
Attached single family residence located in E Pittsburgh and conveniently located near Route 30 and minutes from Downtown Pittsburgh. Property being sold with larger portfolio but could also be sold separately.
-
2012-10-25soldstatus $19,900
-
2011-04-15$22,000
-
1986-07-11soldstatus $13,000
-
1975-04-16soldstatus $8,400
ⓘ Source: listings_history table (triggers on properties + properties_extension) + one-shot
backfill from property_details.listing_events for pre-trigger history.
Tax reassessment forecast PA · Partial reset (capped growth)
- Current annual tax
- $1,414 · $118/mo
- Projected year-2 tax
- $1,414 · $118/mo
- Expected delta
- $0/yr ($0/mo · 0.0%)
ⓘ Screening estimate from a state-policy table — verify with the county assessor before closing.
Climate risk First Street
- Flood 1/10 Low FEMA zone X (unshaded) · 0% chance over 30 yrs
- Wildfire 1/10 Low
- Heat 4/10 Moderate 7 d/yr ≥96°F today · 18 d/yr by 30 yrs out
- Wind 2/10 Low
- Air quality 4/10 Moderate 5 unhealthy d/yr today · 7 by 30 yrs out
Nearby sold comps map
Loading sold comps map…
Walkable amenities ~0.75 mi
Loading nearby amenities…
Taxation est. · year 1
- Rental income
- $12,477
- − Mortgage interest
- −$4,201
- − Property taxes
- −$1,414
- − Insurance
- −$375
- − Repairs & maintenance
- −$998
- − Management
- −$998
- − Depreciation
- −$2,182
- Taxable income
- $2,309
- Est. tax owed @ 24.0%
- −$554
- After-tax cash flow
- $2,794/yr
For passive investors: Depreciation is non-cash, so a rental often shows a tax loss while cash-flowing — sheltering income. Rental losses are passive: they offset passive income freely, and up to $25,000/yr can offset ordinary (W-2) income if you actively participate and your MAGI is under $100k (phasing out to $0 by $150k); unused losses carry forward. On sale, claimed depreciation is recaptured at up to 25%, and gains may owe capital-gains tax (a 1031 exchange can defer both). Figures are a year-1 estimate at your 24.0% rate — not tax advice; consult a CPA.
Schools (NCES district)
- District
- Woodland Hills SD
- NCES district ID
- 4216500
- Math proficiency
- 13% ▼ -13.00%
- Reading proficiency
- 30% ▼ -10.00%
- Median HH income
- $41,803
- Composite
- 18.31/100
- National rank
- #8954
- State rank
- #486 of 539 in PA
Livability — East Pittsburgh
- Score
- 66/100
- State rank
- #1022
- US rank
- #11300
Category grades
Schools grade is shown separately in the Schools card above.
Census & demographics
- Census place
- East Pittsburgh, PA
- Population (ZIP)
- 3,345
Population outlook (Allegheny County) Hauer SSP2
- Today (2025)
- 1,250,282 people
- By 2030
- 1,256,482 · +0.5%
- By 2040
- 1,256,318 · +0.5%
- By 2050
- 1,244,169 · -0.5%
- By 2075
- 1,197,693 · -4.2%
- By 2100
- 1,093,187 · -12.6%
Race, ethnicity, and origin ACS 2023
- Neighborhood character
- Diverse neighborhood (Simpson 0.57)
- Race & ethnicity
- Black 47% White 45% Two or more races 7% Hispanic / Latino 2%
- Common ancestry
- Romanian 5% Serbian 1% Slovak 1%
- Foreign-born
- 1%
- Languages at home
- 96% English-only · Spanish 2% Other Indo-European 1%
Political lean MEDSL · Allegheny
- 2024 margin
- Strong D (+20.3) · D 59.7% · R 39.4%
- 2008→2024 swing
- +4.8pp toward D · 2008: 15.5pp · 2024: 20.3pp
- All cycles
- 2024: D+20.3 2020: D+20.4 2016: D+16.4 2012: D+14.4 2008: D+15.5
Not yet ingested
- Civics
- —
Market trends
- HPI YoY
- ▲ 0.95%
- Current HPI
- 176.5537
- Rent YoY
- —
- Metro
- —
- State GDP YoY
- ▲ 1.68%
- F500 in state
- 34
Industry mix (Fortune 500 HQ in PA)
| Industry | F500 HQs | Revenue |
|---|---|---|
| Healthcare | 2 | $309B |
|
||
| Insurance | 2 | $27B |
|
||
| Telecommunications / Media | 1 | $124B |
|
||
| Industrial Distribution | 1 | $22B |
|
||
| Financial Services | 1 | $20B |
|
||
| Chemicals / Materials | 1 | $18B |
|
||
Price history
+792.9% since first listed11 events — show timeline
- 2025-12-23 Pending — West Penn MLS
- 2025-10-08 Price Changed $75,000 West Penn MLS
- 2025-07-12 Listed $85,000 West Penn MLS
- 2025-07-04 Delisted — West Penn MLS
- 2025-01-17 Listed $85,000 West Penn MLS
- 2024-12-31 Delisted — West Penn MLS
- 2024-09-16 Listed $85,000 West Penn MLS
- 2012-10-25 Sold (Public Records) $19,900 Public Records
- 2011-04-15 Listed $22,000 West Penn MLS
- 1986-07-11 Sold (Public Records) $13,000 Public Records
- 1975-04-16 Sold (Public Records) $8,400 Public Records
Property tax history
+5.1%/yrLatest (2026): $1,414 · +6.2% YoY. Source: county tax records.
Cash-flow waterfall
monthlySold comps — $/sqft
last 12 mo · ≤1 miLoading sold comps…