191 Refugio · La Ward, TX
Flood risk No data
- FEMA flood zone
- —
- Chance of flooding over 30 yrs
- —
- Est. flood insurance / yr
- —
Fire risk No data
- Est. fire insurance / yr
- —
Heat risk No data
- Hot days now (above threshold)
- —
- Hot days in 30 yrs
- —
Wind risk No data
- Chance of severe wind over 30 yrs
- —
Air-quality risk No data
- Unhealthy air days now
- —
- Unhealthy air days in 30 yrs
- —
Risk factors via First Street. Map © Google.
Why this score? — see what drove the B grade
The composite is a weighted blend of 9 inputs, each scored 0–100. Each bar is that input's sub-score; the figure is the points it added to the 100-point composite (weight × sub-score).
- Cash flow +30.0/30.0
- DSCR +10.0/10.0
- 1% rule +9.0/10.0
- ARV discount +7.5/15.0
- Schools +5.2/10.0
- Appreciation +5.0/10.0
- Livability +2.8/5.0
- Rent growth +2.5/5.0
- Condition / age +2.2/5.0
$68,500
🖨 Deal sheet 📄 Offer letter ✓ Due diligence
Listing remarks MLS
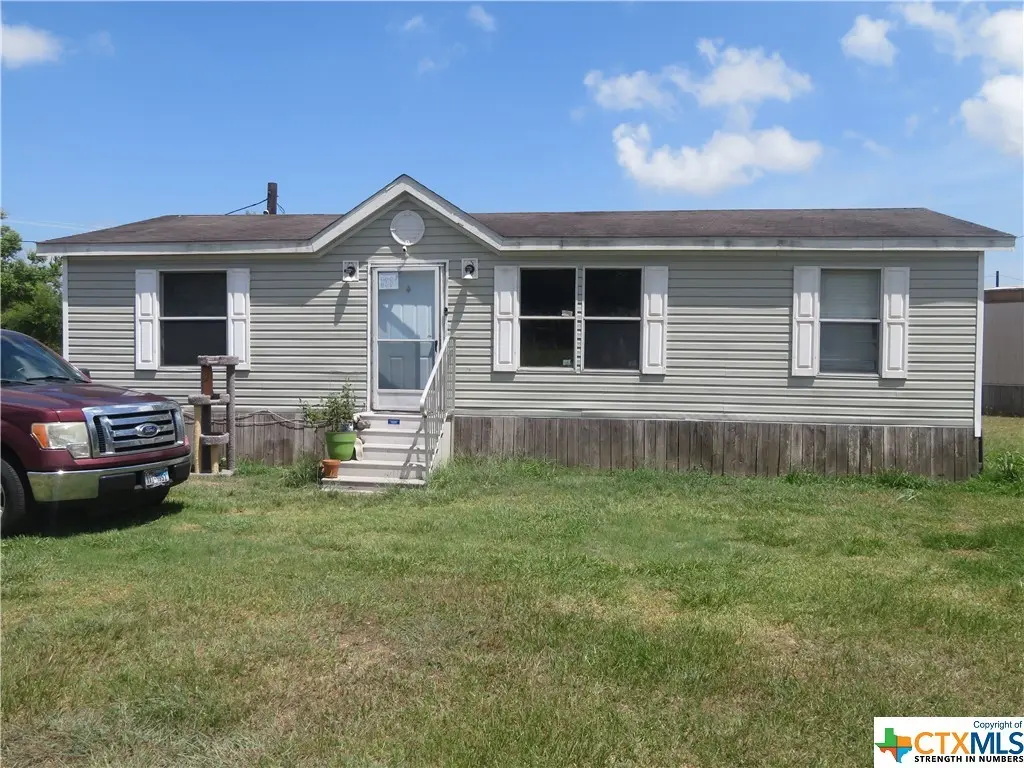
3 bedroom 2 bath 960 sq ft double wide mobile home built in 2007 in LAWARD Tx in the Industrial School District is up for sale. The home is a rental currently occupied. There is an open floor plan with a master bedroom and bathroom as well as two small bedrooms and a hall bathroom. This is a very good income producer or maybe a first-time home. Come see it!
Key facts
- 6,751 sq ft lot
- Built 2007
- Listed 1047 days
Neighborhood map
What this means for you Summary
Snapshot
- This is a 3-bed/2.0-bath manufactured listed at $68k. Condition is rated fair.
Deal economics
- At list price, monthly cash flow is $284 ($3k/yr) — positive.
- The deal already cash-flows at list — no discount required.
- Meets the 1% rule at list price ($958 rent vs $68k).
- Recommended offer: $60k (12.0% below list) — sets the bar for market timing.
Location & tenants
- Location reads 55/100 on livability (#1,349 in TX) — a working-class tenant base; expect higher turnover. Strengths: cost of living A+; Watch: health & safety C-, schools F, crime F.
- Industrial ISD (rural): math 59% / reading 59% proficiency, ranked #61 of 826 in TX (top 7%) — acceptable for families but not a draw, mixed tenant base, ~2y average lease.
- Market conditions: 12 active listings in the ZIP.
Forward outlook
- In year one you build about $3k of equity ($474 loan paydown + $2k appreciation (3.0% local appreciation)).
- Jackson County population projected at +28% by 2050 — long-run rental-demand tailwind backs the buy-and-hold thesis.
- At projected returns (3.0% appreciation + 3.0% rent growth), your $19k cash investment doubles in ~4 years — after that, you're playing with house money.
Negotiation context
- It's been on market 1048 days — a 12% lower offer ($60k) is reasonable based on typical stale-listing flexibility.
Questions for the listing agent
- It's been on market 1048 days. Have you received any prior offers? Is the seller open to a 12% concession, seller financing, or rate buy-down credit?
- Have any recent inspections been done? Can we get a copy of the seller's disclosures and any deferred-maintenance estimates?
- Why hasn't it sold? Are there any deal-killer items the seller is aware of (foundation, flood, title, zoning, code violations)?
- Is there a deadline driving the sale (1031 exchange, divorce, estate, relocation)? That informs how much negotiation room exists.
- Schools are F-rated, which usually means shorter tenancies and higher turnover. Who's the typical renter profile here, and what's been the actual vacancy rate?
- Crime grade is F in this area — have there been break-ins, vandalism, or insurance claims at this property in the last 3 years? What carrier currently insures it and at what premium?
- What's the average days-on-market for RENTAL listings here right now (not sales)? A rising rental-DOM trend means longer vacancies and softer asking-rent achievability than the comps imply.
- What's the recent tenant-quality profile in this submarket — average credit score on applications, eviction rate, late-payment / NSF rate, and stable-employment percentage? A property-management company in the area should have these aggregated.
- How much new for-sale + rental construction is in the pipeline within 1–3 miles? Heavy new supply typically softens prices + rents 12–24 months out; constrained supply supports both.
Investment metrics
- 1% rule
- 1.40% ✓
- Cap rate
- 11.26%
- Cash-on-cash
- 17.74%
- DSCR
- 1.79
- GRM
- 6.0
CMA / ARV
No comps found within radius.
Projected returns pro-forma
3.0% appreciation · 3.0% rent growth · sell at horizon
- IRR
- 24.2%
- Equity multiple
- 2.37×
- Total profit
- $26,327
- Equity at exit
- $30,801
- IRR
- 25.0%
- Equity multiple
- 4.57×
- Total profit
- $68,440
- Equity at exit
- $47,467
Cash invested: $19,180 (down + closing). Projections, not guarantees.
Landlord ↔ Tenant lean methodology
- Overall (STATE)
- 87 Strongly Landlord-Friendly
- State Texas
- 87 Strongly Landlord-Friendly · R+5
- County
- — inherits STATE
- City
- — inherits STATE
ZIP-level market 77971
- Active inventory
- 12
- Price-to-rent
- 6.0×
Monthly cashflow live
- Estimated rent
- $958 medium interval (Pro) →
- Mortgage (P&I)
- −$359
- Tax est. 1.5%
- −$86 /mo · $1,028/yr
- Insurance
- −$29
- HOA
- −$0
- Vacancy / Maint / Mgmt
- −$201
- Net cashflow
- $284
Break-even live
UW: 25.0% down · 7.5% · 30yr · 1.5% tax · 5.0% vac · 8.0% maint · 8.0% mgmt
Financing live
Cash to close
- Down payment
- $17,125
- Closing costs
- $2,055
- Reserves months
- —
- Total cash needed
- —
Loan-product check · same deal, 3 products live
Conventional
25% down · 7.5% · 30yr
- Down + closing
- —
- Monthly P&I
- —
- Monthly cashflow
- —
- DSCR
- —
- Eligible?
- —
Personal DTI + credit; lowest rate.
DSCR
20% down · 8.5% · 30yr
- Down + closing
- —
- Monthly P&I
- —
- Monthly cashflow
- —
- DSCR
- —
- Eligible?
- —
No personal income docs; deal must DSCR.
Hard money
10% down · 12.0% · 12mo
- Down + closing
- —
- Monthly P&I
- —
- Monthly cashflow
- —
- DSCR
- —
- Eligible?
- —
Short-term bridge; refi at stabilization.
Listing history 7 events
-
2026-06-02days on market $68,500 Active 1048 DOM
-
2026-06-01days on market $68,500 Active 1047 DOM
-
2026-05-31days on market $68,500 Active 1046 DOM
-
2025-06-13price $68,500 359-char remark
Show marketing remark (359 chars)
3 bedroom 2 bath 960 sq ft double wide mobile home built in 2007 in LAWARD Tx in the Industrial School District is up for sale. The home is a rental currently occupied. There is an open floor plan with a master bedroom and bathroom as well as two small bedrooms and a hall bathroom. This is a very good income producer or maybe a first-time home. Come see it!
-
2024-11-06price $72,500 359-char remark
Show marketing remark (359 chars)
3 bedroom 2 bath 960 sq ft double wide mobile home built in 2007 in LAWARD Tx in the Industrial School District is up for sale. The home is a rental currently occupied. There is an open floor plan with a master bedroom and bathroom as well as two small bedrooms and a hall bathroom. This is a very good income producer or maybe a first-time home. Come see it!
-
2024-06-13price $87,000 359-char remark
Show marketing remark (359 chars)
3 bedroom 2 bath 960 sq ft double wide mobile home built in 2007 in LAWARD Tx in the Industrial School District is up for sale. The home is a rental currently occupied. There is an open floor plan with a master bedroom and bathroom as well as two small bedrooms and a hall bathroom. This is a very good income producer or maybe a first-time home. Come see it!
-
2023-07-20$89,500 Active 359-char remark
Show marketing remark (359 chars)
3 bedroom 2 bath 960 sq ft double wide mobile home built in 2007 in LAWARD Tx in the Industrial School District is up for sale. The home is a rental currently occupied. There is an open floor plan with a master bedroom and bathroom as well as two small bedrooms and a hall bathroom. This is a very good income producer or maybe a first-time home. Come see it!
ⓘ Source: listings_history table (triggers on properties + properties_extension) + one-shot
backfill from property_details.listing_events for pre-trigger history.
Nearby sold comps map
Loading sold comps map…
Walkable amenities ~0.75 mi
Loading nearby amenities…
Taxation est. · year 1
- Rental income
- $11,498
- − Mortgage interest
- −$3,837
- − Property taxes
- −$1,028
- − Insurance
- −$342
- − Repairs & maintenance
- −$920
- − Management
- −$920
- − Depreciation
- −$1,993
- Taxable income
- $2,459
- Est. tax owed @ 24.0%
- −$590
- After-tax cash flow
- $2,813/yr
For passive investors: Depreciation is non-cash, so a rental often shows a tax loss while cash-flowing — sheltering income. Rental losses are passive: they offset passive income freely, and up to $25,000/yr can offset ordinary (W-2) income if you actively participate and your MAGI is under $100k (phasing out to $0 by $150k); unused losses carry forward. On sale, claimed depreciation is recaptured at up to 25%, and gains may owe capital-gains tax (a 1031 exchange can defer both). Figures are a year-1 estimate at your 24.0% rate — not tax advice; consult a CPA.
Condition & rehab AI · 7 photos
This 2007 manufactured home requires moderate updates to kitchen cabinets, bathroom fixtures, and exterior siding to improve its condition and appeal.
Repairs flagged
- Minor kitchen cabinets — slight wear
- Minor bathroom fixtures — slight wear
- Moderate exterior siding — moderate wear
Value-add opportunities
- Both update kitchen cabinets — modernizes and increases appeal
- Both replace bathroom fixtures — modernizes and increases appeal
- Both repair exterior siding — improves curb appeal and value
Renovation cost estimate screening
| Repair item | Severity | Est. cost |
|---|---|---|
| kitchen cabinets · slight wear | Minor | $500–3,000 |
| bathroom fixtures · slight wear | Minor | $500–3,000 |
| exterior siding · moderate wear | Moderate | $3,000–15,000 |
| Total estimated repair cost · 3 items | $4,000–21,000 |
Value-add ROI direction
- Both update kitchen cabinets — modernizes and increases appeal ↑
- Both replace bathroom fixtures — modernizes and increases appeal ↑
- Both repair exterior siding — improves curb appeal and value ↑
ⓘ Cost ranges are severity-bucket heuristics (US national rule-of-thumb). Get contractor quotes + a written scope before underwriting a rehab budget.
Schools (NCES district)
- District
- Industrial ISD
- NCES district ID
- 4824150
- Math proficiency
- 59% ▼ -6.00%
- Reading proficiency
- 59% ▲ 1.00%
- Median HH income
- $64,995
- Composite
- 51.69/100
- National rank
- #1693
- State rank
- #61 of 826 in TX
Livability — La Ward
- Score
- 55/100
- State rank
- #1349
- US rank
- #23270
Category grades
Schools grade is shown separately in the Schools card above.
Census & demographics
- Census place
- La Ward, TX
- Population (ZIP)
- 716
Population outlook (Jackson County) Hauer SSP2
- Today (2025)
- 16,579 people
- By 2030
- 17,480 · +5.4%
- By 2040
- 19,328 · +16.6%
- By 2050
- 21,182 · +27.8%
- By 2075
- 25,781 · +55.5%
- By 2100
- 28,184 · +70.0%
Race, ethnicity, and origin ACS 2023
- Neighborhood character
- Majority White (57%)
- Race & ethnicity
- White 57% Hispanic / Latino 43%
- Hispanic origin (detail)
- Mexican 43%
- Common ancestry
- German 13%
- Languages at home
- 91% English-only · Spanish 9%
Political lean MEDSL · Jackson
- 2024 margin
- Solid R (+70.8) · D 14.3% · R 85.1%
- 2008→2024 swing
- -22.9pp toward R · 2008: -47.9pp · 2024: -70.8pp
- All cycles
- 2024: R+70.8 2020: R+66.2 2016: R+63.7 2012: R+56.5 2008: R+47.9
Not yet ingested
- Civics
- —
Market trends
- HPI YoY
- —
- Current HPI
- —
- Rent YoY
- —
- Metro
- —
- State GDP YoY
- ▲ 3.95%
- F500 in state
- 110
Industry mix (Fortune 500 HQ in TX)
| Industry | F500 HQs | Revenue |
|---|---|---|
| Energy | 16 | $1,198B |
|
||
| Technology | 5 | $198B |
|
||
| Engineering / Construction | 4 | $72B |
|
||
| Energy Services | 3 | $60B |
|
||
| Utilities | 3 | $41B |
|
||
| Healthcare | 2 | $330B |
|
||
Price history
-23.5% since first listed4 events — show timeline
- 2025-06-13 Price Changed $68,500 CTXMLS
- 2024-11-06 Price Changed $72,500 CTXMLS
- 2024-06-13 Price Changed $87,000 CTXMLS
- 2023-07-20 Listed $89,500 CTXMLS
Cash-flow waterfall
monthlySold comps — $/sqft
last 12 mo · ≤1 miLoading sold comps…