None · Okolona, MS
Flood risk 1/10 · Minimal
- FEMA flood zone
- A
- Chance of flooding over 30 yrs
- 0.0%
- Est. flood insurance / yr
- $1,009 – $1,996
Fire risk 2/10 · Minimal
- Est. fire insurance / yr
- $1,241 – $2,305
Heat risk 6/10 · Moderate
- Hot days now (above 109°F)
- 7 days/yr
- Hot days in 30 yrs
- 20 days/yr
Wind risk 6/10 · Moderate
- Chance of severe wind over 30 yrs
- 27.0%
Air-quality risk 1/10 · Minimal
- Unhealthy air days now
- 0 days/yr
- Unhealthy air days in 30 yrs
- 0 days/yr
Risk factors via First Street. Map © Google.
Why this score? — see what drove the D+ grade
The composite is a weighted blend of 9 inputs, each scored 0–100. Each bar is that input's sub-score; the figure is the points it added to the 100-point composite (weight × sub-score).
- Cash flow +15.0/30.0
- ARV discount +7.5/15.0
- 1% rule +5.0/10.0
- DSCR +5.0/10.0
- Appreciation +4.8/10.0
- Livability +3.1/5.0
- Rent growth +2.5/5.0
- Condition / age +2.5/5.0
- Schools +1.6/10.0
$9,950
🖨 Deal sheet (PDF) 📄 Offer letter ✓ Due diligence
Listing remarks MLS
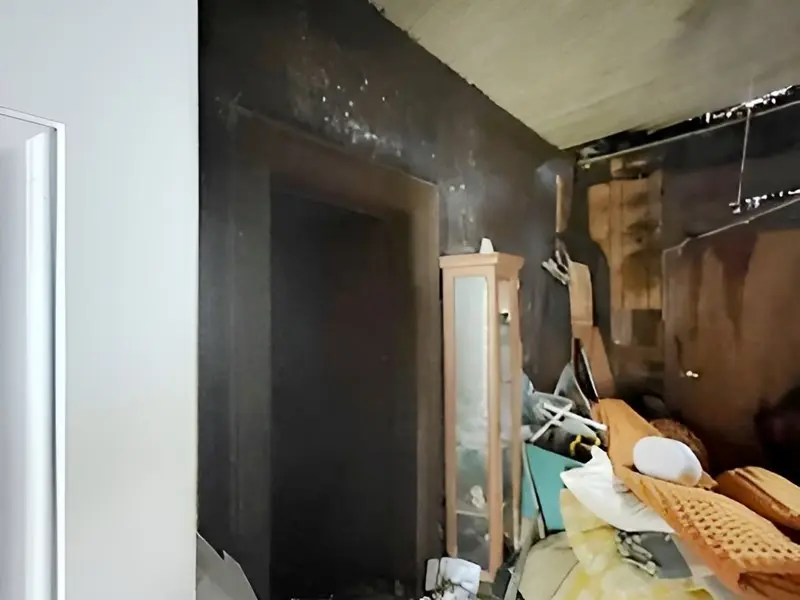
Property is being sold for land value only. No value given to home site.
Key facts
- Built 1940
- Listed 783 days
Neighborhood map
What this means for you Summary
Snapshot
- This is a 2-bed/2.0-bath single-family listed at $10k.
Deal economics
- At list price, monthly cash flow is $751 ($9k/yr) — positive.
- The deal already cash-flows at list — no discount required.
- Meets the 1% rule at list price ($1k rent vs $10k).
- Recommended offer: $9k (12.0% below list) — sets the bar for market timing.
Location & tenants
- Location reads 61/100 on livability (#191 in MS) — a middle-class / working-renter tenant base. Strengths: crime A+, cost of living A+, housing A+; Watch: schools F, amenities F, commute F.
- Okolona Separate School District (rural): math 24% / reading 17% proficiency, ranked #93 of 130 in MS (top 72%) — low school quality limits family demand, transient renter base, plan for 1-2y turnover; 92% free/reduced lunch — lower-income household profile, screen leases tightly.
- Market conditions: 25 active listings in the ZIP; 7 units permitted in Chickasaw County in 2024 (0 in 5+ unit buildings).
Forward outlook
- In year one you build about $32 of equity ($68 loan paydown + $-36 appreciation (-0.4% local appreciation)).
- Chickasaw County population projected to shrink 7% by 2050 — rents likely to lag national; underwrite the cash flow, not the appreciation.
- At projected returns (-0.4% appreciation + 3.0% rent growth), your $3k cash investment doubles in ~1 year — after that, you're playing with house money.
Negotiation context
- It's been on market 784 days — a 12% lower offer ($9k) is reasonable based on typical stale-listing flexibility.
- 4 sale attempts since 2y ago; this cycle's ask is 1709% above the opening price — seller raised mid-cycle; expect resistance to lowballs.
Risks & watch-outs
- Watch-outs: flood insurance adds $125/mo; built in 1940 — expect roof / HVAC / electrical / plumbing capex.
- Climate carrying-cost: in FEMA flood zone A (mandatory federal flood insurance); major wind risk, 27% chance of damaging wind over 30y; extreme-heat days projected 7→20/yr by 2055 (HVAC capex compounding) — expect insurance premiums to compound above CPI over the hold.
Questions for the listing agent
- It's been on market 784 days. Have you received any prior offers? Is the seller open to a 12% concession, seller financing, or rate buy-down credit?
- Built in 1940 — when were the roof, HVAC, electrical panel, plumbing, and water heater last replaced?
- What's the actual annual flood-insurance premium (NFIP or private), and is the property in a SFHA with mandatory coverage?
- Why hasn't it sold? Are there any deal-killer items the seller is aware of (foundation, flood, title, zoning, code violations)?
- Is there a deadline driving the sale (1031 exchange, divorce, estate, relocation)? That informs how much negotiation room exists.
- Schools are F-rated, which usually means shorter tenancies and higher turnover. Who's the typical renter profile here, and what's been the actual vacancy rate?
- The area grade is low — what's the realistic commute time and amenity access for the typical tenant pool here? Any planned neighborhood developments (good or bad) we should know about?
- What's the average days-on-market for RENTAL listings here right now (not sales)? A rising rental-DOM trend means longer vacancies and softer asking-rent achievability than the comps imply.
- What's the recent tenant-quality profile in this submarket — average credit score on applications, eviction rate, late-payment / NSF rate, and stable-employment percentage? A property-management company in the area should have these aggregated.
- How much new for-sale + rental construction is in the pipeline within 1–3 miles? Heavy new supply typically softens prices + rents 12–24 months out; constrained supply supports both.
Investment metrics
- 1% rule
- 12.08% ✓
- Cap rate
- 111.97%
- Cash-on-cash
- 377.41%
- DSCR
- 17.79
- GRM
- 0.7
CMA / ARV
- ARV (median comp)
- $94,954
- List price
- $9,950
- Delta
- -89.52%
- Verdict
- UNDERPRICED
- Comps
- 2 within 1.0 mi
Projected returns pro-forma
-0.36% appreciation · 3.0% rent growth · sell at horizon
- IRR
- —
- Equity multiple
- 18.04×
- Total profit
- $47,470
- Equity at exit
- $2,709
- IRR
- —
- Equity multiple
- 38.49×
- Total profit
- $104,442
- Equity at exit
- $3,116
Cash invested: $2,786 (down + closing). Projections, not guarantees.
Landlord ↔ Tenant lean methodology
- Overall (STATE)
- 90 Strongly Landlord-Friendly
- State Mississippi
- 90 Strongly Landlord-Friendly · R+11
- County
- — inherits STATE
- City
- — inherits STATE
ZIP-level market 38860
- Home prices YoY
- -0.3%
- Active inventory
- 25
- Price-to-rent
- 0.7×
Monthly cashflow live
- Estimated rent
- $1,202 medium interval (Pro) →
- Mortgage (P&I)
- −$52
- Tax from tax record
- −$17 /mo · $201/yr
- Insurance
- −$4
- Flood insurance flood zone
- −$125 /mo · $1,502/yr
- HOA
- −$0
- Vacancy / Maint / Mgmt
- −$252
- Net cashflow
- $751
Break-even live
Sensitivity live
| Price | -10% $757 | -5% $754 | +0% $751 | +5% $748 | +10% $745 |
|---|---|---|---|---|---|
| Rent | -10% $656 | -5% $704 | +0% $751 | +5% $798 | +10% $846 |
| Rate | -1.0pp $756 | -0.5pp $754 | base $751 | +0.5pp $748 | +1.0pp $746 |
UW: 25.0% down · 7.5% · 30yr · 1.5% tax · 5.0% vac · 8.0% maint · 8.0% mgmt
Financing live
Cash to close
- Down payment
- $2,488
- Closing costs
- $298
- Reserves months
- —
- Total cash needed
- —
Loan-product check · same deal, 3 products live
Conventional
25% down · 7.5% · 30yr
- Down + closing
- —
- Monthly P&I
- —
- Monthly cashflow
- —
- DSCR
- —
- Eligible?
- —
Personal DTI + credit; lowest rate.
DSCR
20% down · 8.5% · 30yr
- Down + closing
- —
- Monthly P&I
- —
- Monthly cashflow
- —
- DSCR
- —
- Eligible?
- —
No personal income docs; deal must DSCR.
Hard money
10% down · 12.0% · 12mo
- Down + closing
- —
- Monthly P&I
- —
- Monthly cashflow
- —
- DSCR
- —
- Eligible?
- —
Short-term bridge; refi at stabilization.
Listing history 24 events
-
2026-06-21days on market $9,950 Active 784 DOM
-
2026-06-21days on market $9,950 Active 783 DOM
-
2026-06-18days on market $9,950 Active 781 DOM
-
2026-06-17days on market $9,950 Active 780 DOM
-
2026-06-16days on market $9,950 Active 779 DOM
-
2026-06-15days on market $9,950 Active 778 DOM
-
2026-06-13days on market $9,950 Active 776 DOM
-
2026-06-12days on market $9,950 Active 775 DOM
-
2026-06-09days on market $9,950 Active 772 DOM
-
2026-06-08days on market $9,950 Active 771 DOM
-
2026-06-07days on market $9,950 Active 770 DOM
-
2026-06-05days on market $9,950 Active 768 DOM
-
2026-06-04days on market $9,950 Active 766 DOM
-
2026-06-02days on market $9,950 Active 765 DOM
-
2026-06-01days on market $9,950 Active 764 DOM
-
2026-05-31days on market $9,950 Active 763 DOM
-
2025-11-17soldstatus Closed 72-char remark
Show marketing remark (72 chars)
Property is being sold for land value only. No value given to home site.
-
2025-09-24price $5,950 72-char remark
Show marketing remark (72 chars)
Property is being sold for land value only. No value given to home site.
-
2025-09-23$550 Active 72-char remark
Show marketing remark (72 chars)
Property is being sold for land value only. No value given to home site.
-
2025-06-20price $5,950
-
2025-05-20status Active
-
2025-02-12$6,950 Active
-
2024-07-29price $9,950
-
2024-04-04$14,950 Active
ⓘ Source: listings_history table (triggers on properties + properties_extension) + one-shot
backfill from property_details.listing_events for pre-trigger history.
Tax reassessment forecast MS · Resets to sale price
- Current annual tax
- $201 · $17/mo
- Projected year-2 tax
- $201 · $17/mo
- Expected delta
- $0/yr ($0/mo · 0.0%)
ⓘ Screening estimate from a state-policy table — verify with the county assessor before closing.
Climate risk First Street
- Flood 1/10 Low FEMA zone A · 0% chance over 30 yrs
- Wildfire 2/10 Low
- Heat 6/10 Major 7 d/yr ≥109°F today · 20 d/yr by 30 yrs out
- Wind 6/10 Major 27% chance of damaging wind over 30 yrs
- Air quality 1/10 Low 0 unhealthy d/yr today · 0 by 30 yrs out
Nearby sold comps map
Loading sold comps map…
Walkable amenities ~0.75 mi
Loading nearby amenities…
Taxation est. · year 1
- Rental income
- $14,420
- − Mortgage interest
- −$557
- − Property taxes
- −$201
- − Insurance
- −$1,552
- − Repairs & maintenance
- −$1,154
- − Management
- −$1,154
- − Depreciation
- −$289
- Taxable income
- $9,512
- Est. tax owed @ 24.0%
- −$2,283
- After-tax cash flow
- $6,729/yr
For passive investors: Depreciation is non-cash, so a rental often shows a tax loss while cash-flowing — sheltering income. Rental losses are passive: they offset passive income freely, and up to $25,000/yr can offset ordinary (W-2) income if you actively participate and your MAGI is under $100k (phasing out to $0 by $150k); unused losses carry forward. On sale, claimed depreciation is recaptured at up to 25%, and gains may owe capital-gains tax (a 1031 exchange can defer both). Figures are a year-1 estimate at your 24.0% rate — not tax advice; consult a CPA.
Schools (NCES district)
- District
- Okolona Separate School District
- NCES district ID
- 2803390
- Math proficiency
- 24% ▼ -13.00%
- Reading proficiency
- 17% ▼ -7.00%
- Median HH income
- $29,703
- Composite
- 16.42/100
- National rank
- #9191
- State rank
- #93 of 130 in MS
Livability — Okolona
- Score
- 61/100
- State rank
- #191
- US rank
- #17576
Category grades
Schools grade is shown separately in the Schools card above.
Census & demographics
- Census place
- Okolona, MS
- Population (ZIP)
- 6,313
Population outlook (Chickasaw County) Hauer SSP2
- Today (2025)
- 17,070 people
- By 2030
- 16,849 · -1.3%
- By 2040
- 16,419 · -3.8%
- By 2050
- 15,899 · -6.9%
- By 2075
- 14,445 · -15.4%
- By 2100
- 12,062 · -29.3%
Race, ethnicity, and origin ACS 2023
- Neighborhood character
- Majority Black (55%)
- Race & ethnicity
- Black 55% White 45%
- Common ancestry
- Italian 2%
- Foreign-born
- 0%
Political lean MEDSL · Chickasaw
- 2024 margin
- R (+13.7) · D 42.7% · R 56.4%
- 2008→2024 swing
- -15.8pp toward R · 2008: 2.1pp · 2024: -13.7pp
- All cycles
- 2024: R+13.7 2020: R+4.5 2016: R+6.1 2012: D+4.1 2008: D+2.1
Not yet ingested
- Civics
- —
Market trends
- HPI YoY
- ▼ -0.36%
- Current HPI
- 128.2516
- Rent YoY
- —
- Metro
- —
- State GDP YoY
- —
- F500 in state
- 0
Price history
-60.2% since first listed8 events — show timeline
- 2025-11-17 Sold (MLS) — NEMSBD
- 2025-09-24 Price Changed $5,950 NEMSBD
- 2025-09-23 Listed $550 NEMSBD
- 2025-06-20 Price Changed $5,950 NEMSBD
- 2025-05-20 Relisted — NEMSBD
- 2025-02-12 Listed $6,950 NEMSBD
- 2024-07-29 Price Changed $9,950 GBOR
- 2024-04-04 Listed $14,950 GBOR
Property tax history
-1.6%/yrLatest (2024): $201 · +0.2% YoY. Source: county tax records.
Cash-flow waterfall
monthlySold comps — $/sqft
last 12 mo · ≤1 miLoading sold comps…