5125 El Capitan · Cibolo, TX
Flood risk 1/10 · Minimal
- FEMA flood zone
- X (unshaded)
- Chance of flooding over 30 yrs
- 0.0%
- Est. flood insurance / yr
- $507 – $1,088
Fire risk 5/10 · Moderate
- Est. fire insurance / yr
- $1,222 – $2,270
Heat risk 8/10 · Major
- Hot days now (above 109°F)
- 6 days/yr
- Hot days in 30 yrs
- 17 days/yr
Wind risk 8/10 · Major
- Chance of severe wind over 30 yrs
- 80.0%
Air-quality risk 1/10 · Minimal
- Unhealthy air days now
- 0 days/yr
- Unhealthy air days in 30 yrs
- 0 days/yr
Risk factors via First Street. Map © Google.
Why this score? — see what drove the D grade
The composite is a weighted blend of 9 inputs, each scored 0–100. Each bar is that input's sub-score; the figure is the points it added to the 100-point composite (weight × sub-score).
- ARV discount +11.5/15.0
- Cash flow +8.2/30.0
- Appreciation +5.2/10.0
- Schools +4.4/10.0
- Livability +3.6/5.0
- Rent growth +3.1/5.0
- 1% rule +3.0/10.0
- Condition / age +2.5/5.0
- DSCR +2.2/10.0
$268,999
🖨 Deal sheet (PDF) 📄 Offer letter ✓ Due diligence
Listing remarks
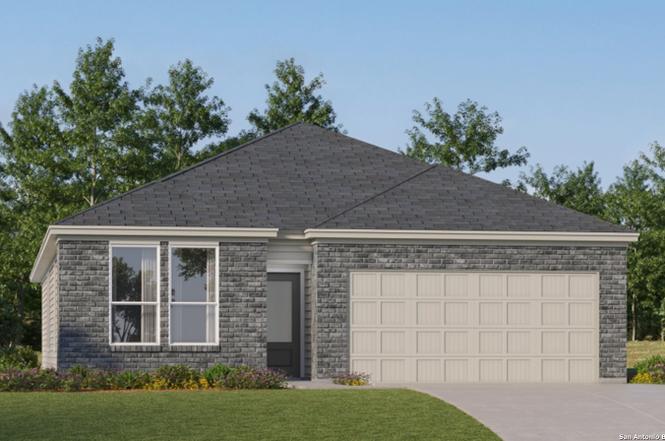
The Siesta- This new home features a modern and low-maintenance design contained to a single level. Off the foyer are two secondary bedrooms and a convenient study, providing a secluded place to focus on important tasks throughout the week. The kitchen, dining room and family room share an open-concept floorplan, with a nearby covered patio ready for outdoor entertainment and leisure. The owner's suite is nestled into a private corner at the back of the home. Estimated Completion June 2026. The completion date, prices and features may vary and are subject to change. Please verify with Lennar directly. Photos are for illustrative purposes only.
Key facts
- Modern design
- Private corner
- Covered patio
Tags
Property features AI
Finance
- Financial info: Down payment resources available
- HOA & community: Mandatory HOA; HOA fee $275 quarterly; Association transfer fee $450
Exterior
- Parking: 2-car garage
- Utilities: Water: GVSUD (water system); Sewer: GVSUD (sewer system); Gas service: Centerpoint; Electricity: GVEC; Garbage service: Frontier; HERS rated (HERS 0-85)
- Home design: New construction by Lennar; Cement fiber exterior; Slab foundation; Composition roof; Subdivision: Grace Valley
- Construction: Built by Lennar; New home; Cement fiber exterior; Slab foundation; Composition roof
- Exterior features: Privacy fence; Community pool and park/playground
Interior
- Kitchen: Island kitchen; Dishwasher; Stove/Range; Walk-in pantry
- Bedrooms: Master bedroom on lower level with walk-in closet and full bath; Second bedroom; Third bedroom; Master bedroom approx. 16 x 14; Bedrooms 2 and 3 approx. 11 x 12
- Flooring: Carpeting; Vinyl flooring
- Bathrooms: Two full bathrooms; Master bath with shower only (approx. 8 x 8)
- Heating & cooling: Central heating; Electric and natural gas heat; Central air conditioning
- Interior features: Open floor plan with island kitchen and breakfast bar; Walk-in pantry; Study/Library; Utility room inside; Cable TV available; Laundry on main level; Walk-in closets; 1 living area
- Laundry & utility: Washer connection; Dryer connection; Laundry on main level; Utility room inside
Neighborhood map
What this means for you Summary
Snapshot
- This is a 3-bed/2.0-bath single-family listed at $269k.
Deal economics
- At list price, monthly cash flow is $-252 ($-3k/yr) — negative.
- To cash-flow at today's rent, offer at most $233k (13.5% below list).
- To meet the 1% rule (rent ≥ 1% of price), the offer needs to be $215k (20.0% below list).
- Recommended offer: $215k (20.0% below list) — sets the bar for 1% rule.
- Cap rate 5.2% vs local median 3.3% in Cibolo — top-decile yield for the area; either an underpriced asset or a hidden risk that comps aren't pricing in. Stress-test before assuming the spread holds.
Location & tenants
- Location reads 72/100 on livability (#261 in TX) — a middle-class / working-renter tenant base. Strengths: employment A+, housing A+, crime A; Watch: amenities F, commute F, health & safety F.
- Schertz-Cibolo-U City ISD (suburban): math 49% / reading 48% proficiency, ranked #152 of 826 in TX (top 18%) — families likely to look elsewhere, expect single-tenant / working-renter base with shorter leases.
- Zoned schools: Cibolo Valley El (math 36% / reading 46%, grade F, #1,462 of 4,322 statewide, top 34%, 761 students, 33% FRL); Dobie J H (math 51% / reading 53%, grade C+, #301 of 1,662 statewide, top 19%, 1,347 students, 31% FRL); Byron P Steele Ii H S (math 68% / reading 66%, grade B, #163 of 1,632 statewide, top 11%, 2,716 students, 25% FRL) — zoned schools at 30% FRL track the district average.
- Market conditions: Rents rising (+2.4%/yr); 761 active listings in the ZIP; 35 comparable units currently listed for rent nearby; rentals at typical pace (median 20d on market — plan ~3-4 weeks tenant-placement turnaround); high-income renter base; 2,064 units permitted in Guadalupe County in 2024 (133 in 5+ unit buildings).
Forward outlook
- In year one you build about $3k of equity ($2k loan paydown + $1k appreciation (0.5% local appreciation)).
- Guadalupe County population projected at +61% by 2050 — long-run rental-demand tailwind backs the buy-and-hold thesis.
- By year 9, paydown + projected appreciation supports a ~$32k cash-out refi (75% LTV) — recoverable capital for the next deal without selling this one.
Negotiation context
- It's been on market 51 days — a 3% lower offer ($261k) is reasonable based on typical stale-listing flexibility.
Risks & watch-outs
- Climate carrying-cost: severe wind risk, 80% chance of damaging wind over 30y; moderate wildfire risk; extreme-heat days projected 6→17/yr by 2055 (HVAC capex compounding) — expect insurance premiums to compound above CPI over the hold.
Questions for the listing agent
- What do current leases actually rent for vs. the listed asking? Can we see a recent rent roll and the last 12 months of T-12 income?
- It's been on market 51 days. Have you received any prior offers? Is the seller open to a 20% concession, seller financing, or rate buy-down credit?
- What does the HOA fee cover, when was the last increase, and are there any pending special assessments or reserve-fund shortfalls?
- Is there a deadline driving the sale (1031 exchange, divorce, estate, relocation)? That informs how much negotiation room exists.
- Schools are B-rated — typically a magnet for longer-tenancy family renters. What's the average tenant stay here, and is there a school-zone premium baked into asking?
- The area grade is low — what's the realistic commute time and amenity access for the typical tenant pool here? Any planned neighborhood developments (good or bad) we should know about?
- What's the average days-on-market for RENTAL listings here right now (not sales)? A rising rental-DOM trend means longer vacancies and softer asking-rent achievability than the comps imply.
- What's the recent tenant-quality profile in this submarket — average credit score on applications, eviction rate, late-payment / NSF rate, and stable-employment percentage? A property-management company in the area should have these aggregated.
- How much new for-sale + rental construction is in the pipeline within 1–3 miles? Heavy new supply typically softens prices + rents 12–24 months out; constrained supply supports both.
Investment metrics
- 1% rule
- 0.80% ✗
- Cap rate
- 5.17%
- Cash-on-cash
- -4.01%
- DSCR
- 0.82
- GRM
- 10.4
CMA / ARV
- ARV (on-the-fly)
- $295,205
- Comps found
- 12
Show comp detail 12 sales within ~0.75 mi
| Address | Dist | Beds/Ba | Sqft | Sold | Price | $/sf | Match |
|---|---|---|---|---|---|---|---|
| 5125 El Capitan | 0.00mi | 3/2.0 | 1,955 (0%) | 1mo | $268,999 | $138 | 99 |
| 5023 Palo Duro | 0.00mi | 3/2.0 | 1,955 (0%) | 2mo | $267,999 | $137 | 98 |
| 2251 Fort Davis Pass | 0.00mi | 3/2.0 | 1,955 (0%) | 4mo | $293,999 | $150 | 97 |
| 639 Sumpter Banks | 0.00mi | 4/2.0 (+1) | 1,901 (-3%) | 3mo | $344,000 | $181 | 88 |
| 623 Sumpter Banks | 0.00mi | 4/2.0 (+1) | 1,901 (-3%) | 3mo | $370,115 | $195 | 88 |
| 647 Fluted Shls | 0.00mi | 4/2.0 (+1) | 1,901 (-3%) | 4mo | $344,000 | $181 | 88 |
| 5121 El Capitan | 0.00mi | 4/3.0 (+1) | 2,024 (+4%) | 0mo | $282,499 | $140 | 85 |
| 5027 Palo Duro | 0.00mi | 4/3.0 (+1) | 2,024 (+4%) | 2mo | $277,999 | $137 | 84 |
| 2255 Fort Davis Pass | 0.00mi | 4/3.0 (+1) | 2,024 (+4%) | 4mo | $305,999 | $151 | 82 |
| 647 Sumpter Banks | 0.00mi | 3/2.5 | 2,241 (+15%) | 3mo | $354,000 | $158 | 71 |
| 325 Singing Vly | 0.00mi | 3/2.5 | 2,241 (+15%) | 3mo | $402,000 | $179 | 71 |
| 193 Corral Fence | 0.69mi | 4/2.0 (+1) | 1,848 (-6%) | 3mo | $229,900 | $124 | 52 |
Match score weights: distance 35% · size 25% · config 20% · recency 20%. Top-matched comps best support the ARV.
Projected returns pro-forma
0.47% appreciation · 2.42% rent growth · sell at horizon
- IRR
- -5.2%
- Equity multiple
- 0.75×
- Total profit
- $-19,053
- Equity at exit
- $84,496
- IRR
- 0.0%
- Equity multiple
- 1.00×
- Total profit
- $281
- Equity at exit
- $106,816
Cash invested: $75,320 (down + closing). Projections, not guarantees.
Landlord ↔ Tenant lean methodology
- Overall (STATE)
- 87 Strongly Landlord-Friendly
- State Texas
- 87 Strongly Landlord-Friendly · R+5
- County
- — inherits STATE
- City
- — inherits STATE
ZIP-level market 78108
- Home prices YoY
- 0.3%
- Rents YoY
- 2.4%
- Active inventory
- 761
- Price-to-rent
- 10.4×
Monthly cashflow live
- Estimated rent
- $2,151 high interval (Pro) →
- Mortgage (P&I)
- −$1,411
- Tax est. 1.5%
- −$336 /mo · $4,035/yr
- Insurance
- −$112
- HOA
- −$92
- Vacancy / Maint / Mgmt
- −$452
- Net cashflow
- $-252
Break-even live
Sensitivity live
| Price | -10% $-66 | -5% $-159 | +0% $-252 | +5% $-345 | +10% $-438 |
|---|---|---|---|---|---|
| Rent | -10% $-422 | -5% $-337 | +0% $-252 | +5% $-167 | +10% $-82 |
| Rate | -1.0pp $-116 | -0.5pp $-183 | base $-252 | +0.5pp $-321 | +1.0pp $-392 |
UW: 25.0% down · 7.5% · 30yr · 1.5% tax · 5.0% vac · 8.0% maint · 8.0% mgmt
Financing live
Cash to close
- Down payment
- $67,250
- Closing costs
- $8,070
- Reserves months
- —
- Total cash needed
- —
Loan-product check · same deal, 3 products live
Conventional
25% down · 7.5% · 30yr
- Down + closing
- —
- Monthly P&I
- —
- Monthly cashflow
- —
- DSCR
- —
- Eligible?
- —
Personal DTI + credit; lowest rate.
DSCR
20% down · 8.5% · 30yr
- Down + closing
- —
- Monthly P&I
- —
- Monthly cashflow
- —
- DSCR
- —
- Eligible?
- —
No personal income docs; deal must DSCR.
Hard money
10% down · 12.0% · 12mo
- Down + closing
- —
- Monthly P&I
- —
- Monthly cashflow
- —
- DSCR
- —
- Eligible?
- —
Short-term bridge; refi at stabilization.
Rent comps 35 comps
| Address | Beds | Baths | Sqft | Rent | $/sqft | DOM | Units | Dist |
|---|---|---|---|---|---|---|---|---|
| 2114 Monument HL Cibolo, TX | 4.0 | 3.0 | 2378 | $2,400 | $1.01 | 18d | 1 | 0.02mi |
| 568 Lilac Shls Cibolo, TX | 4.0 | 2.0 | 1847 | $2,200 | $1.19 | 19d | 1 | 0.26mi |
| 528 Whispering Wl Cibolo, TX | 3.0–5.0 | 2.0–3.5 | 2059 | $2,581 | $1.25 | 0d | 2 | 0.38mi |
| 204 Steele Way Cibolo, TX | 4.0 | 2.0 | 1901 | $2,175 | $1.14 | 0d | 1 | 0.40mi |
| 325 Longhorn Way Cibolo, TX | 3.0 | 2.0 | 1650 | $1,800 | $1.09 | 4d | 1 | 0.60mi |
| 315 Cibolo Cmns Cibolo, TX | 1.0–3.0 | 1.0–2.0 | 1052 | $2,086 | $1.98 | 0d | 22 | 0.62mi |
| 116 Lone Star Way Cibolo, TX | 3.0 | 2.0 | 1350 | $1,700 | $1.26 | 0d | 1 | 0.63mi |
| 417 Cattle Run Cibolo, TX | 4.0 | 2.5 | 2382 | $2,095 | $0.88 | 14d | 1 | 0.68mi |
| 417 Cattle Run Cibolo, TX | 4.0 | 2.5 | 2382 | $2,095 | $0.88 | 3d | 1 | 0.68mi |
| 137 Niemietz Cv Cibolo, TX | 4.0 | 2.5 | 2419 | $2,200 | $0.91 | 25d | 1 | 0.68mi |
| 124 Anvil Pl Cibolo, TX | 3.0 | 2.0 | 1398 | $1,700 | $1.22 | 25d | 1 | 0.69mi |
| 132 Niemietz Cv Cibolo, TX | 3.0 | 2.0 | 1596 | $1,900 | $1.19 | 25d | 1 | 0.70mi |
| 213 Lieck Cv Cibolo, TX | 4.0 | 2.5 | 2525 | $2,495 | $0.99 | 0d | 1 | 0.76mi |
| 233 Rattlesnake Way Cibolo, TX | 4.0 | 2.5 | 1816 | $1,855 | $1.02 | 25d | 1 | 0.81mi |
| 429 Prickly Pear Dr Cibolo, TX | 4.0 | 2.5 | 1971 | $2,100 | $1.07 | 4d | 1 | 0.85mi |
| 229 Hereford St Cibolo, TX | 3.0 | 2.0 | 1398 | $1,750 | $1.25 | 25d | 1 | 0.86mi |
| 101 Santa Clara St Cibolo, TX | 3.0 | 2.0 | 1740 | $1,750 | $1.01 | 14d | 1 | 0.87mi |
| 517 Saddle Back Trl Cibolo, TX | 4.0 | 3.5 | 2597 | $2,400 | $0.92 | 0d | 1 | 0.90mi |
| 237 Hinsdale Run Cibolo, TX | 3.0 | 2.5 | 2022 | $2,200 | $1.09 | 23d | 1 | 1.03mi |
| 513 Chelson Hunt Cibolo, TX | 4.0 | 2.5 | 2453 | $2,800 | $1.14 | 25d | 1 | 1.04mi |
| 321 Caleb Ct Cibolo, TX | 3.0 | 2.0 | 1397 | $1,695 | $1.21 | 25d | 1 | 1.08mi |
| 318 Caleb Ct Schertz, TX | 3.0 | 2.0 | 1397 | $1,695 | $1.21 | 3d | 1 | 1.10mi |
| 320 Caleb Ct Unit 318 Schertz, TX | 3.0 | 2.0 | 1397 | $1,695 | $1.21 | 25d | 1 | 1.11mi |
| 201 Canyon Vis Cibolo, TX | 4.0 | 2.5 | 2396 | $2,000 | $0.83 | 45d | 1 | 1.12mi |
| 332 Caleb Ct Schertz, TX | 3.0 | 2.5 | 1609 | $1,695 | $1.05 | 25d | 1 | 1.12mi |
| 332 Caleb Ct Schertz, TX | 3.0 | 2.5 | 1609 | $1,695 | $1.05 | 22d | 1 | 1.12mi |
| 330/332 Caleb Ct Schertz, TX | 3.0 | 2.5 | 1609 | $1,695 | $1.05 | 6d | 1 | 1.13mi |
| 804 Red Riv Cibolo, TX | 3.0 | 2.0 | 1650 | $1,950 | $1.18 | 19d | 1 | 1.23mi |
| 224 Broad Oak Dr Cibolo, TX | 3.0 | 1.0–2.0 | 966 | $1,912 | $1.98 | 0d | 33 | 1.24mi |
| 201 Gatewood Fls Cibolo, TX | 4.0 | 2.5 | 2245 | $1,949 | $0.87 | 25d | 1 | 1.36mi |
| 305 Colbert Fry Cibolo, TX | 4.0 | 2.0 | 1901 | $2,350 | $1.24 | 25d | 1 | 1.38mi |
| 117 Grand Rpds Cibolo, TX | 4.0 | 2.0 | 1888 | $2,050 | $1.09 | 6d | 1 | 1.38mi |
| 325 Colbert Fry Cibolo, TX | 3.0 | 2.0 | 1442 | $2,050 | $1.42 | 25d | 1 | 1.43mi |
| 244 Heavenly Vw Cibolo, TX | 3.0 | 2.0 | 1877 | $1,895 | $1.01 | 0d | 1 | 1.45mi |
| 121 Little Wichita Cibolo, TX | 4.0 | 2.0 | 1888 | $1,895 | $1.00 | 25d | 1 | 1.48mi |
HOA detail
- Monthly dues
- $92 · $1,104/yr
Listing history 9 events
-
2026-04-30status Pending
-
2026-04-21price $268,999
-
2026-04-18price $270,999
-
2026-04-14price $271,999
-
2026-04-09price $272,999
-
2026-04-03price $273,999
-
2026-03-31price $289,999
-
2026-03-20price $294,999
-
2026-03-10$293,999 New
ⓘ Source: listings_history table (triggers on properties + properties_extension) + one-shot
backfill from property_details.listing_events for pre-trigger history.
Climate risk First Street
- Flood 1/10 Low FEMA zone X (unshaded) · 0% chance over 30 yrs
- Wildfire 5/10 Major
- Heat 8/10 Severe 6 d/yr ≥109°F today · 17 d/yr by 30 yrs out
- Wind 8/10 Severe 80% chance of damaging wind over 30 yrs
- Air quality 1/10 Low 0 unhealthy d/yr today · 0 by 30 yrs out
Nearby sold comps map
Loading sold comps map…
Walkable amenities ~0.75 mi
Loading nearby amenities…
Taxation est. · year 1
- Rental income
- $25,813
- − Mortgage interest
- −$15,068
- − Property taxes
- −$4,035
- − Insurance
- −$1,345
- − Repairs & maintenance
- −$2,065
- − Management
- −$2,065
- − HOA
- −$1,104
- − Depreciation
- −$7,825
- Taxable loss
- −$7,695
- Est. tax savings @ 24.0%
- +$1,847
- After-tax cash flow
- $-1,173/yr
For passive investors: Depreciation is non-cash, so a rental often shows a tax loss while cash-flowing — sheltering income. Rental losses are passive: they offset passive income freely, and up to $25,000/yr can offset ordinary (W-2) income if you actively participate and your MAGI is under $100k (phasing out to $0 by $150k); unused losses carry forward. On sale, claimed depreciation is recaptured at up to 25%, and gains may owe capital-gains tax (a 1031 exchange can defer both). Figures are a year-1 estimate at your 24.0% rate — not tax advice; consult a CPA.
Schools (NCES district)
- District
- Schertz-Cibolo-U City ISD
- NCES district ID
- 4839480
- Math proficiency
- 49% ▼ -12.00%
- Reading proficiency
- 48% ▼ -4.00%
- Median HH income
- $75,790
- Composite
- 44.02/100
- National rank
- #2886
- State rank
- #152 of 826 in TX
Livability — Cibolo
- Score
- 72/100
- State rank
- #261
- US rank
- #6177
Category grades
Schools grade is shown separately in the Schools card above.
Census & demographics
- Census place
- Cibolo, TX
- County
- Guadalupe County · 147,291 people
- City population
- 49,784
- Metro
- San Antonio-New Braunfels, TX
- Population (ZIP)
- 49,784
- Household income
- $113,004
- Rent vs Own
- Severe rent burden
- 521.0
Population outlook (Guadalupe County) Hauer SSP2
- Today (2025)
- 196,854 people
- By 2030
- 220,210 · +11.9%
- By 2040
- 268,004 · +36.1%
- By 2050
- 316,333 · +60.7%
- By 2075
- 434,747 · +120.8%
- By 2100
- 520,447 · +164.4%
Race, ethnicity, and origin ACS 2023
- Neighborhood character
- Diverse neighborhood (Simpson 0.68)
- Race & ethnicity
- White 46% Hispanic / Latino 30% Two or more races 22% Black 13% Asian 3%
- Hispanic origin (detail)
- Mexican 22% Puerto Rican 4%
- Common ancestry
- Italian 2% Lithuanian 2% Slovak 2%
- Foreign-born
- 7% · Canada, Vietnam, China
- Languages at home
- 83% English-only · Spanish 13% Vietnamese 1% German/W. Germanic 1%
Political lean MEDSL · Guadalupe
- 2024 margin
- Strong R (+29.5) · D 34.8% · R 64.3%
- 2008→2024 swing
- +1.5pp toward D · 2008: -31.0pp · 2024: -29.5pp
- All cycles
- 2024: R+29.5 2020: R+24.2 2016: R+31.8 2012: R+35.1 2008: R+31.0
Not yet ingested
- Civics
- —
Market trends
- HPI YoY
- ▲ 0.47%
- Current HPI
- 182.7296
- Rent YoY
- ▲ 2.42%
- Metro
- San Antonio-New Braunfels, TX
- State GDP YoY
- ▲ 3.95%
- F500 in state
- 110
Industry mix (Fortune 500 HQ in TX)
| Industry | F500 HQs | Revenue |
|---|---|---|
| Energy | 16 | $1,198B |
|
||
| Technology | 5 | $198B |
|
||
| Engineering / Construction | 4 | $72B |
|
||
| Energy Services | 3 | $60B |
|
||
| Utilities | 3 | $41B |
|
||
| Healthcare | 2 | $330B |
|
||
Price history
-8.5% since first listed9 events — show timeline
- 2026-04-30 Pending — LERA
- 2026-04-21 Price Changed $268,999 LERA
- 2026-04-18 Price Changed $270,999 LERA
- 2026-04-14 Price Changed $271,999 LERA
- 2026-04-09 Price Changed $272,999 LERA
- 2026-04-03 Price Changed $273,999 LERA
- 2026-03-31 Price Changed $289,999 LERA
- 2026-03-20 Price Changed $294,999 LERA
- 2026-03-10 Listed $293,999 LERA
Cash-flow waterfall
monthlySold comps — $/sqft
last 12 mo · ≤1 miLoading sold comps…