 Duplex
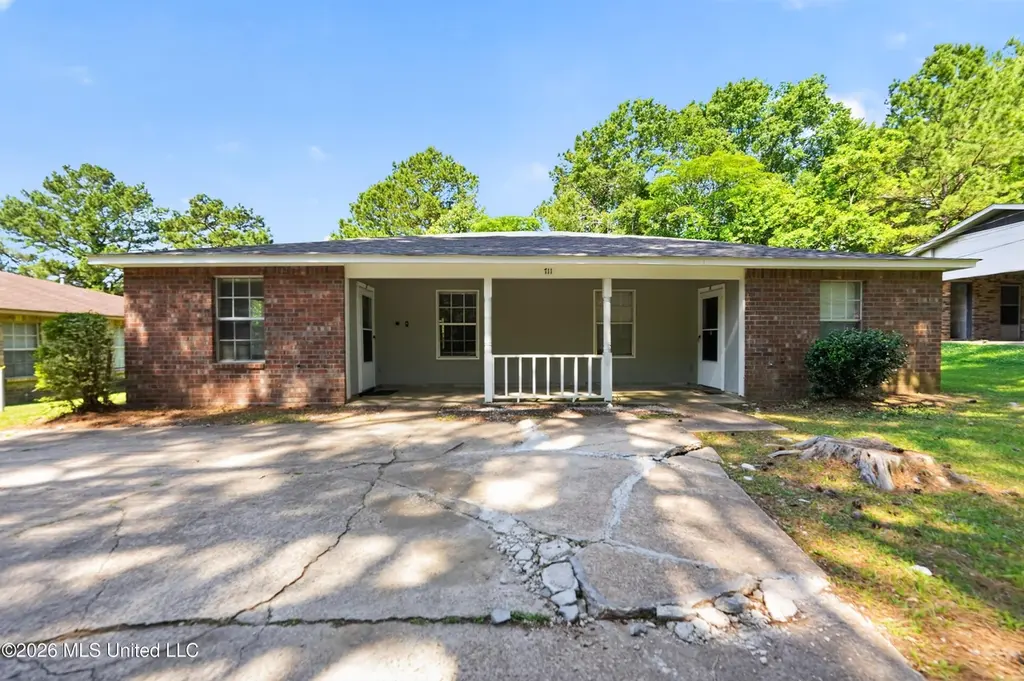
711 George Kersh Dr · Pearl, MS
Flood risk 1/10 · Minimal
- FEMA flood zone
- X (unshaded)
- Chance of flooding over 30 yrs
- 0.0%
- Est. flood insurance / yr
- $507 – $1,088
Fire risk 3/10 · Minor
- Est. fire insurance / yr
- $1,241 – $2,305
Heat risk 7/10 · Major
- Hot days now (above 108°F)
- 7 days/yr
- Hot days in 30 yrs
- 20 days/yr
Wind risk 7/10 · Major
- Chance of severe wind over 30 yrs
- 78.0%
Air-quality risk 2/10 · Minimal
- Unhealthy air days now
- 0 days/yr
- Unhealthy air days in 30 yrs
- 1 days/yr
Risk factors via First Street. Map © Google.
Why this score? — see what drove the B grade
The composite is a weighted blend of 9 inputs, each scored 0–100. Each bar is that input's sub-score; the figure is the points it added to the 100-point composite (weight × sub-score).
- Cash flow +30.0/30.0
- DSCR +10.0/10.0
- 1% rule +9.2/10.0
- ARV discount +7.5/15.0
- Rent growth +4.1/5.0
- Livability +3.7/5.0
- Schools +3.6/10.0
- Condition / age +2.5/5.0
- Appreciation +0.0/10.0
$224,900
🖨 Deal sheet 📄 Offer letter ✓ Due diligence
Multi-family units
County records classify this as Multi-Family (2-4 Unit). Listing-text estimate: 2 units. confirmed
Listing remarks
Excellent investment opportunity in Pearl! This well-maintained 1989 duplex at 711 George Kersh Dr features two 3BR/1BA units, each offering 947 sq ft of efficient living space on a solid concrete slab. The exterior boasts durable brick veneer and a 160-ft deep rectangular lot with a level backyard. Interior highlights include carpet and vinyl flooring, central electric HVAC, and smart home technology (smart locks/thermostats). Residents enjoy off-street parking on a large concrete pad and easy access to local schools.
Key facts
- Off street parking
- Level backyard
- Durable brick veneer
Tags
Property features AI
Finance
- HOA & community: Community features include curbs, sidewalks, nearby park, and near entertainment
Exterior
- Parking: Space for 4 vehicles; Concrete driveway; On-site parking; Shared driveway; Direct access; Paved; no garage
- Utilities: Public water; Public sewer; Cable connected; Electricity connected; Natural gas connected; Phone connected; Water connected; Sewer connected
- Home design: House; One level
- Construction: Vinyl, brick veneer, and wood siding exterior; Slab foundation; Asphalt shingle roof; Built (year per public records)
- Exterior features: Front porch; Patio; Slab patio/porch; Chain link fencing; Lighting; Private entrance; Private yard; Rain gutters
Interior
- Kitchen: Dishwasher; Disposal; Refrigerator
- Bedrooms: Primary bedroom (Main) — 11 x 13; Bedroom (Main) — 10 x 11; Bedroom (Main) — 10 x 10
- Flooring: Carpet; Concrete; Vinyl
- Bathrooms: 2 full bathrooms
- Heating & cooling: Forced air heating; Central air conditioning
- Interior features: Lighting; Private entrance; Private yard; Rain gutters; Exhaust fan
- Laundry & utility: Electric water heater
Neighborhood map
What this means for you Summary
Snapshot
- This is a 2 × 3.0-bed/1.0-bath units multifamily listed at $225k.
Deal economics
- At list price, monthly cash flow is $1k ($13k/yr) — positive. Per door: $556/mo.
- The deal already cash-flows at list — no discount required.
- Meets the 1% rule at list price ($3k rent vs $225k).
- Recommended offer: $222k (1.5% below list) — sets the bar for market timing.
- Cap rate 12.2% vs local median 5.5% in Pearl — top-decile yield for the area; either an underpriced asset or a hidden risk that comps aren't pricing in. Stress-test before assuming the spread holds.
Location & tenants
- Location reads 73/100 on livability (#19 in MS) — a middle-class / working-renter tenant base. Strengths: cost of living A+, housing A+, health & safety A+; Watch: amenities F, commute F, employment D-.
- Pearl Public School District (suburban): math 44% / reading 42% proficiency, ranked #32 of 130 in MS (top 25%) — families likely to look elsewhere, expect single-tenant / working-renter base with shorter leases.
- Zoned schools: Pearl Lower Elementary School (782 students, 100% FRL); Pearl Junior High School (math 46% / reading 40%, grade D-, #47 of 179 statewide, top 26%, 1,001 students, 100% FRL); Pearl High School (math 46% / reading 49%, grade D, #28 of 197 statewide, top 14%, 1,262 students, 100% FRL) — zoned schools average 100% FRL vs 57% district-wide (42 pts higher); higher-poverty schools than district average — tighter screening recommended.
- Market conditions: Rents rising fast (+6.3%/yr); 265 active listings in the ZIP; 343 units permitted in Rankin County in 2024 (0 in 5+ unit buildings).
- At $3,189/mo this rent would consume 58% of the median local household income ($65k/yr) (locally 1235% of renters already pay >50% of income on rent) — very limited rent-growth headroom before tenants either downsize or default.
Forward outlook
- Local home prices are declining (-3.0%/yr); year-one equity from $2k of loan paydown is wiped out by about $7k of value loss. Plan a longer hold.
- Rankin County population projected at +17% by 2050 — long-run rental-demand tailwind backs the buy-and-hold thesis.
- At projected returns (-3.0% appreciation + 6.3% rent growth), your $63k cash investment doubles in ~5 years — after that, you're playing with house money.
Negotiation context
- It's been on market 29 days — a 2% lower offer ($222k) is reasonable based on typical stale-listing flexibility.
Risks & watch-outs
- Climate carrying-cost: major wind risk, 78% chance of damaging wind over 30y; extreme-heat days projected 7→20/yr by 2055 (HVAC capex compounding) — expect insurance premiums to compound above CPI over the hold.
Questions for the listing agent
- Can we see the unit-by-unit rent roll, current vacancy, and any below-market leases? What's the average tenancy length?
- What capital expenditures (roof, boiler, parking lot, exteriors) have been made in the last 5 years, and what's planned in the next 2?
- Is there a deadline driving the sale (1031 exchange, divorce, estate, relocation)? That informs how much negotiation room exists.
- Schools are D-rated, which usually means shorter tenancies and higher turnover. Who's the typical renter profile here, and what's been the actual vacancy rate?
- What's the average days-on-market for RENTAL listings here right now (not sales)? A rising rental-DOM trend means longer vacancies and softer asking-rent achievability than the comps imply.
- What's the recent tenant-quality profile in this submarket — average credit score on applications, eviction rate, late-payment / NSF rate, and stable-employment percentage? A property-management company in the area should have these aggregated.
- How much new apartment / multifamily construction is in the pipeline within 1–3 miles? Heavy new supply (>2% of stock underway) typically softens rents 12–24 months out; light construction supports rent growth.
Investment metrics
- 1% rule
- 1.42% ✓
- Cap rate
- 12.23%
- Cash-on-cash
- 21.19%
- DSCR
- 1.94
- GRM
- 5.9
CMA / ARV
No comps found within radius.
Projected returns pro-forma
-3.0% appreciation · 6.34% rent growth · sell at horizon
- IRR
- 17.2%
- Equity multiple
- 1.72×
- Total profit
- $45,429
- Equity at exit
- $33,533
- IRR
- 27.9%
- Equity multiple
- 3.85×
- Total profit
- $179,285
- Equity at exit
- $19,445
Cash invested: $62,972 (down + closing). Projections, not guarantees.
Landlord ↔ Tenant lean methodology
- Overall (STATE)
- 90 Strongly Landlord-Friendly
- State Mississippi
- 90 Strongly Landlord-Friendly · R+11
- County
- — inherits STATE
- City
- — inherits STATE
ZIP-level market 39208
- Home prices YoY
- -20.3%
- Rents YoY
- 6.3%
- Active inventory
- 265
- Price-to-rent
- 11.8×
Monthly cashflow live
- Estimated rent
- $3,189 medium interval (Pro) →
- Mortgage (P&I)
- −$1,179
- Tax from tax record
- −$134 /mo · $1,608/yr
- Insurance
- −$94
- HOA
- −$0
- Vacancy / Maint / Mgmt
- −$670
- Net cashflow
- $1,112
Break-even live
2-unit breakdown (identical units grouped — click to expand)
| Units | Beds | Baths | Est. rent |
|---|---|---|---|
| 2× units | 3.0 | 1 | $3,188 |
| #1 | 3.0 | 1 | $1,594 |
| #2 | 3.0 | 1 | $1,594 |
| Total (2 units) | $3,189 | ||
UW: 25.0% down · 7.5% · 30yr · 1.5% tax · 5.0% vac · 8.0% maint · 8.0% mgmt
Financing live
Cash to close
- Down payment
- $56,225
- Closing costs
- $6,747
- Reserves months
- —
- Total cash needed
- —
Loan-product check · same deal, 3 products live
Conventional
25% down · 7.5% · 30yr
- Down + closing
- —
- Monthly P&I
- —
- Monthly cashflow
- —
- DSCR
- —
- Eligible?
- —
Personal DTI + credit; lowest rate.
DSCR
20% down · 8.5% · 30yr
- Down + closing
- —
- Monthly P&I
- —
- Monthly cashflow
- —
- DSCR
- —
- Eligible?
- —
No personal income docs; deal must DSCR.
Hard money
10% down · 12.0% · 12mo
- Down + closing
- —
- Monthly P&I
- —
- Monthly cashflow
- —
- DSCR
- —
- Eligible?
- —
Short-term bridge; refi at stabilization.
Listing history 17 events
-
2026-06-18days on market $224,900 Active 29 DOM
-
2026-06-17days on market $224,900 Active 28 DOM
-
2026-06-16days on market $224,900 Active 27 DOM
-
2026-06-15days on market $224,900 Active 26 DOM
-
2026-06-14days on market $224,900 Active 24 DOM
-
2026-06-10days on market $224,900 Active 21 DOM
-
2026-06-09days on market $224,900 Active 20 DOM
-
2026-06-08days on market $224,900 Active 19 DOM
-
2026-06-07days on market $224,900 Active 18 DOM
-
2026-06-03days on market $224,900 Active 14 DOM
-
2026-06-02days on market $224,900 Active 13 DOM
-
2026-06-01days on market $224,900 Active 12 DOM
-
2026-05-31days on market $224,900 Active 11 DOM
-
2026-05-30days on market $224,900 Active 10 DOM
-
2026-05-20$224,900 Active
-
2021-10-22soldstatus
-
2021-09-10soldstatus
ⓘ Source: listings_history table (triggers on properties + properties_extension) + one-shot
backfill from property_details.listing_events for pre-trigger history.
Tax reassessment forecast MS · Resets to sale price
- Current annual tax
- $1,608 · $134/mo
- Projected year-2 tax
- $1,777 · $148/mo
- Expected delta
- +$169/yr (+$14/mo · 10.5%)
ⓘ Screening estimate from a state-policy table — verify with the county assessor before closing.
Climate risk First Street
- Flood 1/10 Low FEMA zone X (unshaded) · 0% chance over 30 yrs
- Wildfire 3/10 Moderate
- Heat 7/10 Severe 7 d/yr ≥108°F today · 20 d/yr by 30 yrs out
- Wind 7/10 Severe 78% chance of damaging wind over 30 yrs
- Air quality 2/10 Low 0 unhealthy d/yr today · 1 by 30 yrs out
Nearby sold comps map
Loading sold comps map…
Walkable amenities ~0.75 mi
Loading nearby amenities…
Taxation est. · year 1
- Rental income
- $38,268
- − Mortgage interest
- −$12,598
- − Property taxes
- −$1,608
- − Insurance
- −$1,124
- − Repairs & maintenance
- −$3,061
- − Management
- −$3,061
- − Depreciation
- −$6,543
- Taxable income
- $10,273
- Est. tax owed @ 24.0%
- −$2,465
- After-tax cash flow
- $10,881/yr
For passive investors: Depreciation is non-cash, so a rental often shows a tax loss while cash-flowing — sheltering income. Rental losses are passive: they offset passive income freely, and up to $25,000/yr can offset ordinary (W-2) income if you actively participate and your MAGI is under $100k (phasing out to $0 by $150k); unused losses carry forward. On sale, claimed depreciation is recaptured at up to 25%, and gains may owe capital-gains tax (a 1031 exchange can defer both). Figures are a year-1 estimate at your 24.0% rate — not tax advice; consult a CPA.
Schools (NCES district)
- District
- Pearl Public School District
- NCES district ID
- 2803520
- Math proficiency
- 44% ▼ -9.00%
- Reading proficiency
- 42% ▼ -9.00%
- Median HH income
- $42,525
- Composite
- 36.29/100
- National rank
- #4699
- State rank
- #32 of 130 in MS
Livability — Pearl
- Score
- 73/100
- State rank
- #19
- US rank
- #5662
Category grades
Schools grade is shown separately in the Schools card above.
Census & demographics
- Census place
- Pearl, MS
- County
- Rankin County · 123,614 people
- City population
- 34,442
- Metro
- Jackson, MS
- Population (ZIP)
- 34,442
- Household income
- $65,480
- Rent vs Own
- Severe rent burden
- 1235.0
Population outlook (Rankin County) Hauer SSP2
- Today (2025)
- 164,317 people
- By 2030
- 171,013 · +4.1%
- By 2040
- 182,723 · +11.2%
- By 2050
- 192,376 · +17.1%
- By 2075
- 209,535 · +27.5%
- By 2100
- 209,534 · +27.5%
Race, ethnicity, and origin ACS 2023
- Neighborhood character
- Majority White (60%)
- Race & ethnicity
- White 60% Black 31% Hispanic / Latino 5% Two or more races 3% Asian 2%
- Common ancestry
- Italian 5% Slovak 1% Serbian 1%
- Foreign-born
- 3% · Canada, China
- Languages at home
- 93% English-only · Spanish 4% Other Indo-European 1% Other Asian/Pacific 1%
Political lean MEDSL · Rankin
- 2024 margin
- Solid R (+47.1) · D 25.9% · R 73.0% · Other 1.0%
- 2008→2024 swing
- +6.4pp toward D · 2008: -53.5pp · 2024: -47.1pp
- All cycles
- 2024: R+47.1 2020: R+45.4 2016: R+52.9 2012: R+51.9 2008: R+53.5
Not yet ingested
- Civics
- —
Market trends
- HPI YoY
- ▼ -49.11%
- Current HPI
- 193.0609
- Rent YoY
- ▲ 6.34%
- Metro
- Jackson, MS
- State GDP YoY
- —
- F500 in state
- 0
Price history
3 events — show timeline
- 2026-05-20 Listed $224,900 MLSU
- 2021-10-22 Sold (Public Records) — Public Records
- 2021-09-10 Sold (Public Records) — Public Records
Property tax history
+2.0%/yrLatest (2025): $1,608 · -2.9% YoY. Source: county tax records.
Cash-flow waterfall
monthlySold comps — $/sqft
last 12 mo · ≤1 miLoading sold comps…