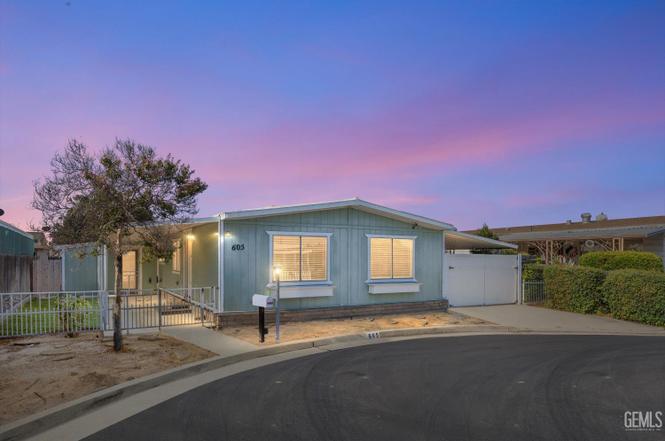
605 46th St · Bakersfield, CA
Flood risk 1/10 · Minimal
- FEMA flood zone
- X
- Chance of flooding over 30 yrs
- 0.0%
- Est. flood insurance / yr
- $507 – $1,088
Fire risk 5/10 · Moderate
- Est. fire insurance / yr
- $659 – $1,223
Heat risk 8/10 · Major
- Hot days now (above 105°F)
- 7 days/yr
- Hot days in 30 yrs
- 18 days/yr
Wind risk 1/10 · Minimal
- Chance of severe wind over 30 yrs
- —
Air-quality risk 10/10 · Severe
- Unhealthy air days now
- 39 days/yr
- Unhealthy air days in 30 yrs
- 45 days/yr
Risk factors via First Street. Map © Google.
Why this score? — see what drove the B grade
The composite is a weighted blend of 9 inputs, each scored 0–100. Each bar is that input's sub-score; the figure is the points it added to the 100-point composite (weight × sub-score).
- Cash flow +30.0/30.0
- ARV discount +15.0/15.0
- 1% rule +10.0/10.0
- DSCR +10.0/10.0
- Schools +3.4/10.0
- Livability +2.9/5.0
- Condition / age +2.5/5.0
- Rent growth +1.2/5.0
- Appreciation +0.0/10.0
$75,990
🖨 Deal sheet 📄 Offer letter ✓ Due diligence
Listing remarks
Welcome to your new oasis in a vibrant 55-plus community where retirement dreams come to life! This charming 2-bedroom, 2-bathroom mobile home spans 1,152 square feet of thoughtfully designed living space, a beautiful remodeled kitchen, including a bonus room with its own entrance perfect for hobbies, guests, or that home office you've always wanted. Nestled at the end of a peaceful cul-de-sac, this property offers the perfect blend of privacy and community connection. Speaking of community, prepare to be spoiled by amenities that rival any resort! Take a refreshing dip in the swimming pool, unwind in the spa, or challenge neighbors to friendly matches at the pool and ping-pong tables. Your
Key facts
- Dog park
- 3-hole course
- Remodeled kitchen
Tags
Neighborhood map
What this means for you Summary
Snapshot
- This is a 3-bed/2.0-bath manufactured listed at $76k.
Deal economics
- At list price, monthly cash flow is $697 ($8k/yr) — positive.
- The deal already cash-flows at list — no discount required.
- Meets the 1% rule at list price ($1k rent vs $76k).
- Recommended offer: $71k (6.0% below list) — sets the bar for market timing.
- Cap rate 17.3% vs local median 3.6% in Bakersfield — top-decile yield for the area; either an underpriced asset or a hidden risk that comps aren't pricing in. Stress-test before assuming the spread holds.
Location & tenants
- Location reads 58/100 on livability (#716 in CA) — a working-class tenant base; expect higher turnover. Strengths: housing A+; Watch: health & safety D, schools D-, crime F.
- Kern High (urban): math 21% / reading 51% proficiency, ranked #860 of 1,400 in CA (top 61%) — families likely to look elsewhere, expect single-tenant / working-renter base with shorter leases.
- Market conditions: Rents falling (-5.1%/yr); 70 active listings in the ZIP; 35 comparable units currently listed for rent nearby; rentals leasing fast (median 3d on market — plan ~1-2 weeks tenant-placement turnaround); lower-income renter base — watch delinquency; 3,244 units permitted in Kern County in 2024 (73 in 5+ unit buildings).
- This rent runs 41% of the median local income ($44k/yr) — at the standard rent-burdened threshold; future hikes will face affordability resistance.
Forward outlook
- Local home prices are declining (-3.0%/yr); year-one equity from $526 of loan paydown is wiped out by about $2k of value loss. Plan a longer hold.
- Kern County population projected at +17% by 2050 — long-run rental-demand tailwind backs the buy-and-hold thesis.
- At projected returns (-3.0% appreciation + 0.0% rent growth), your $21k cash investment doubles in ~4 years — after that, you're playing with house money.
Negotiation context
- It's been on market 69 days — a 6% lower offer ($71k) is reasonable based on typical stale-listing flexibility.
- 2 sale attempts; this cycle's ask has dropped $14k (16%) from the opening price — seller is motivated, your offer sets the floor, not the list.
Risks & watch-outs
- Climate carrying-cost: moderate wildfire risk; extreme-heat days projected 7→18/yr by 2055 (HVAC capex compounding) — expect insurance premiums to compound above CPI over the hold.
Questions for the listing agent
- It's been on market 69 days. Have you received any prior offers? Is the seller open to a 6% concession, seller financing, or rate buy-down credit?
- Built in 1975 — when were the roof, HVAC, electrical panel, plumbing, and water heater last replaced?
- Why hasn't it sold? Are there any deal-killer items the seller is aware of (foundation, flood, title, zoning, code violations)?
- Is there a deadline driving the sale (1031 exchange, divorce, estate, relocation)? That informs how much negotiation room exists.
- Schools are D-rated, which usually means shorter tenancies and higher turnover. Who's the typical renter profile here, and what's been the actual vacancy rate?
- Crime grade is F in this area — have there been break-ins, vandalism, or insurance claims at this property in the last 3 years? What carrier currently insures it and at what premium?
- What's the average days-on-market for RENTAL listings here right now (not sales)? A rising rental-DOM trend means longer vacancies and softer asking-rent achievability than the comps imply.
- What's the recent tenant-quality profile in this submarket — average credit score on applications, eviction rate, late-payment / NSF rate, and stable-employment percentage? A property-management company in the area should have these aggregated.
- How much new for-sale + rental construction is in the pipeline within 1–3 miles? Heavy new supply typically softens prices + rents 12–24 months out; constrained supply supports both.
Investment metrics
- 1% rule
- 1.95% ✓
- Cap rate
- 17.30%
- Cash-on-cash
- 39.29%
- DSCR
- 2.75
- GRM
- 4.3
CMA / ARV
- ARV (on-the-fly)
- $95,616
- Comps found
- 8
Show comp detail 8 sales within ~0.75 mi
| Address | Dist | Beds/Ba | Sqft | Sold | Price | $/sf | Match |
|---|---|---|---|---|---|---|---|
| 701 42nd St | 0.14mi | 3/2.0 | 1,140 (-1%) | 6mo | $80,000 | $70 | 87 |
| 4324 Sabal Ct | 0.22mi | 2/2.0 (-1) | 1,152 (0%) | 1mo | $40,000 | $35 | 84 |
| 4300 Prince St | 0.16mi | 2/2.0 (-1) | 1,248 (+8%) | 7mo | $45,000 | $36 | 68 |
| 4209 Jewett Ave | 0.29mi | 2/2.0 (-1) | 1,200 (+4%) | 8mo | $99,999 | $83 | 68 |
| 605 44th St | 0.07mi | 3/2.0 | 1,296 (+12%) | 23mo | $105,000 | $81 | 57 |
| 400 E Roberts Ln #46 | 0.70mi | 2/2.0 (-1) | 1,152 (0%) | 10mo | $130,000 | $113 | 54 |
| 400 E Roberts Ln #110 | 0.70mi | 2/1.8 (-1) | 1,200 (+4%) | 20mo | $108,000 | $90 | 38 |
| 400 E Roberts Ln #110 | 0.70mi | 2/1.0 (-1) | 1,200 (+4%) | 20mo | $108,000 | $90 | 35 |
Match score weights: distance 35% · size 25% · config 20% · recency 20%. Top-matched comps best support the ARV.
Projected returns pro-forma
-3.0% appreciation · 0.0% rent growth · sell at horizon
- IRR
- 32.2%
- Equity multiple
- 2.30×
- Total profit
- $27,704
- Equity at exit
- $11,330
- IRR
- 37.7%
- Equity multiple
- 4.03×
- Total profit
- $64,422
- Equity at exit
- $6,570
Cash invested: $21,277 (down + closing). Projections, not guarantees.
Landlord ↔ Tenant lean methodology
- Overall (STATE)
- 18 Strongly Tenant-Friendly
- State California
- 18 Strongly Tenant-Friendly · D+13
- County
- — inherits STATE
- City
- — inherits STATE
ZIP-level market 93301
- Home prices YoY
- -9.4%
- Rents YoY
- -5.1%
- Active inventory
- 70
- Price-to-rent
- 4.3×
Monthly cashflow live
- Estimated rent
- $1,484 high interval (Pro) →
- Mortgage (P&I)
- −$398
- Tax from tax record
- −$46 /mo · $547/yr
- Insurance
- −$32
- HOA
- −$0
- Vacancy / Maint / Mgmt
- −$312
- Net cashflow
- $697
Break-even live
UW: 25.0% down · 7.5% · 30yr · 1.5% tax · 5.0% vac · 8.0% maint · 8.0% mgmt
Financing live
Cash to close
- Down payment
- $18,998
- Closing costs
- $2,280
- Reserves months
- —
- Total cash needed
- —
Loan-product check · same deal, 3 products live
Conventional
25% down · 7.5% · 30yr
- Down + closing
- —
- Monthly P&I
- —
- Monthly cashflow
- —
- DSCR
- —
- Eligible?
- —
Personal DTI + credit; lowest rate.
DSCR
20% down · 8.5% · 30yr
- Down + closing
- —
- Monthly P&I
- —
- Monthly cashflow
- —
- DSCR
- —
- Eligible?
- —
No personal income docs; deal must DSCR.
Hard money
10% down · 12.0% · 12mo
- Down + closing
- —
- Monthly P&I
- —
- Monthly cashflow
- —
- DSCR
- —
- Eligible?
- —
Short-term bridge; refi at stabilization.
Rent comps 35 comps
| Address | Beds | Baths | Sqft | Rent | $/sqft | DOM | Units | Dist |
|---|---|---|---|---|---|---|---|---|
| 901 W Columbus St Apt 232 Bakersfield, CA | 2.0 | 1.0 | 864 | $1,165 | $1.35 | 21d | 1 | 0.15mi |
| 901 W Columbus St Bakersfield, CA | 1.0–2.0 | 1.0 | 807 | $1,425 | $1.77 | 2d | 12 | 0.16mi |
| 901 W Columbus St Unit 236 Bakersfield, CA | 2.0 | 1.0 | 864 | $1,325 | $1.53 | 43d | 1 | 0.18mi |
| 901 W Columbus St Unit 266 Bakersfield, CA | 2.0 | 1.0 | 864 | $1,325 | $1.53 | 21d | 1 | 0.22mi |
| 4504 Tierra Verde St Unit C Bakersfield, CA | 2.0 | 1.5 | 925 | $1,595 | $1.72 | 2d | 1 | 0.27mi |
| 1201 40th St Bakersfield, CA | 2.0–3.0 | 1.0–2.0 | 870 | $1,219 | $1.40 | 2d | 1 | 0.45mi |
| 3700 Q St Bakersfield, CA | 3.0 | 2.0 | 1088 | $1,600 | $1.47 | 3d | 1 | 0.46mi |
| 3701 Q St Bakersfield, CA | 2.0 | 1.0 | 615 | $1,200 | $1.95 | 2d | 5 | 0.49mi |
| 3817 K St Unit A Bakersfield, CA | 2.0 | 1.0 | 763 | $1,285 | $1.68 | 2d | 1 | 0.56mi |
| 2520 Loma Linda Dr Bakersfield, CA | 3.0 | 2.0 | 1200 | $2,075 | $1.73 | 10d | 1 | 0.71mi |
| 3311 Union Ave Unit 20 Bakersfield, CA | 2.0 | 1.0 | 750 | $950 | $1.27 | 2d | 1 | 0.83mi |
| 1000 30th St Unit B Bakersfield, CA | 2.0 | 1.0 | 838 | $1,395 | $1.66 | 2d | 1 | 0.93mi |
| 715 30th St Bakersfield, CA | 3.0 | 1.0 | 1000 | $1,500 | $1.50 | 21d | 1 | 0.95mi |
| 617 30th St Apt B Bakersfield, CA | 2.0 | 1.0 | 918 | $1,225 | $1.33 | 10d | 1 | 0.95mi |
| 516 28th St Unit 4 Bakersfield, CA | 2.0 | 1.0 | 900 | $1,075 | $1.19 | 2d | 1 | 1.00mi |
| 217 Jefferson St Bakersfield, CA | 3.0 | 2.0 | 980 | $1,550 | $1.58 | 21d | 1 | 1.01mi |
| 106 E Warren Ave Bakersfield, CA | 3.0 | 2.0 | 1169 | $1,400 | $1.20 | 10d | 1 | 1.05mi |
| 631 28th St Unit 3 Bakersfield, CA | 2.0 | 1.0 | 1040 | $1,075 | $1.03 | 21d | 1 | 1.05mi |
| 631 28th St Unit 5 Bakersfield, CA | 2.0 | 1.0 | 1040 | $1,075 | $1.03 | 2d | 1 | 1.05mi |
| 327 McCord Ave Unit 6 Bakersfield, CA | 3.0 | 1.0 | 1000 | $1,500 | $1.50 | 2d | 1 | 1.10mi |
| 222 Moneta Ave Unit 222 Bakersfield, CA | 3.0 | 2.0 | 1040 | $1,700 | $1.63 | 2d | 1 | 1.10mi |
| 415 Jeffrey St Bakersfield, CA | 2.0 | 1.0 | 1000 | $1,400 | $1.40 | 2d | 1 | 1.11mi |
| 448 S Oildale Dr Bakersfield, CA | 3.0 | 2.0 | 1080 | $1,500 | $1.39 | 2d | 1 | 1.12mi |
| 1951 Golden State Ave Bakersfield, CA | 1.0–3.0 | 1.0–2.5 | 1017 | $1,695 | $1.67 | 2d | 2 | 1.14mi |
| 3333 El Encanto Ct Bakersfield, CA | 2.0 | 2.0 | 990 | $1,595 | $1.61 | 14d | 1 | 1.17mi |
| 3333 El Encanto Ct Bakersfield, CA | 2.0 | 1.5 | 990 | $1,495 | $1.51 | 2d | 1 | 1.17mi |
| 222 Harding Ave Unit B Bakersfield, CA | 3.0 | 2.0 | 1100 | $1,750 | $1.59 | 2d | 1 | 1.18mi |
| 213 Oildale Dr Unit A Bakersfield, CA | 2.0 | 2.0 | 928 | $1,195 | $1.29 | 2d | 1 | 1.28mi |
| 627 Hood Dr Bakersfield, CA | 3.0 | 1.0 | 1140 | $1,795 | $1.57 | 2d | 1 | 1.36mi |
| 504 Quincy St Unit D Bakersfield, CA | 2.0 | 1.0 | 725 | $1,100 | $1.52 | 10d | 1 | 1.37mi |
| 627 Beardsley Ave Bakersfield, CA | 3.0 | 1.0 | 967 | $1,575 | $1.63 | 43d | 1 | 1.38mi |
| 700 Knotts St Unit C Bakersfield, CA | 2.0 | 1.0 | 850 | $950 | $1.12 | 10d | 1 | 1.40mi |
| 700 Knotts St Apt A Bakersfield, CA | 2.0 | 1.0 | 850 | $950 | $1.12 | 21d | 1 | 1.40mi |
| 706 Huskey Dr Bakersfield, CA | 2.0 | 1.0 | 832 | $1,450 | $1.74 | 43d | 1 | 1.42mi |
| 927 University Ave Bakersfield, CA | 3.0 | 1.0 | 1077 | $2,300 | $2.14 | 2d | 1 | 1.48mi |
Listing history 5 events
-
2026-04-13status Pending
-
2026-03-27price $75,990
-
2026-02-03$89,990 Active
-
2025-10-02price $89,990
-
2025-07-21$95,000 Active
ⓘ Source: listings_history table (triggers on properties + properties_extension) + one-shot
backfill from property_details.listing_events for pre-trigger history.
Tax reassessment forecast CA · Resets to sale price
- Current annual tax
- $547 · $46/mo
- Projected year-2 tax
- $578 · $48/mo
- Expected delta
- +$31/yr (+$3/mo · 5.6%)
ⓘ Screening estimate from a state-policy table — verify with the county assessor before closing.
Climate risk First Street
- Flood 1/10 Low FEMA zone X · 0% chance over 30 yrs
- Wildfire 5/10 Major
- Heat 8/10 Severe 7 d/yr ≥105°F today · 18 d/yr by 30 yrs out
- Wind 1/10 Low
- Air quality 10/10 Extreme 39 unhealthy d/yr today · 45 by 30 yrs out
Nearby sold comps map
Loading sold comps map…
Walkable amenities ~0.75 mi
Loading nearby amenities…
Taxation est. · year 1
- Rental income
- $17,810
- − Mortgage interest
- −$4,257
- − Property taxes
- −$547
- − Insurance
- −$380
- − Repairs & maintenance
- −$1,425
- − Management
- −$1,425
- − Depreciation
- −$2,211
- Taxable income
- $7,566
- Est. tax owed @ 24.0%
- −$1,816
- After-tax cash flow
- $6,545/yr
For passive investors: Depreciation is non-cash, so a rental often shows a tax loss while cash-flowing — sheltering income. Rental losses are passive: they offset passive income freely, and up to $25,000/yr can offset ordinary (W-2) income if you actively participate and your MAGI is under $100k (phasing out to $0 by $150k); unused losses carry forward. On sale, claimed depreciation is recaptured at up to 25%, and gains may owe capital-gains tax (a 1031 exchange can defer both). Figures are a year-1 estimate at your 24.0% rate — not tax advice; consult a CPA.
Schools (NCES district)
- District
- Kern High
- NCES district ID
- 0619540
- Math proficiency
- 21% ▬ 0.00%
- Reading proficiency
- 51% ▲ 2.00%
- Median HH income
- $49,686
- Composite
- 33.68/100
- National rank
- #10443
- State rank
- #860 of 1400 in CA
Livability — Bakersfield
- Score
- 58/100
- State rank
- #716
- US rank
- #21355
Category grades
Schools grade is shown separately in the Schools card above.
Census & demographics
- Census place
- Bakersfield, CA
- County
- Kern County · 710,371 people
- City population
- 499,124
- Metro
- Bakersfield, CA
- Population (ZIP)
- 13,620
- Household income
- $43,561
- Rent vs Own
- Severe rent burden
- 1296.0
Population outlook (Kern County) Hauer SSP2
- Today (2025)
- 947,286 people
- By 2030
- 978,984 · +3.3%
- By 2040
- 1,045,018 · +10.3%
- By 2050
- 1,105,232 · +16.7%
- By 2075
- 1,229,538 · +29.8%
- By 2100
- 1,238,059 · +30.7%
Race, ethnicity, and origin ACS 2023
- Neighborhood character
- Diverse neighborhood (Simpson 0.63)
- Race & ethnicity
- Hispanic / Latino 45% White 41% Two or more races 16% Black 5% Native American 2% Asian 2%
- Hispanic origin (detail)
- Mexican 37% Puerto Rican 5%
- Common ancestry
- Slovak 2% Scotch-Irish 2% Subsaharan African 2%
- Foreign-born
- 10% · Canada, South Korea
- Languages at home
- 68% English-only · Spanish 29% Russian/Polish/Slavic 2%
Political lean MEDSL · Kern
- 2024 margin
- Strong R (+21.1) · D 38.2% · R 59.3% · Other 2.5%
- 2008→2024 swing
- -3.3pp toward R · 2008: -17.8pp · 2024: -21.1pp
- All cycles
- 2024: R+21.1 2020: R+10.2 2016: R+15.0 2012: R+20.9 2008: R+17.8
Not yet ingested
- Civics
- —
Market trends
- HPI YoY
- ▼ -38.38%
- Current HPI
- 370.1318
- Rent YoY
- ▼ -5.12%
- Metro
- Bakersfield, CA
- State GDP YoY
- ▲ 3.21%
- F500 in state
- 116
Industry mix (Fortune 500 HQ in CA)
| Industry | F500 HQs | Revenue |
|---|---|---|
| Technology | 27 | $1,492B |
|
||
| Financial Services | 3 | $174B |
|
||
| Retail | 3 | $44B |
|
||
| Insurance | 3 | $26B |
|
||
| Media / Entertainment | 2 | $115B |
|
||
| Pharmaceuticals / Biotech | 2 | $62B |
|
||
Price history
-20.0% since first listed5 events — show timeline
- 2026-04-13 Pending — GEMLS
- 2026-03-27 Price Changed $75,990 GEMLS
- 2026-02-03 Listed $89,990 GEMLS
- 2025-10-02 Price Changed $89,990 GEMLS
- 2025-07-21 Listed $95,000 GEMLS
Property tax history
+30.1%/yrLatest (2025): $547 · +4.4% YoY. Source: county tax records.
Cash-flow waterfall
monthlySold comps — $/sqft
last 12 mo · ≤1 miLoading sold comps…