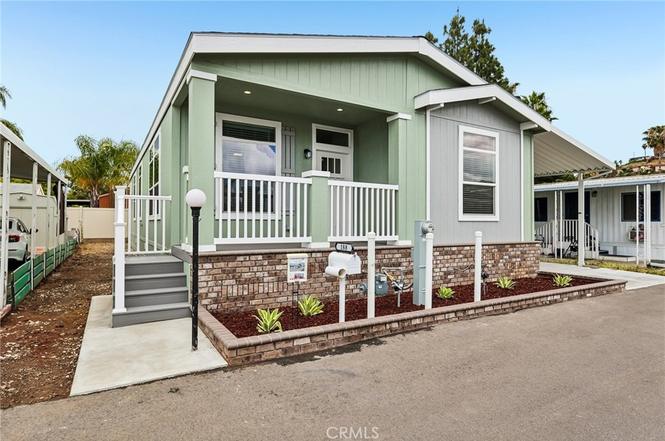
410 S 1st St #188 · El Cajon, CA
Flood risk 4/10 · Minor
- FEMA flood zone
- X (shaded)
- Chance of flooding over 30 yrs
- 0.22%
- Est. flood insurance / yr
- $507 – $1,088
Fire risk 1/10 · Minimal
- Est. fire insurance / yr
- $659 – $1,223
Heat risk 5/10 · Moderate
- Hot days now (above 99°F)
- 6 days/yr
- Hot days in 30 yrs
- 18 days/yr
Wind risk 1/10 · Minimal
- Chance of severe wind over 30 yrs
- —
Air-quality risk 4/10 · Minor
- Unhealthy air days now
- 6 days/yr
- Unhealthy air days in 30 yrs
- 7 days/yr
Risk factors via First Street. Map © Google.
Why this score? — see what drove the C+ grade
The composite is a weighted blend of 9 inputs, each scored 0–100. Each bar is that input's sub-score; the figure is the points it added to the 100-point composite (weight × sub-score).
- Cash flow +25.1/30.0
- DSCR +8.2/10.0
- ARV discount +7.5/15.0
- 1% rule +6.6/10.0
- Schools +4.0/10.0
- Condition / age +4.0/5.0
- Livability +3.5/5.0
- Rent growth +1.8/5.0
- Appreciation +0.0/10.0
$259,000
🖨 Deal sheet (PDF) 📄 Offer letter ✓ Due diligence
Listing remarks
Discover comfort, community, and easy California living in this beautifully maintained manufactured home located in a welcoming senior community in El Cajon. Nestled in a peaceful mobile home park, this residence offers the perfect blend of affordability, convenience, and relaxed lifestyle living. Enjoy spacious interiors, abundant natural light, and a friendly neighborhood atmosphere designed for active seniors seeking comfort and connection. Your next chapter starts here—where quality living meets a vibrant 55+ community in the heart of El Cajon. 410 South 1st. Street Space#188 El Cajon, CA 92019
Key facts
- Parking
- Community pool
- Built 2025
Property features AI
Finance
- Other: Lot density: 0-1 Unit/Acre; Elevation units in feet
- Financial info: Land lease: $1,150 monthly
- HOA & community: Senior community; Street lighting in community; Park: El Cajon Valley; Manager approval required; Pets allowed with breed restrictions
Exterior
- Parking: Carport (1 space)
- Utilities: Standard electric service; Natural gas connected; Public/district water; Public sewer; Electricity and sewer connected
- Home design: Single-story; Entry level: 1; Mobile home (26' x 56'); Model 28563P; Mobile home remains on site
- Construction: Shingle roof; Built by builder (year built source: Builder)
- Exterior features: Awning; Community pool
Interior
- Kitchen: Gas cooktop; Garbage disposal; Microwave
- Bedrooms: All bedrooms on one level
- Flooring: Laminate flooring
- Bathrooms: Two full bathrooms; Shower-in-tub and exhaust fans
- Heating & cooling: Central furnace heating; Central air conditioning
- Interior features: Ceiling fan; Blinds and window screens; Front and back door entry
- Laundry & utility: Inside laundry
Neighborhood map
What this means for you Summary
Snapshot
- This is a 3-bed/2.0-bath manufactured listed at $259k. Condition is rated good.
Deal economics
- At list price, monthly cash flow is $574 ($7k/yr) — positive.
- The deal already cash-flows at list — no discount required.
- Meets the 1% rule at list price ($3k rent vs $259k).
- Recommended offer: $236k (9.0% below list) — sets the bar for market timing.
- Cap rate 9.0% vs local median 2.4% in El Cajon — top-decile yield for the area; either an underpriced asset or a hidden risk that comps aren't pricing in. Stress-test before assuming the spread holds.
Location & tenants
- Location reads 70/100 on livability (#230 in CA) — a middle-class / working-renter tenant base. Strengths: amenities A+, commute A+; Watch: health & safety C-, crime D+, cost of living F.
- Grossmont Union High (suburban): math 31% / reading 60% proficiency, ranked #173 of 517 in CA (top 34%) — families likely to look elsewhere, expect single-tenant / working-renter base with shorter leases; only 17% free/reduced lunch — higher-income household profile.
- Market conditions: Rents soft (-2.6%/yr); 137 active listings in the ZIP; 40 comparable units currently listed for rent nearby; rentals leasing fast (median 0d on market — plan ~1-2 weeks tenant-placement turnaround); solid renter incomes; 11,759 units permitted in San Diego County in 2024 (7,244 in 5+ unit buildings).
- This rent runs 35% of the median local income ($102k/yr) — at the standard rent-burdened threshold; future hikes will face affordability resistance.
Forward outlook
- Local home prices are declining (-3.0%/yr); year-one equity from $2k of loan paydown is wiped out by about $8k of value loss. Plan a longer hold.
- San Diego County population projected at +20% by 2050 — long-run rental-demand tailwind backs the buy-and-hold thesis.
Negotiation context
- It's been on market 112 days — a 9% lower offer ($236k) is reasonable based on typical stale-listing flexibility.
Risks & watch-outs
- Climate carrying-cost: extreme-heat days projected 6→18/yr by 2055 (HVAC capex compounding) — expect insurance premiums to compound above CPI over the hold.
Questions for the listing agent
- It's been on market 112 days. Have you received any prior offers? Is the seller open to a 9% concession, seller financing, or rate buy-down credit?
- Why hasn't it sold? Are there any deal-killer items the seller is aware of (foundation, flood, title, zoning, code violations)?
- Is there a deadline driving the sale (1031 exchange, divorce, estate, relocation)? That informs how much negotiation room exists.
- Crime grade is D in this area — have there been break-ins, vandalism, or insurance claims at this property in the last 3 years? What carrier currently insures it and at what premium?
- What's the average days-on-market for RENTAL listings here right now (not sales)? A rising rental-DOM trend means longer vacancies and softer asking-rent achievability than the comps imply.
- What's the recent tenant-quality profile in this submarket — average credit score on applications, eviction rate, late-payment / NSF rate, and stable-employment percentage? A property-management company in the area should have these aggregated.
- How much new for-sale + rental construction is in the pipeline within 1–3 miles? Heavy new supply typically softens prices + rents 12–24 months out; constrained supply supports both.
Investment metrics
- 1% rule
- 1.16% ✓
- Cap rate
- 8.95%
- Cash-on-cash
- 9.50%
- DSCR
- 1.42
- GRM
- 7.2
CMA / ARV
No comps found within radius.
Projected returns pro-forma
-3.0% appreciation · 0.0% rent growth · sell at horizon
- IRR
- -5.4%
- Equity multiple
- 0.81×
- Total profit
- $-14,141
- Equity at exit
- $38,618
- IRR
- 0.2%
- Equity multiple
- 1.01×
- Total profit
- $1,048
- Equity at exit
- $22,394
Cash invested: $72,520 (down + closing). Projections, not guarantees.
Landlord ↔ Tenant lean methodology
- Overall (STATE)
- 18 Strongly Tenant-Friendly
- State California
- 18 Strongly Tenant-Friendly · D+13
- County
- — inherits STATE
- City
- — inherits STATE
ZIP-level market 92019
- Rents YoY
- -2.6%
- Active inventory
- 137
- Price-to-rent
- 7.2×
Monthly cashflow live
- Estimated rent
- $2,992 high interval (Pro) →
- Mortgage (P&I)
- −$1,358
- Tax est. 1.5%
- −$324 /mo · $3,885/yr
- Insurance
- −$108
- HOA
- −$0
- Vacancy / Maint / Mgmt
- −$628
- Net cashflow
- $574
Break-even live
Sensitivity live
| Price | -10% $753 | -5% $663 | +0% $574 | +5% $484 | +10% $395 |
|---|---|---|---|---|---|
| Rent | -10% $338 | -5% $456 | +0% $574 | +5% $692 | +10% $810 |
| Rate | -1.0pp $704 | -0.5pp $640 | base $574 | +0.5pp $507 | +1.0pp $439 |
UW: 25.0% down · 7.5% · 30yr · 1.5% tax · 5.0% vac · 8.0% maint · 8.0% mgmt
Financing live
Cash to close
- Down payment
- $64,750
- Closing costs
- $7,770
- Reserves months
- —
- Total cash needed
- —
Loan-product check · same deal, 3 products live
Conventional
25% down · 7.5% · 30yr
- Down + closing
- —
- Monthly P&I
- —
- Monthly cashflow
- —
- DSCR
- —
- Eligible?
- —
Personal DTI + credit; lowest rate.
DSCR
20% down · 8.5% · 30yr
- Down + closing
- —
- Monthly P&I
- —
- Monthly cashflow
- —
- DSCR
- —
- Eligible?
- —
No personal income docs; deal must DSCR.
Hard money
10% down · 12.0% · 12mo
- Down + closing
- —
- Monthly P&I
- —
- Monthly cashflow
- —
- DSCR
- —
- Eligible?
- —
Short-term bridge; refi at stabilization.
Rent comps 40 comps
| Address | Beds | Baths | Sqft | Rent | $/sqft | DOM | Units | Dist |
|---|---|---|---|---|---|---|---|---|
| 1065 E Washington Ave El Cajon, CA | 3.0 | 2.0 | 1100 | $2,850 | $2.59 | 0d | 1 | 0.12mi |
| 1065 E Washington Ave Apt N El Cajon, CA | 3.0 | 2.0 | 1100 | $2,850 | $2.59 | 18d | 1 | 0.12mi |
| 639 Bighorn Ct El Cajon, CA | 3.0 | 2.0 | 1150 | $4,300 | $3.74 | 0d | 1 | 0.15mi |
| 975 E Washington Ave Apt E El Cajon, CA | 2.0 | 1.0 | 900 | $2,100 | $2.33 | 22d | 1 | 0.21mi |
| 1041-89 E Lexington Ave El Cajon, CA | 1.0–2.0 | 1.0–2.0 | 838 | $2,355 | $2.81 | 0d | 7 | 0.21mi |
| 957 E Washington Ave El Cajon, CA | 2.0 | 2.0 | 900 | $2,295 | $2.55 | 0d | 1 | 0.24mi |
| 1037 E Lexington Ave El Cajon, CA | 1.0–3.0 | 1.0–2.0 | 855 | $2,750 | $3.22 | 0d | 5 | 0.25mi |
| 1137 E Lexington Ave El Cajon, CA | 2.0 | 1.0 | 900 | $1,995 | $2.22 | 0d | 1 | 0.30mi |
| 602 S Mollison Ave Unit C El Cajon, CA | 2.0 | 2.0 | 1024 | $2,600 | $2.54 | 0d | 1 | 0.32mi |
| 758 S Mollison Ave El Cajon, CA | 2.0 | 1.0 | 875 | $1,945 | $2.22 | 0d | 2 | 0.38mi |
| 447 S Lincoln Ave El Cajon, CA | 2.0 | 1.5 | 928 | $2,300 | $2.48 | 0d | 1 | 0.43mi |
| 800 E Lexington Ave El Cajon, CA | 2.0–3.0 | 2.0 | 1040 | $3,210 | $3.09 | 0d | 5 | 0.45mi |
| 200 S Mollison Ave El Cajon, CA | 2.0 | 1.0 | 950 | $1,995 | $2.10 | 0d | 1 | 0.45mi |
| 415 S Lincoln Ave El Cajon, CA | 1.0–2.0 | 1.0–2.0 | 749 | $2,359 | $3.15 | 0d | 5 | 0.47mi |
| 351 S Lincoln Ave El Cajon, CA | 2.0 | 2.0 | 900 | $2,395 | $2.66 | 0d | 1 | 0.47mi |
| 620 E Lexington Ave #3 El Cajon, CA | 2.0 | 2.0 | 1000 | $2,900 | $2.90 | 2d | 1 | 0.58mi |
| 233 N Mollison Ave El Cajon, CA | 1.0–2.0 | 1.0–2.0 | 843 | $2,131 | $2.53 | 0d | 10 | 0.59mi |
| 1026 S Mollison Ave El Cajon, CA | 3.0 | 2.5 | 1771 | $4,000 | $2.26 | 0d | 1 | 0.61mi |
| 1020 S Mollison Ave El Cajon, CA | 3.0 | 2.5 | 1768 | $4,100 | $2.32 | 0d | 1 | 0.61mi |
| 1036 S Mollison Ave El Cajon, CA | 3.0 | 2.5 | 1776 | $4,350 | $2.45 | 0d | 1 | 0.61mi |
| 805 Benny Way El Cajon, CA | 3.0 | 3.0 | 1477 | $4,300 | $2.91 | 3d | 1 | 0.61mi |
| 851 Taft Ave El Cajon, CA | 3.0 | 2.0 | 1792 | $3,850 | $2.15 | 0d | 1 | 0.64mi |
| 280 N Mollison Ave El Cajon, CA | 1.0–2.0 | 1.0 | 825 | $2,195 | $2.66 | 0d | 1 | 0.68mi |
| 148 Taft Ave Unit 7 El Cajon, CA | 2.0 | 1.0 | 875 | $1,870 | $2.14 | 0d | 1 | 0.72mi |
| 346 Jamacha Rd El Cajon, CA | 2.0 | 1.0–2.0 | 887 | $2,442 | $2.75 | 0d | 8 | 0.73mi |
| 432 Dominguez Way Unit 13 El Cajon, CA | 2.0 | 1.5 | 952 | $2,195 | $2.31 | 21d | 1 | 0.76mi |
| 291 Jamacha Rd El Cajon, CA | 1.0–2.0 | 1.0 | 825 | $2,095 | $2.54 | 0d | 4 | 0.78mi |
| 280 Roanoke Rd El Cajon, CA | 2.0 | 2.0 | 1024 | $2,395 | $2.34 | 0d | 1 | 0.79mi |
| 280 Roanoke Rd Unit 1 El Cajon, CA | 2.0 | 1.5 | 1024 | $2,395 | $2.34 | 0d | 1 | 0.79mi |
| 1380 E Washington Ave Unit 49W El Cajon, CA | 3.0 | 3.0 | 1446 | $3,550 | $2.46 | 8d | 1 | 0.80mi |
| 480 Jamacha Rd El Cajon, CA | 2.0 | 2.0 | 913 | $2,495 | $2.73 | 0d | 1 | 0.82mi |
| 422 Shady Ln El Cajon, CA | 1.0–3.0 | 1.0–2.0 | 900 | $2,804 | $3.12 | 0d | 19 | 0.85mi |
| 534 Jeffree St El Cajon, CA | 3.0 | 2.0 | 1118 | $3,895 | $3.48 | 10d | 1 | 0.95mi |
| 534 Jeffree St El Cajon, CA | 3.0 | 2.0 | 1118 | $3,895 | $3.48 | 4d | 1 | 0.95mi |
| 505 E Madison Ave #89 El Cajon, CA | 2.0 | 1.5 | 975 | $2,350 | $2.41 | 3d | 1 | 0.97mi |
| 455 Ballantyne St El Cajon, CA | 2.0 | 1.5 | 925 | $2,195 | $2.37 | 0d | 1 | 1.01mi |
| 761 S Orange Ave Unit B El Cajon, CA | 2.0 | 1.0 | 1000 | $2,095 | $2.10 | 0d | 1 | 1.01mi |
| 340 Wells Ave El Cajon, CA | 2.0 | 2.0 | 1000 | $2,775 | $2.77 | 0d | 2 | 1.03mi |
| 345 Dahlia Way El Cajon, CA | 3.0 | 2.5 | 1700 | $4,200 | $2.47 | 2d | 1 | 1.05mi |
| 921 S Sunshine Ave El Cajon, CA | 2.0 | 2.0 | 900 | $2,350 | $2.61 | 0d | 2 | 1.11mi |
Listing history 16 events
-
2026-06-18days on market $259,000 Active 112 DOM
-
2026-06-17days on market $259,000 Active 111 DOM
-
2026-06-16days on market $259,000 Active 110 DOM
-
2026-06-15days on market $259,000 Active 109 DOM
-
2026-06-13days on market $259,000 Active 107 DOM
-
2026-06-13days on market $259,000 Active 106 DOM
-
2026-06-09days on market $259,000 Active 103 DOM
-
2026-06-08pricedays on market $259,000 Active 102 DOM
-
2026-06-07days on market $264,900 Active 101 DOM
-
2026-06-04days on market $264,900 Active 98 DOM
-
2026-06-03days on market $264,900 Active 97 DOM
-
2026-06-02days on market $264,900 Active 96 DOM
-
2026-06-01days on market $264,900 Active 95 DOM
-
2026-05-31days on market $264,900 Active 94 DOM
-
2026-04-30price $264,900
-
2026-02-26$269,900 Active
ⓘ Source: listings_history table (triggers on properties + properties_extension) + one-shot
backfill from property_details.listing_events for pre-trigger history.
Climate risk First Street
- Flood 4/10 Moderate FEMA zone X (shaded) · 22% chance over 30 yrs
- Wildfire 1/10 Low
- Heat 5/10 Major 6 d/yr ≥99°F today · 18 d/yr by 30 yrs out
- Wind 1/10 Low
- Air quality 4/10 Moderate 6 unhealthy d/yr today · 7 by 30 yrs out
Nearby sold comps map
Loading sold comps map…
Walkable amenities ~0.75 mi
Loading nearby amenities…
Taxation est. · year 1
- Rental income
- $35,906
- − Mortgage interest
- −$14,508
- − Property taxes
- −$3,885
- − Insurance
- −$1,295
- − Repairs & maintenance
- −$2,872
- − Management
- −$2,872
- − Depreciation
- −$7,535
- Taxable income
- $2,938
- Est. tax owed @ 24.0%
- −$705
- After-tax cash flow
- $6,182/yr
For passive investors: Depreciation is non-cash, so a rental often shows a tax loss while cash-flowing — sheltering income. Rental losses are passive: they offset passive income freely, and up to $25,000/yr can offset ordinary (W-2) income if you actively participate and your MAGI is under $100k (phasing out to $0 by $150k); unused losses carry forward. On sale, claimed depreciation is recaptured at up to 25%, and gains may owe capital-gains tax (a 1031 exchange can defer both). Figures are a year-1 estimate at your 24.0% rate — not tax advice; consult a CPA.
Condition & rehab AI · 13 photos
This manufactured home is in good condition with no visible damage or wear. It has a good exterior, interior, and landscaping. Painting the exterior and landscaping improvements would increase its resale and rental value.
Value-add opportunities
- Resale Painting the exterior siding and roof — Painting the exterior can enhance the home's curb appeal and make it more attractive to potential buyers.
- Rental Landscaping improvements — Landscaping improvements can enhance the home's curb appeal and make it more attractive to potential renters.
Renovation cost estimate screening
Value-add ROI direction
- Resale Painting the exterior siding and roof — Painting the exterior can enhance the home's curb appeal and make it more attractive to potential buyers. ↑
- Rental Landscaping improvements — Landscaping improvements can enhance the home's curb appeal and make it more attractive to potential renters. ↑
ⓘ Cost ranges are severity-bucket heuristics (US national rule-of-thumb). Get contractor quotes + a written scope before underwriting a rehab budget.
Schools (NCES district)
- District
- Grossmont Union High
- NCES district ID
- 0616230
- Math proficiency
- 31% ▼ -1.00%
- Reading proficiency
- 60% ▲ 5.00%
- Median HH income
- $61,801
- Composite
- 40.07/100
- National rank
- #3810
- State rank
- #173 of 517 in CA
Livability — El Cajon
- Score
- 70/100
- State rank
- #230
- US rank
- #7531
Category grades
Schools grade is shown separately in the Schools card above.
Census & demographics
- Census place
- El Cajon, CA
- County
- San Diego County · 3,178,799 people
- City population
- 173,694
- Metro
- San Diego-Chula Vista-Carlsbad, CA
- Population (ZIP)
- 45,351
- Household income
- $101,973
- Rent vs Own
- Severe rent burden
- 1897.0
Population outlook (San Diego County) Hauer SSP2
- Today (2025)
- 3,678,185 people
- By 2030
- 3,856,546 · +4.8%
- By 2040
- 4,171,407 · +13.4%
- By 2050
- 4,421,607 · +20.2%
- By 2075
- 4,831,599 · +31.4%
- By 2100
- 4,832,502 · +31.4%
Race, ethnicity, and origin ACS 2023
- Neighborhood character
- Predominantly White (67%)
- Race & ethnicity
- White 67% Hispanic / Latino 21% Two or more races 15% Asian 3% Black 2%
- Hispanic origin (detail)
- Mexican 19%
- Common ancestry
- Arab 6% Romanian 2% Lithuanian 2%
- Foreign-born
- 22% · Canada, China
- Languages at home
- 69% English-only · Spanish 11% Arabic 10% Other Indo-European 1%
Political lean MEDSL · San Diego
- 2024 margin
- D (+16.8) · D 56.9% · R 40.1% · Other 2.9%
- 2008→2024 swing
- +6.6pp toward D · 2008: 10.2pp · 2024: 16.8pp
- All cycles
- 2024: D+16.8 2020: D+22.8 2016: D+17.8 2012: D+5.1 2008: D+10.2
Not yet ingested
- Civics
- —
Market trends
- HPI YoY
- ▼ -553.81%
- Current HPI
- 349.3085
- Rent YoY
- ▼ -2.61%
- Metro
- San Diego-Chula Vista-Carlsbad, CA
- State GDP YoY
- ▲ 3.21%
- F500 in state
- 116
Industry mix (Fortune 500 HQ in CA)
| Industry | F500 HQs | Revenue |
|---|---|---|
| Technology | 27 | $1,492B |
|
||
| Financial Services | 3 | $174B |
|
||
| Retail | 3 | $44B |
|
||
| Insurance | 3 | $26B |
|
||
| Media / Entertainment | 2 | $115B |
|
||
| Pharmaceuticals / Biotech | 2 | $62B |
|
||
Price history
-1.9% since first listed2 events — show timeline
- 2026-04-30 Price Changed $264,900 CRMLS
- 2026-02-26 Listed $269,900 CRMLS
Cash-flow waterfall
monthlySold comps — $/sqft
last 12 mo · ≤1 miLoading sold comps…